REVIEW 3 major objections 5 minor
Revisiting Generalization Across Difficulty Levels: It's Not So Easy
T0 review · 3 major / 5 minor · reviewed 2026-08-04 · deepseek-v4-flash
Pith's one-line read Fine-tuning a language model on only easy or only hard examples rarely improves performance at other difficulty levels, and the benefit shrinks as the difficulty gap widens.
desk verdict Solid empirical study casting real doubt on easy-only or hard-only training shortcuts, but the central claim leans on a difficulty-ordering assumption that gets only partial validation. read the letter →
The pith
A machine-rendered reading of the paper's core claim, the machinery that carries it, and where it could break.
The reading
What carries the argument
The engine of the analysis is a Rasch (1PL) Item Response Theory model, which treats each language model as a student and each benchmark question as an item. From correct/incorrect responses of thousands of models collected from a public leaderboard of evaluation results, IRT jointly estimates a single difficulty parameter per question and an ability parameter per model. The paper uses these scores to sort each dataset into ten equal-sized difficulty bins and then fine-tunes models on each bin individually, measuring accuracy on all other bins relative to the zero-shot baseline. The 1PL choice matters: more complex IRT variants with guessing or discrimination parameters produced unstable or
What would settle it
Re-run the experiment on a held-out set of questions whose true difficulty is known by construction, such as arithmetic problems with controlled operand size. If fine-tuning on only the easy constructed questions matches or beats fine-tuning on same-difficulty questions for the hard test questions, the claim of limited easy-to-hard transfer would be falsified. A smaller-scale check: compute IRT difficulty before and after fine-tuning on a sample of bins; if the ordering flips substantially for the fine-tuned models, the bin structure itself is the artifact.
Extended reading notes
Core claim
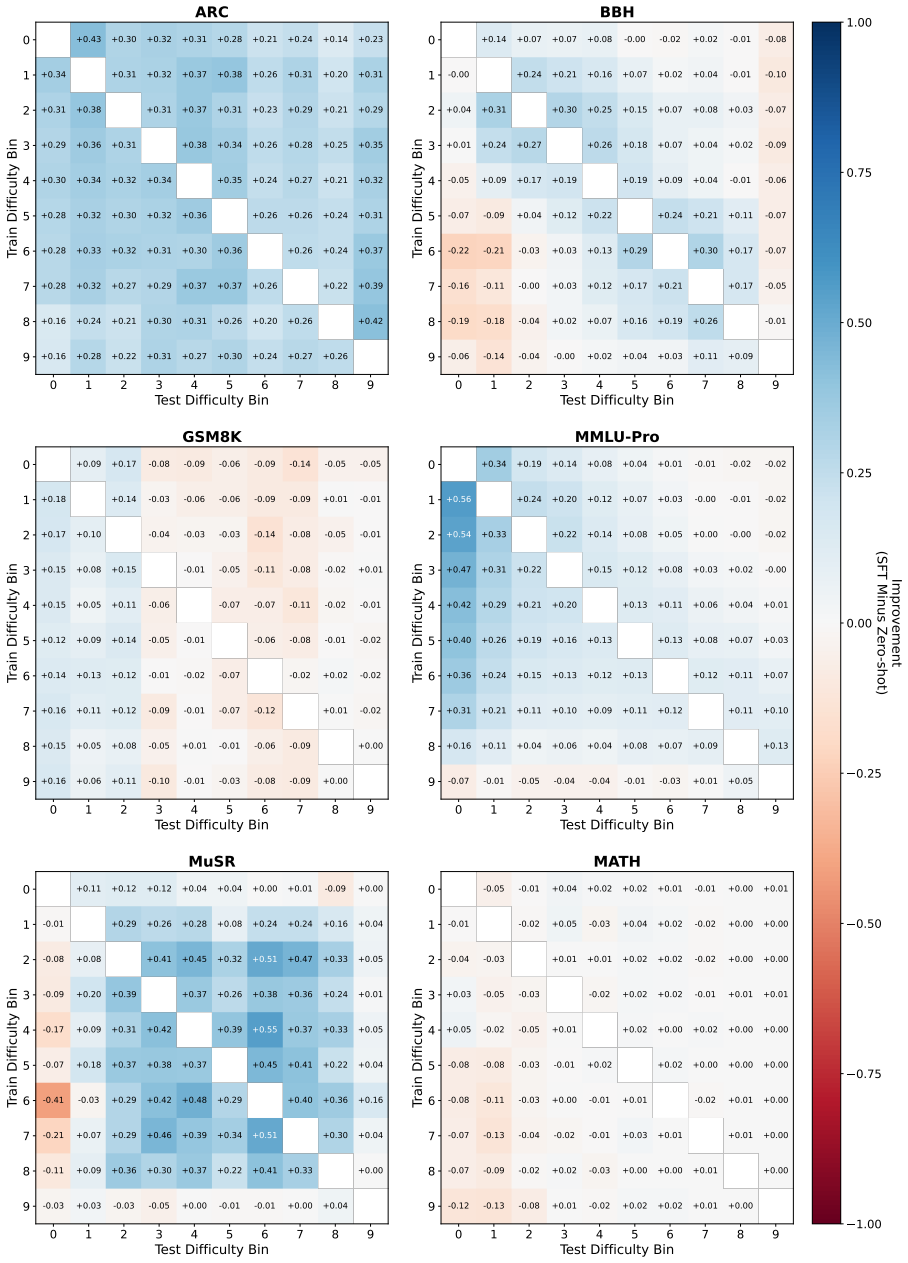
On the paper's own terms, the central discovery is that cross-difficulty generalization in instruction-tuned LLMs is limited and gap-dependent. When a model is fine-tuned on a single difficulty bin and evaluated across ten bins, the largest gains sit near the diagonal where train and test difficulty match. Moving away from that diagonal—whether toward harder or easier test bins—performance gains degrade and often fall below the zero-shot baseline. This holds across two model families, model sizes from 1B to 14B, and all six datasets, indicating that the effect reflects the difficulty structure of the data rather than any single model's capacity. A second finding is that IRT-based, purely mod
Load-bearing premise
The IRT difficulty scores computed from public leaderboard responses correctly order the examples for the specific models being fine-tuned, both before and after supervised fine-tuning.
Editorial extensions
If this is right
- Data curation should treat difficulty as a first-class axis: if you want a model to handle both easy and hard questions, training data must include both.
- Evaluation benchmarks that target only the hardest problems may overstate or understate a model's true capability profile, since hard-to-easy generalization cannot be assumed.
- Prior claims of easy-to-hard or hard-to-easy generalization based on coarse human labels likely conflated difficulty with other question properties; fine-grained model-based difficulty gives a different picture.
- The paper motivates curriculum and data-selection methods that explicitly account for difficulty gaps; training on adjacent bins is the most reliable observed way to improve a neighboring bin.
- These results provide a reproducible baseline for measuring cross-difficulty generalization on six public benchmarks with ten difficulty bins.
Reading between the lines
- A testable extension: if IRT difficulty is recomputed after fine-tuning, the bins may shift; models fine-tuned on hard data could become better at those same questions, reordering the difficulty scale and potentially restoring apparent hard-to-easy transfer.
- The weak correlation between human and IRT difficulty suggests that human-annotated 'easy' datasets for curriculum learning may be misaligned with what is actually easy for a given model family; difficulty-aware data selection should be recomputed per model rather than inherited from benchmarks.
- If the gap-dependence pattern is a general property of fine-tuning, then multi-task and continual-learning settings should expect negative transfer primarily from far-difficulty data; mixing nearby-difficulty examples may be a safer default than mixing extremes.
- The paper's single-bin design leaves open whether multi-bin curricula or adaptive sampling can overcome the limitation; a natural next experiment is to train on a mixture of bins and test whether the diagonal-only benefit persists.
Editorial analysis
A structured set of objections, weighed in public.
Referee Report
Summary. The paper studies cross-difficulty generalization in LLMs by estimating per-example difficulty with a 1PL Item Response Theory (IRT) model fitted to responses of thousands of Open LLM Leaderboard models on six benchmarks. The examples are split into ten equal-sized difficulty bins, and seven Qwen2.5/Llama3 instruction-tuned models are fine-tuned on each bin individually and then evaluated on all other bins, reporting improvement over the zero-shot baseline as heatmaps. The central claim is that cross-difficulty generalization is limited: training on easy or hard bins does not yield consistent gains across the full difficulty range, and performance degrades as the train–test difficulty gap increases. The paper also documents a weak or negative correlation between IRT-based difficulty and human-derived difficulty metrics, and concludes that benchmark design and data curation should explicitly account for model-based difficulty.
Significance. If the result holds, the paper provides a large-scale, model-based counterpoint to recent claims of easy-to-hard generalization (e.g., Hase et al. 2024; Sun et al. 2024) and a reusable resource of IRT difficulty scores for six common benchmarks. Its strengths include the scale of the IRT estimation (thousands of models), the breadth of evaluation (six datasets, seven models from two families), and the explicit release of code/data. The paper is honest about limitations (English-only, possible pretraining overlap, single-bin training) and includes per-model heatmaps in the appendix. However, the empirical conclusion is only as strong as the validity of the IRT difficulty ordering for the models actually fine-tuned, and the single-seed, no-error-bar analysis leaves quantitative claims under-supported. With targeted validation and uncertainty quantification, this would be a useful contribution to the data-curation and evaluation literature.
major comments (3)
- [§3.3, §5] The central claim rests on the validity of the IRT difficulty ordering for the seven Qwen2.5/Llama3 models used in fine-tuning, but the validation in §3.3 checks only two held-out Qwen3 zero-shot models. No evidence is given that the ten bins are monotonically ordered for the actual experimental models, either before or after SFT. IRT difficulty is population-relative; the paper's own argument in §3.4 that human difficulty is not a valid proxy for LLMs applies equally to transferring a leaderboard-population difficulty ordering to a specific model family. The Limitations section acknowledges that 'shifts in model capabilities... could change the level of difficulty,' but this is the load-bearing premise, not a peripheral caveat. Please report per-bin zero-shot accuracy for all seven experimental models (and, where feasible, for a sample of fine-tuned models), and analyze whether non-diff
- [§4, Appendix A] All fine-tuning runs use a single seed (seed 42) with no replication. Many reported improvements in Figure 4 are small: ARC deltas are almost all within ±0.05, and several MMLU-Pro and BBH cells differ by less than 0.03. With one seed, these values are within plausible noise for SFT on subsets of roughly 117–1,200 examples. The claims that cross-difficulty generalization is 'limited' and that performance 'drops below zero-shot' need at least three seeds or bootstrap confidence intervals, or a paired significance test contrasting diagonal-adjacent vs far-from-diagonal improvements. Without variance estimates, the heatmap interpretation is not quantitatively supported.
- [Appendix D (MATH)] The MATH training data are not the original problem–solution pairs: for each problem, the provided solution is replaced by sampled correct responses from Qwen2.5-14B and Llama3.1-8B at multiple temperatures. This introduces a second distribution shift that is confounded with difficulty. If solution style, verbosity, or format correlates with IRT bin, the MATH heatmaps in Figure 4 (and Appendix E) measure generalization across a mixture of difficulty and solution-style differences, not difficulty alone. The paper should either verify that the regenerated solutions are balanced across bins on the relevant stylistic axes, or include an ablation using original solutions for at least one model family.
minor comments (5)
- [§5] Typo: 'but but' appears in the paragraph on GSM8K. Also, 'weak cross-domain generalization' should be 'weak cross-difficulty generalization'.
- [Appendix D] The text says 'eight publicly available datasets' but only six are used in the main experiments; IFEval and GPQA-Extended are reported only in the appendix. Please clarify the status of these two datasets in the main text.
- [Figure 3] The left panel shows raw SFT accuracy while the right panel shows improvement over zero-shot; the diagonal is masked. Please state explicitly in the caption that same-bin train/test cells are excluded and that the main analysis uses only off-diagonal cells.
- [Table 1] The green/red/blue highlighting is not visible in grayscale or for color-blind readers; consider adding symbols or text labels to convey the categories.
- [Appendix C] The claim that 3PL/4PL models produce 'counterintuitive estimates' is interesting but not quantified. A small figure or table showing how bin assignments change across IRT models would strengthen the choice of 1PL.
Circularity Check
No significant circularity: IRT bins are external inputs, and the cross-difficulty claim is an empirical measurement not fitted to them.
full rationale
The paper's chain is: collect Open LLM Leaderboard responses → fit a Rasch/1PL IRT model to estimate example difficulty (Section 3.1–3.2) → split into ten bins → fine-tune models on one bin and evaluate on all bins relative to the zero-shot baseline (Sections 4–5). The only nearby concern is that the difficulty estimates are computed from huge leaderboard response matrices that include the same model families later fine-tuned, and that the validation in Section 3.3 uses only held-out Qwen3 zero-shot models. However, the central quantitative claim—limited cross-difficulty generalization and a diagonal-concentrated improvement pattern—is an empirical SFT-minus-zero-shot measurement made after the bins were fixed; no fitted parameter is renamed as a prediction, and no equation in the paper makes the finding follow by construction from the IRT fit. The manuscript's own Limitations section explicitly acknowledges that difficulty scores could shift with model capabilities, which is a validity caveat rather than a circular reduction. There are no load-bearing self-citations (the closest related work, Ding et al. 2024, is independent), and external validation on held-out Qwen3 models provides independent support for the ordering. The analysis is therefore self-contained with respect to circularity, though not immune to external-validity concerns.
Assumptions & free parameters
free parameters (4)
- IRT item difficulty β_i =
Posterior means from 1PL model; individual values not listed
- IRT ability θ_j for each leaderboard model =
Posterior means; not reported individually
- Number of difficulty bins =
10
- Fine-tuning hyperparameters =
lr=5e-6, 5 epochs, batch size 8, seed 42, cosine decay, etc.
assumptions (5)
- domain assumption 1PL Rasch model adequately represents per-example difficulty and model ability
- domain assumption Scraped leaderboard data are accurate per-example responses
- domain assumption IRT difficulty ordering transfers to the fine-tuned Qwen/Llama models
- domain assumption Single-bin SFT for five epochs is a meaningful probe of cross-difficulty generalization
- domain assumption lm-eval-harness accuracy is a valid performance measure
Cite this review
Pith. "Pith review of Revisiting Generalization Across Difficulty Levels: It's Not So Easy." pith.science (2026). https://pith.science/paper/SCY4MDQZ
@misc{pith2026251121692,
  author       = {Pith},
  title        = {Pith review of: Revisiting Generalization Across Difficulty Levels: It's Not So Easy},
  year         = {2026},
  howpublished = {\url{https://pith.science/paper/SCY4MDQZ}},
  note         = {Machine review of arXiv:2511.21692}
}
read the original abstract
We investigate how well large language models (LLMs) generalize across different task difficulties, a key question for effective data curation and evaluation. Existing research is mixed regarding whether training on easier or harder data leads to better results, and whether those gains come on easier or harder test data. We address this question by conducting a systematic evaluation of LLMs' generalization across models, datasets, and fine-grained groups of example difficulty. We rank examples in six datasets using the outputs of thousands of different LLMs and Item Response Theory (IRT), a well-established difficulty metric in educational testing. Unlike prior work, our difficulty ratings are therefore determined solely by the abilities of many different LLMs, excluding human opinions of difficulty. With a more objective, larger-scale, and finer-grained analysis, we show that cross-difficulty generalization is often limited; training on either easy or hard data cannot achieve consistent improvements across the full range of difficulties. These results show the importance of having a range of difficulties in both training and evaluation data for LLMs, and that taking shortcuts with respect to difficulty is risky.
Figures


Figures from the paper (16 more)




Reviewed August 4, 2026 · model on record in the stance chip above.
Discussion (0). Continue with ORCID to comment.