A graph generation pipeline for critical infrastructures based on heuristics, images and depth data
Pith reviewed 2026-05-17 00:23 UTC · model grok-4.3
The pith
A pipeline using stereo camera images, depth data, and user-defined heuristics generates graphs close to ground truth for critical infrastructures.
A machine-rendered reading of the paper's core claim, the machinery that carries it, and where it could break.
Core claim
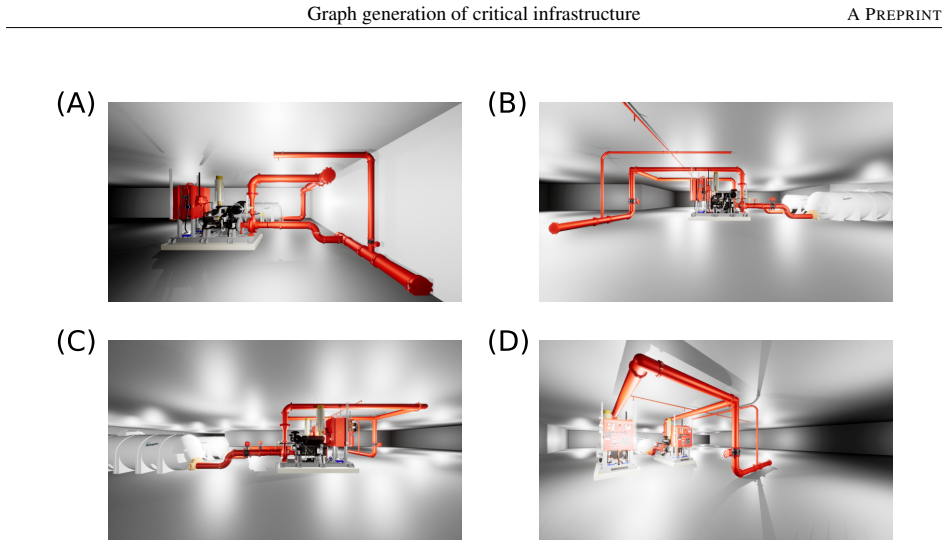
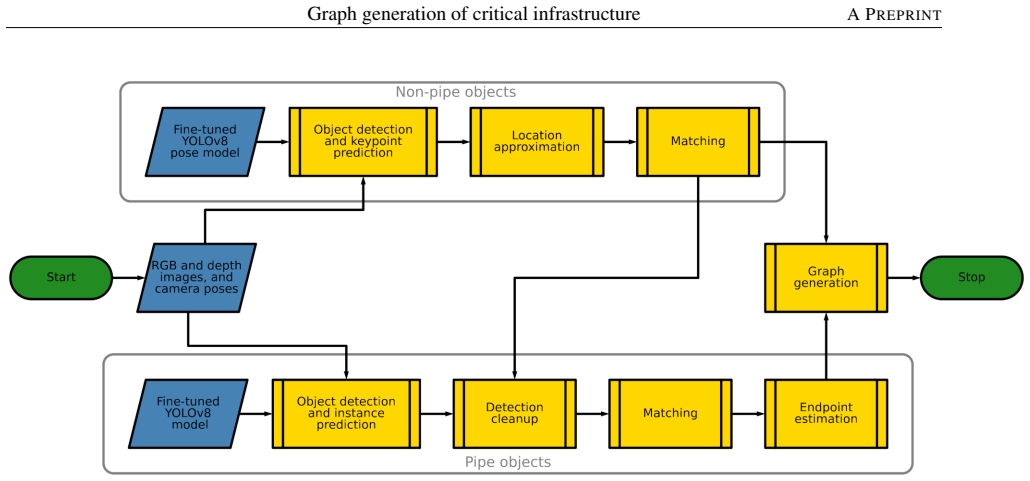
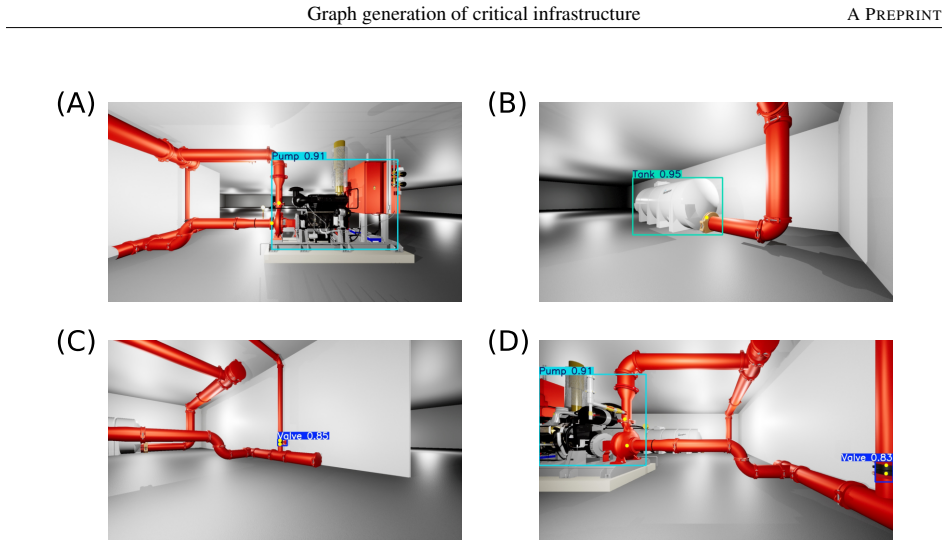
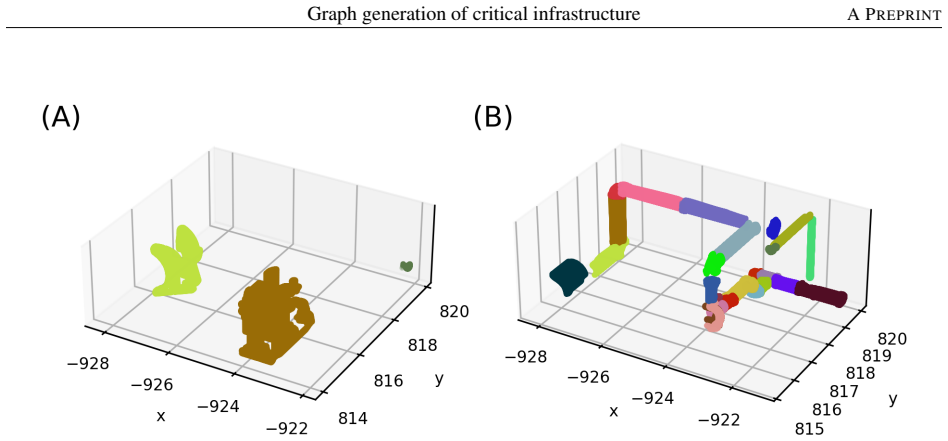
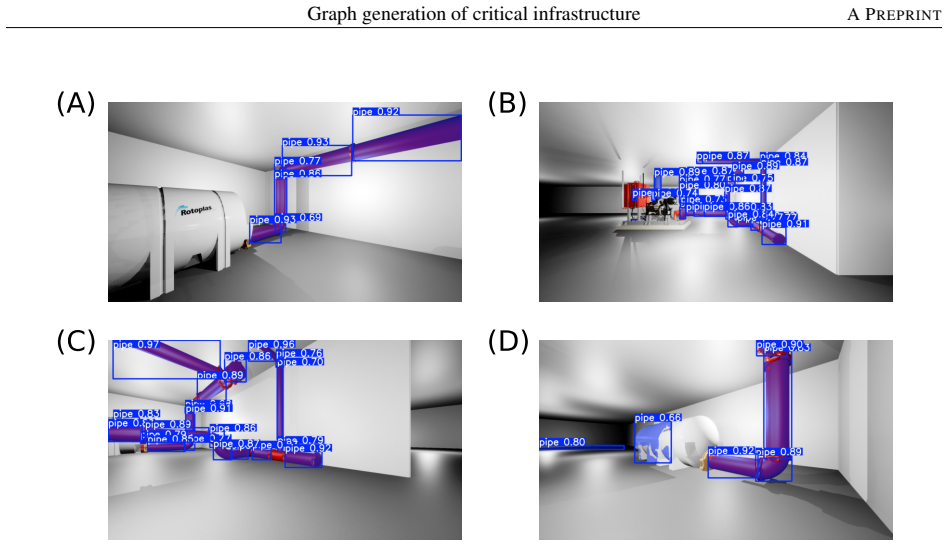
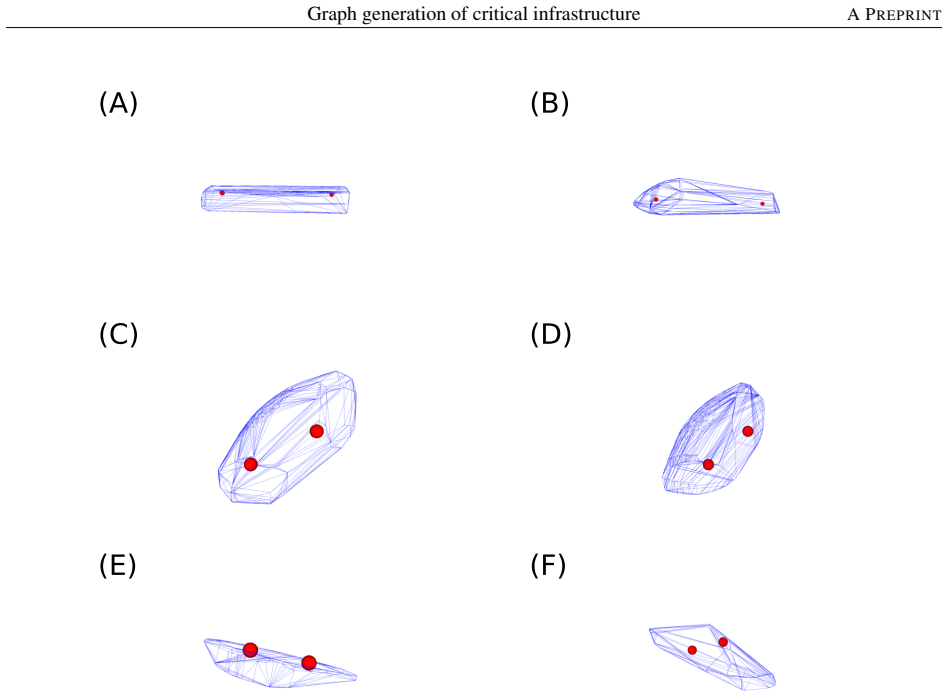
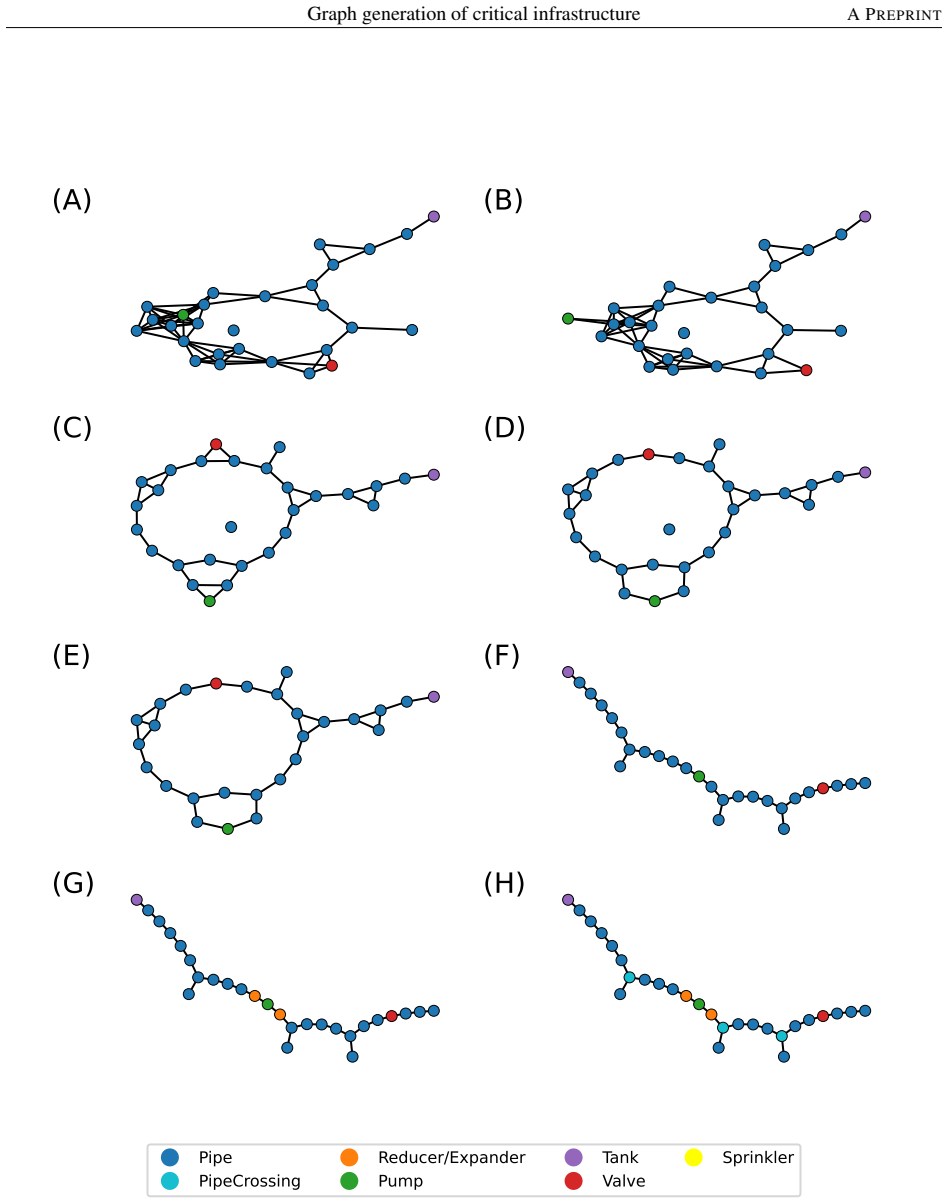
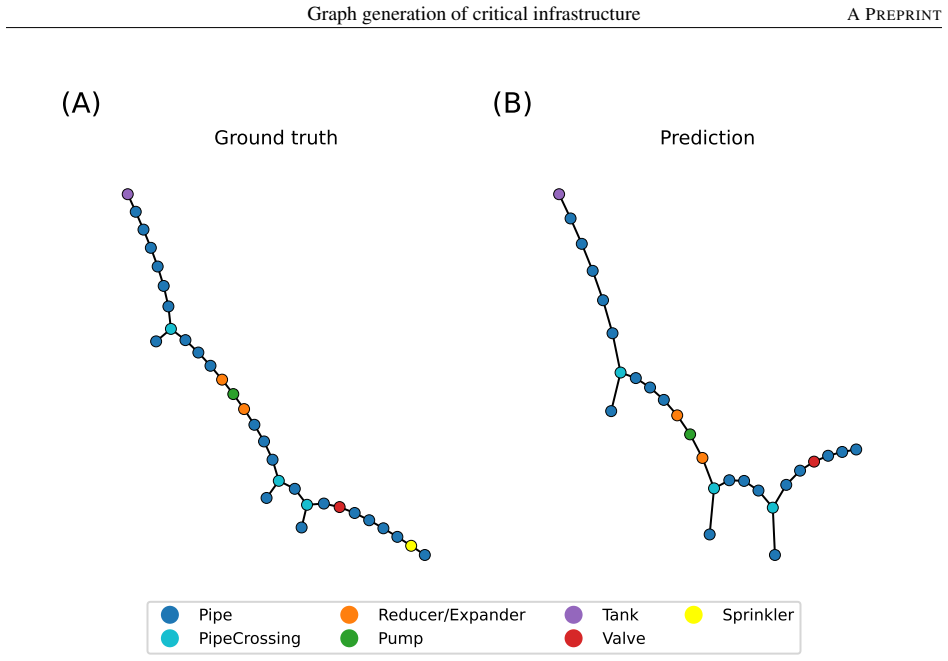
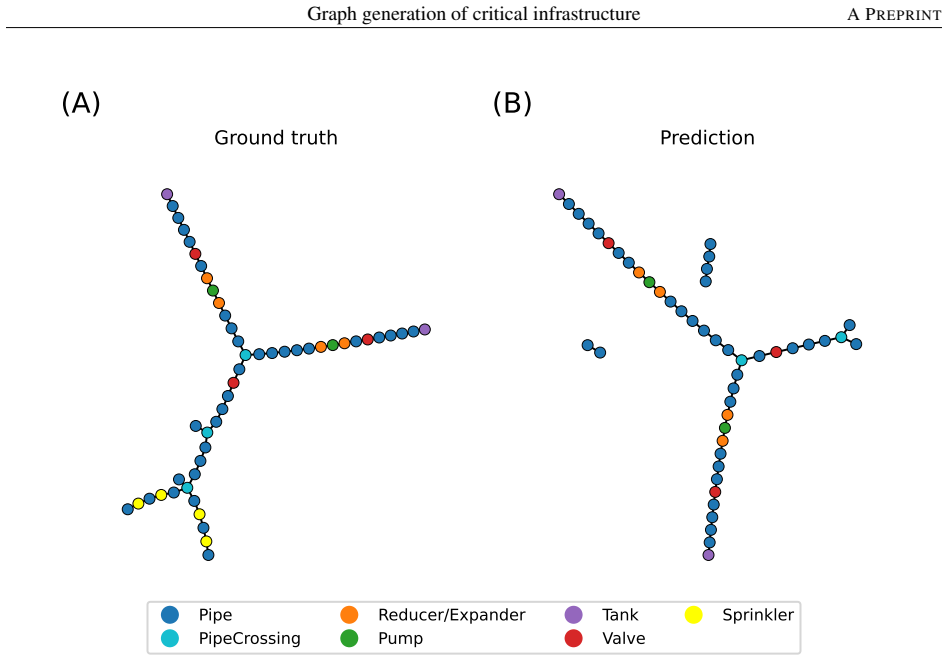
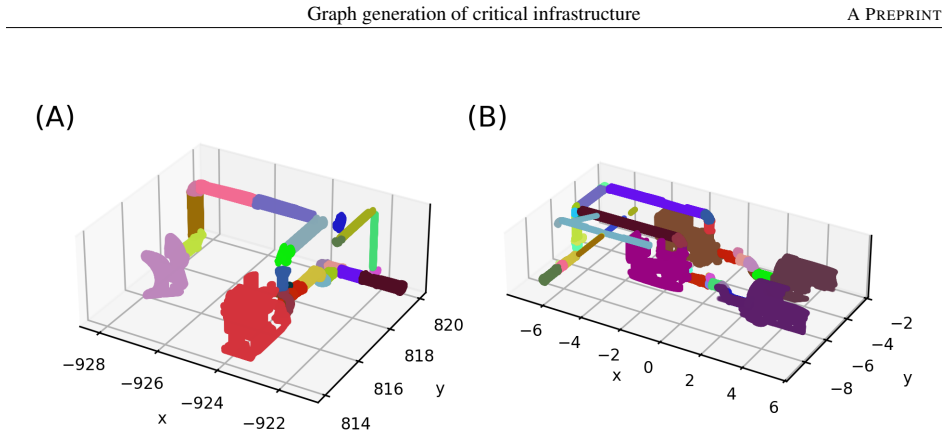
The pipeline detects relevant objects using deep learning on RGB and depth data from a stereo camera and infers their relations via user-defined heuristics, resulting in graphs that closely approximate the ground truth for two tested hydraulic systems.
What carries the argument
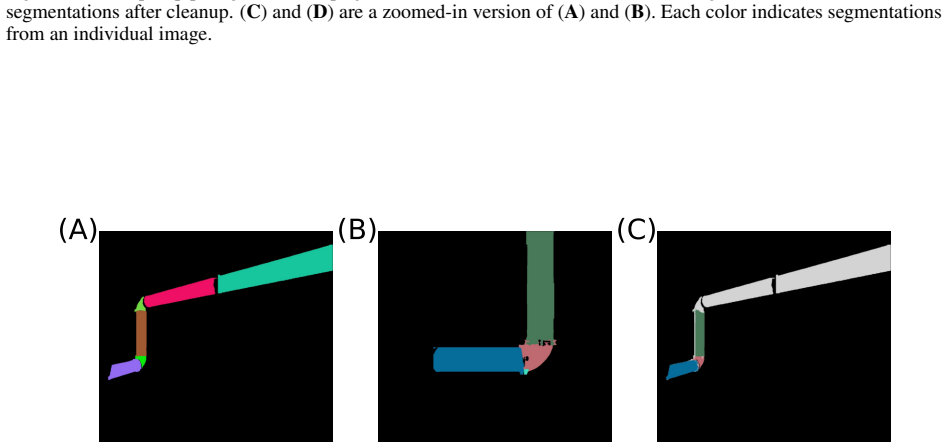
The combination of deep learning-based object detection and instance segmentation with user-defined heuristics for inferring relations between objects from image and depth data.
If this is right
- Virtual representations of infrastructures can be created more affordably for simulations and digital twins.
- The explicit rules provide transparency that qualifies the graphs for use in high-stakes critical infrastructure decisions.
- The general process can be tailored to other types of infrastructures beyond hydraulic systems.
- Specialist knowledge and equipment for laser scanning are not required.
Where Pith is reading between the lines
- Smaller facilities without access to laser scanners could more readily build simulation models for resilience planning.
- The method might support extension to dynamic updates if paired with continuous camera feeds.
- Similar heuristic-driven pipelines could apply to graph construction in adjacent domains like facility management or network topology.
Load-bearing premise
User-defined heuristics can accurately and reliably infer relations between detected objects across varied real-world conditions without extensive additional validation.
What would settle it
Applying the pipeline to images from a third hydraulic system or different infrastructure type and obtaining graphs with low similarity to independently verified ground truth structures.
Figures
read the original abstract
Virtual representations of physical critical infrastructures, such as water or energy plants, are used for simulations and digital twins to ensure resilience and continuity of their services. These models usually require 3D point clouds from laser scanners that are expensive to acquire and require specialist knowledge to use. In this article, we present a prototypical graph generation pipeline based on photogrammetry. The pipeline detects relevant objects and predicts their relation using RGB images and depth data generated by a stereo camera. This more cost-effective approach uses deep learning for object detection and instance segmentation of the objects, and employs user-defined heuristics or rules to infer their relations. Results of two hydraulic systems show that this strategy can produce graphs close to the ground truth. While this study focuses on hydraulic systems, the general process can be used to tailor the method to other types of infrastructures and applications. The user-defined rules create transparency qualifying the pipeline to be used in the high stakes decision-making that is required for critical infrastructures.
Editorial analysis
A structured set of objections, weighed in public.
Referee Report
Summary. The manuscript presents a prototypical pipeline for generating graph-based virtual representations of critical infrastructures (e.g., hydraulic systems) from RGB images and depth data captured by a stereo camera. Deep learning performs object detection and instance segmentation, while user-defined heuristics infer object relations to construct the final graph. The authors report that the approach yields graphs close to ground truth on two hydraulic systems and argue that the transparent, rule-based design makes it suitable for high-stakes critical-infrastructure applications as a lower-cost alternative to laser scanning.
Significance. If the central claim were supported by quantitative evidence, the work would offer a practical, interpretable method for creating digital twins of critical systems without specialized 3D scanning equipment. The explicit use of user-defined rules is a positive feature for auditability in regulated domains. However, the absence of any numerical evaluation metrics or validation procedures substantially reduces the current significance and prevents assessment of whether the pipeline generalizes beyond the two reported examples.
major comments (3)
- [Abstract] Abstract: The assertion that 'Results of two hydraulic systems show that this strategy can produce graphs close to the ground truth' is unsupported by any quantitative graph-level metrics (e.g., edge precision/recall, graph-edit distance, or structural similarity scores), error analysis, or dataset statistics, rendering the central empirical claim impossible to evaluate.
- [Results] Results / Evaluation section: With success reported on exactly two systems and no ablation studies, cross-condition tests, or comparison against alternative relation-inference methods, it is unclear whether the observed closeness to ground truth stems from the pipeline itself or from manual tuning of the system-specific heuristics.
- [Methods] Methods: The user-defined heuristics for relation inference are presented as a core component, yet no formal description, pseudocode, or sensitivity analysis is supplied; this makes reproducibility and extension to other infrastructure types difficult to assess.
minor comments (2)
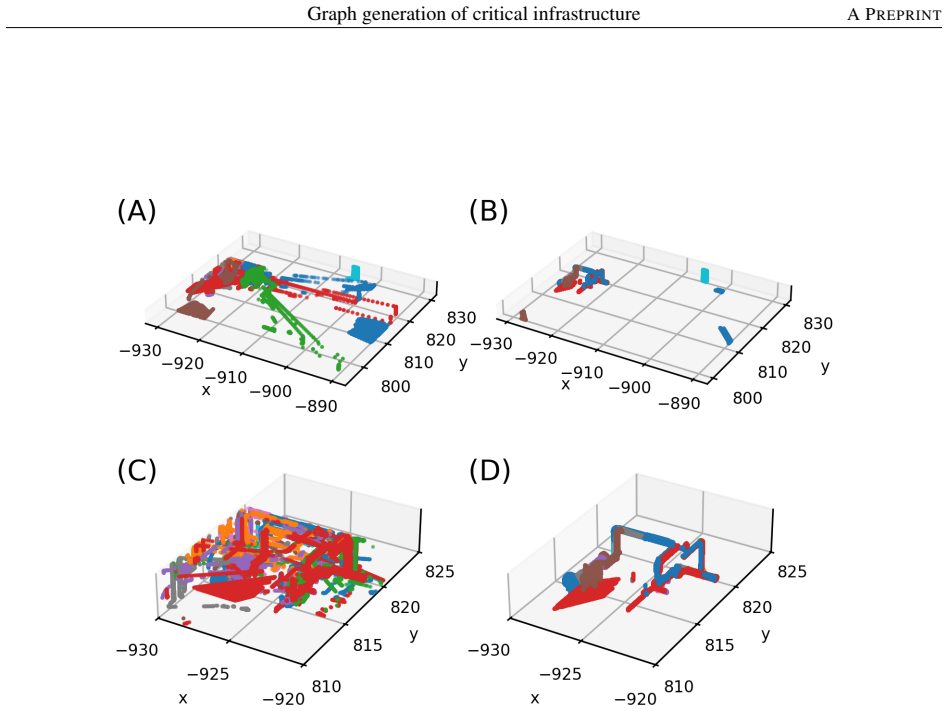
- Clarify how depth data from the stereo camera is integrated with the photogrammetry pipeline and whether any 3D reconstruction step occurs before graph construction.
- [Abstract] The abstract states the method 'can be used to tailor the method to other types of infrastructures'; provide at least one concrete example or discussion of the required changes to the heuristic set.
Simulated Author's Rebuttal
We thank the referee for their detailed review and constructive comments. We address each major comment below and indicate the revisions we will make to strengthen the manuscript.
read point-by-point responses
-
Referee: [Abstract] Abstract: The assertion that 'Results of two hydraulic systems show that this strategy can produce graphs close to the ground truth' is unsupported by any quantitative graph-level metrics (e.g., edge precision/recall, graph-edit distance, or structural similarity scores), error analysis, or dataset statistics, rendering the central empirical claim impossible to evaluate.
Authors: We agree that the claim in the abstract would benefit from quantitative support. In the revised manuscript, we will include specific graph-level metrics such as edge precision, recall, and graph-edit distance for the two hydraulic systems, as well as dataset statistics and a brief error analysis. revision: yes
-
Referee: [Results] Results / Evaluation section: With success reported on exactly two systems and no ablation studies, cross-condition tests, or comparison against alternative relation-inference methods, it is unclear whether the observed closeness to ground truth stems from the pipeline itself or from manual tuning of the system-specific heuristics.
Authors: This work is a prototypical demonstration on two systems. We acknowledge the limited evaluation scope. In the revision, we will add a discussion clarifying the heuristic development process based on domain expertise and include a sensitivity analysis to address concerns about manual tuning. revision: partial
-
Referee: [Methods] Methods: The user-defined heuristics for relation inference are presented as a core component, yet no formal description, pseudocode, or sensitivity analysis is supplied; this makes reproducibility and extension to other infrastructure types difficult to assess.
Authors: We agree on the need for a formal description to aid reproducibility. The revised manuscript will include pseudocode for the relation inference heuristics and a sensitivity analysis on the key parameters. revision: yes
Circularity Check
No circularity: pipeline relies on external DL models and explicit user heuristics with no derivations or self-referential predictions
full rationale
The paper describes an applied pipeline for graph generation from RGB/depth images: deep learning handles object detection and instance segmentation, while user-defined heuristics infer relations between objects. No equations, fitted parameters, predictions, or derivation steps are presented that could reduce to inputs by construction. Results on two hydraulic systems are empirical demonstrations of the pipeline output, not derived claims that loop back to the same data or rules. No self-citations are invoked as load-bearing uniqueness theorems or ansatzes. This matches the default expectation of no circularity for a methods paper without mathematical modeling.
Axiom & Free-Parameter Ledger
Reference graph
Works this paper leans on
-
[1]
Qiuchen Lu, Xiang Xie, Ajith Kumar Parlikad, Jennifer Mary Schooling, and Eirini Konstantinou
doi:10.1007/978-3-319-92862-3_1. Qiuchen Lu, Xiang Xie, Ajith Kumar Parlikad, Jennifer Mary Schooling, and Eirini Konstantinou. Moving from building information models to digital twins for operation and maintenance.Proceedings of the Institution of Civil Engineers-Smart Infrastructure and Construction, 174(2):46–56, 2022. doi:10.1680/jsmic.19.00011. Andrz...
-
[2]
doi:10.7315/JCDE.2014.002. Lili Cheng, Zhuo Wei, Mingchao Sun, Shiqing Xin, Andrei Sharf, Yangyan Li, Baoquan Chen, and Changhe Tu. DeepPipes: Learning 3D pipelines reconstruction from point clouds.Graphical Models, 111:101079, 2020. doi:10.1016/j.gmod.2020.101079. Antje Alex and Jannis Stoppe. Pipe reconstruction from point cloud data. InProceedings of t...
-
[3]
Feiyu Xu, Hans Uszkoreit, Yangzhou Du, Wei Fan, Dongyan Zhao, and Jun Zhu
doi:10.1007/s00521-024-10437-2. Feiyu Xu, Hans Uszkoreit, Yangzhou Du, Wei Fan, Dongyan Zhao, and Jun Zhu. Explainable AI: A brief survey on history, research areas, approaches and challenges. InProceedings of the CFF International Conference on Natural 17 Graph generation of critical infrastructureA PREPRINT Language Processing and Chinese Computing (NLP...
discussion (0)
Sign in with ORCID, Apple, or X to comment. Anyone can read and Pith papers without signing in.