REVIEW 4 major objections 6 minor 27 references
GeoLoom establishes that natural-language geometry descriptions can be converted into constraint-satisfying diagrams via a formal intermediate language (GeoLingua) and a Monte Carlo coordinate solver, with human-judged correctness around 81
Reviewed by Pith at T0; open to challenge. T0 means a machine referee read the full paper against a public rubric. the ladder, T0–T4 →
T0 review · deepseek-v4-flash
2026-08-03 17:44 UTC pith:R3XB57NQ
load-bearing objection Useful new formal-language + solver pipeline for geometry diagrams, but the headline comparative claim is under-supported: MagicGeo is missing and the main metric partly measures its own optimizer. the 4 major comments →
GeoLoom: High-quality Geometric Diagram Generation from Textual Input
The pith
A machine-rendered reading of the paper's core claim, the machinery that carries it, and where it could break.
Core claim
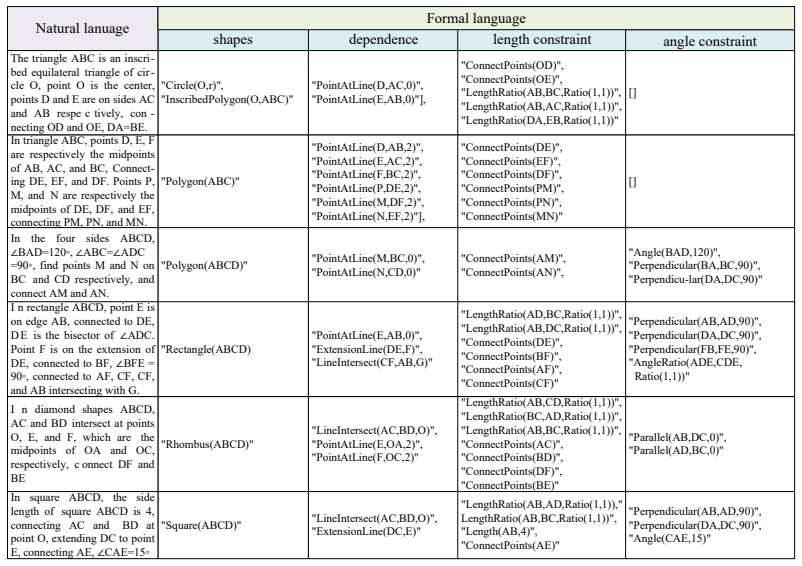
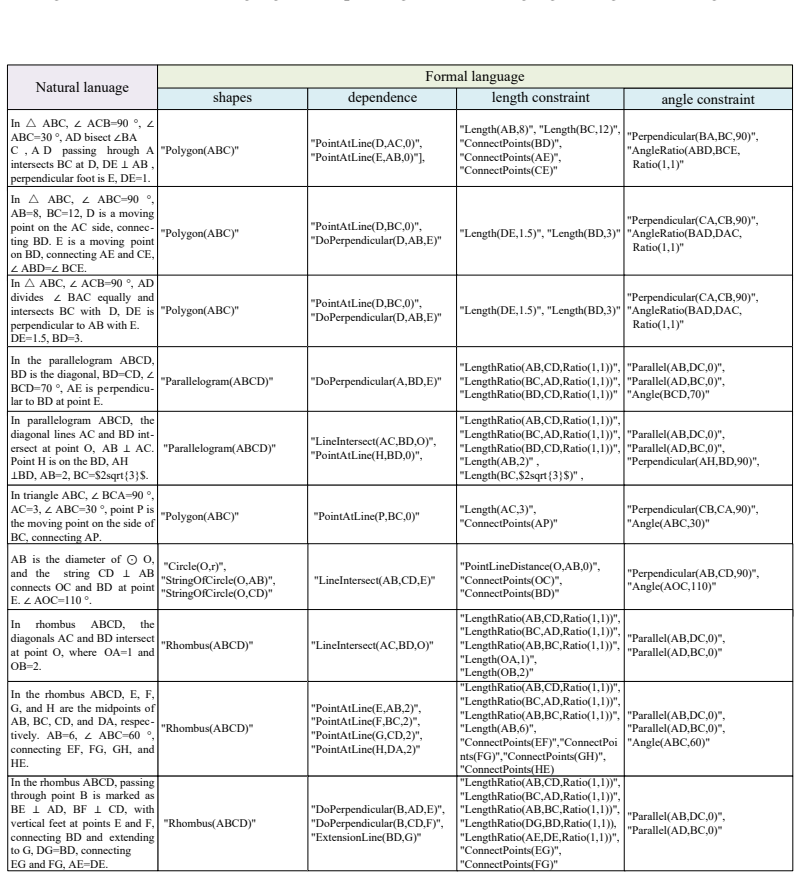
GeoLoom is a two-stage pipeline: an autoformalization module converts natural language into GeoLingua, a generation-oriented formal language whose four blocks (shapes, dependence, length constraints, angle constraints) explicitly separate free points Pf, dependent points Pd = Φ(Pf, C), and the constraint set C; and a coordinate solver optimizes Pf by Monte Carlo random perturbation with Newton-like refinement, using the loss L(S) = max over constraints of |1 − Ck|, until the maximum deviation falls below 0.05 (with inner/outer loop limits Q = T = 1000). The paper reports human-judged correctness of about 81–85% for the best configurations, with most diagrams generated in under 10 seconds, sh
What carries the argument
The load-bearing objects are GeoLingua and the coordinate solver. GeoLingua encodes a diagram as shapes, a dependence section that partitions points into free Pf and dependent Pd, and two constraint families (length and angle), each with value, ratio, and relation subtypes. The solver treats geometry as a constraint-satisfaction problem over Pf: it samples perturbed coordinates, evaluates the five constraint-score families normalized to [0,1], and keeps moves that reduce the worst violation L(S) = max|1 − Ck|; dependent points are recomputed each time by the symbolic update Φ(Pf, C). This combination is what turns a text-derived specification into a coordinate-accurate rendering.
Load-bearing premise
The pipeline assumes that every valid GeoLingua description can be decomposed into free points and a deterministic update function Φ(Pf, C) that places all dependent points, and that Monte Carlo perturbation plus Newton descent will find the global optimum; the paper's own failure analysis shows this fails in roughly 8% of cases (local minima), with an additional 3% topological and 3% overlap failures.
What would settle it
Run the coordinate solver many times (e.g., 100 seeds) on a set of well-formed GeoLingua descriptions that mix length and angle constraints, and measure the fraction of runs that never reach L(S) ≤ 0.05. If that fraction is far above the reported 8% for heavily constrained inputs, or if some valid descriptions never converge under any seed, the claim of reliable structural fidelity breaks. An independent human study on a random sample of 200 diagrams, comparing correctness rates against the LCI/ADI scores, would also settle whether the metric tracks human judgment.
If this is right
- Textbook and exam diagrams can be produced on demand from problem statements, without manual drawing or hand-written diagram code.
- The constraint-deviation score (LCI and ADI) gives an objective, automatic check of a diagram's structural fidelity, usable both as evaluation and as supervision for iterative refinement.
- Because the formal language is inspectable, a user can audit which constraints the diagram is meant to satisfy and where the generation went wrong.
- The explicit free/dependent point structure means the same formal description can be re-rendered with different coordinates, yielding multiple valid diagrams for one problem.
- Generation time under 10 seconds for the majority of cases makes the pipeline practical for interactive educational tools.
Where Pith is reading between the lines
- The formal intermediate representation could be reused as training data or data augmentation for geometry-reasoning systems: each GeoLingua description can generate many valid diagrams by resampling free points, effectively multiplying the number of grounding examples.
- The 8% local-minimum failure rate suggests a natural improvement path: the solver could be made hybrid by using the dependency order to compute some points analytically (e.g., intersections, midpoints) and reserving Monte Carlo for genuinely free parameters, shrinking the search space.
- The constraint-deviation loss could serve as a reward signal for reinforcement-learning fine-tuning of the autoformalizer, penalizing formalizations that lead to unsatisfiable or degenerate coordinate systems.
- A stress test on heavily constrained inputs (many angle and ratio constraints plus concyclicity) would reveal whether the 8% local-minimum rate is constant or grows with constraint density, determining how far the approach scales toward IMO-style problems.
Editorial analysis
A structured set of objections, weighed in public.
Referee Report
Summary. The paper introduces GeoLoom, a two-stage framework for generating geometric diagrams from natural language text. The first stage autoformalizes text into GeoLingua, a purpose-built formal language that separates shapes, free/dependent points, and length/angle constraints. The second stage uses a Monte Carlo coordinate solver that perturbs free-point coordinates and propagates dependent points through a constraint function Φ, minimizing a max-deviation loss (Eq. 7) over five families of constraint scores. The authors also introduce the GeoNF dataset of 4,730 aligned natural-language/formal-language pairs and propose two quantitative metrics, LCI and ADI, computed from the same constraint scores. Experiments report high human-judged accuracy (75–85%), efficiency (most diagrams under 10 s), and a qualitative comparison with AutomaTikZ and Seedream. The central claim is that GeoLoom significantly outperforms state-of-the-art baselines in structural fidelity.
Significance. If the claims are substantiated, GeoLoom would be a valuable contribution: it provides a generation-oriented formal language for geometry, a dataset of aligned descriptions, and a solver that produces structurally constrained diagrams without per-instance human specification. The idea of using an explicit formal intermediate representation and a constraint-satisfaction coordinate solver is principled and interpretable, and the paper honestly discusses failure modes such as local minima and topological errors. The efficiency results are also promising for educational deployment. However, the paper's current evidence does not yet establish the headline comparative claim because the quantitative metrics are partly circular with the optimization objective and because the most relevant training-free baseline, MagicGeo, is not evaluated.
major comments (4)
- [§4.1, Eqs. (8)–(9) and Eq. (7)] The LCI and ADI metrics are computed from the same constraint scores C_k that the coordinate solver explicitly minimizes (loss = max |1−C_k|). Thus the quantitative evaluation largely measures how well GeoLoom's own solver satisfied its own objective, rather than providing an independent measurement of geometric fidelity. To support the claim of structural superiority, the paper should include a hold-out evaluation: for example, recompute constraint compliance from the rendered diagram using an independent checker, or report human ratings of specific geometric properties. At minimum, baseline methods must be scored with the same metric protocol to make the comparison meaningful.
- [§3.2, Eqs. (1)–(5)] The paper states that the five constraint scores C_k are 'normalized to the interval [0,1]', but the definitions as written do not guarantee this. For LengthRatio, C = R_gen/R_tar can be arbitrarily large; similarly, LengthRelation, AngleValue, and AngleRatio can exceed 1, and LCI/ADI can be negative or unbounded. Table 1 reports LCI values such as 1.326 and 1.996, which are inconsistent with a [0,1] normalization. The metric definitions should be corrected (e.g., use min(r, 1/r) or a clipped log-ratio) or the claims about normalization should be removed and the metrics reinterpreted as raw deviation scores.
- [Abstract, §4.1, and Table 1] The central claim is that GeoLoom 'significantly outperforms state-of-the-art baselines in structural fidelity', but Table 1 contains only GeoLoom variants (various LLMs with fine-tuning or training-free). No quantitative comparison with any baseline is provided. The Related Work section (§5) cites MagicGeo (Wang et al., 2025) as a training-free text-guided geometric diagram generation method, which is arguably the closest competitor for the claimed regime; it is never evaluated. The user study (Table 2) compares only AutomaTikZ and Seedream, with zero votes for AutomaTikZ and no error bars, significance tests, or inter-annotator agreement. A benchmark including MagicGeo and at least one quantitative baseline comparison is required to support the headline claim.
- [Table 1, 'True' column] The 'True' accuracy values (75–85%) are described as the result of manual examination, but no protocol is given: how many annotators, what instructions defined 'correct', how disagreements were resolved, and whether any inter-annotator agreement was measured. Without this information, the human-evaluation result is difficult to interpret, especially when the gap between the best and worst model is small (e.g., 85.34 vs. 75.58). Please provide a detailed annotation protocol or report agreement statistics.
minor comments (6)
- [Throughout] Inconsistent naming: the baseline is referred to as both 'Seedream' and 'SeeDream'; the model is 'Qwen2.5-7b' and 'Qwen2.5-7B'; 'AutomaTikZ' is misspelled as 'AutomaTiKZ' in the appendix.
- [§4.1] The text says 'we quantified the error values' but LCI/ADI are not errors; they are deviation indices that can be negative. The wording should be aligned with the corrected metric definitions.
- [Algorithm 1 (Appendix C.1)] The pseudocode has an apparent inconsistency: lines 16–20 compare L(S_t) with L(S_best) after S_local has already been used, but the global best is updated only if the new loss is lower. This is logically fine but confusing; consider renaming L_best to distinguish inner-loop local best from global best.
- [Figure 1 (Introduction)] The figure contains an unexpanded field 'text_logic_form' and 'diagram_logic_form' that are not defined elsewhere; the relationship to GeoLingua's four components should be clarified.
- [Table 3 and Appendix D.3] Efficiency is reported as percentages of diagrams in time bins, but the 'Average' rows in Table 3 are labeled ambiguously ('Average (Training-free (test set))' etc.). Clarify whether these are averages over runs or over test instances.
- [Appendix E.1] The failure analysis is useful, but the statement 'Overlapping problem ... Although such cases still satisfy the quantitative evaluation metrics' is a red flag for the proposed metrics; it reinforces the need for an independent metric that penalizes visual overlap.
Circularity Check
LCI/ADI are defined from the same constraint scores the solver minimizes, so the headline quantitative 'structural fidelity' numbers report self-consistency rather than independent measurement.
specific steps
-
fitted input called prediction
[Section 3.2, Eq. (7); Section 4.1, Eqs. (8)-(9); Table 1]
"The optimization objective is to maximize the overall satisfaction of all constraints. Given the set of constraint scores C={C_k}, we define the loss as L(S) = max_{C_k∈C} |1−C_k| (7) ... We leverage our geometric constraint deviation score and group them into two metrics that can be used as quantitative indicators ... LCI= 1− 1/N_line(Σ C_lin_rat+Σ C_lin_rel) (8) ... ADI= 1− 1/N_angle(Σ C_ang_val+Σ C_ang_rat+Σ C_ang_rel) (9)"
LCI and ADI are defined as 1 minus the mean of the very same C_k scores that the coordinate solver is explicitly minimizing in Eq. (7). A successful solve therefore forces LCI/ADI toward their optima by construction, so the Table 1 'structural fidelity' results largely report how well the optimizer satisfied its own objective. The human 'True' accuracy and the user study are independent checks, which prevents total circularity, but the quantitative claim of 'significantly outperforms state-of-the-art baselines in structural fidelity' is not independently evidenced because Table 1 contains no baseline LCI/ADI rows.
full rationale
The central circular step is the identity between the optimization objective and the headline evaluation metrics. Equations (8) and (9) are deterministic functions of the same C_k scores that equation (7) minimizes, so Table 1's LCI/ADI values are a self-consistency measure of the Monte Carlo solver rather than an external fidelity benchmark. This reduces the quantitative part of the 'structural fidelity' claim to 'the solver minimized its own loss.' The paper does include independent human evaluation—'True' accuracy in Table 1 and the user study in Table 2—which supports the central claim without relying on the circular metric, so the paper is only partially circular. I found no load-bearing self-citation: the cited DiagramAgent (Wei et al., 2025) and MagicGeo (Wang et al., 2025) are different author groups from the present paper, and no uniqueness or ansatz result is imported from the authors' own prior work. The missing MagicGeo comparison and the absence of baseline LCI/ADI rows are evidence-completeness problems, not circularity. The paper's own failure analysis (8% local minima, 3% topological, 3% overlap) is honest and does not itself create circularity. Overall, the score reflects one central metric/objective overlap that makes the quantitative superiority claim partially self-referential, while the independent human checks keep the paper from being wholly circular.
Axiom & Free-Parameter Ledger
free parameters (5)
- Convergence threshold α =
0.05
- Inner-loop iterations Q =
1000
- Outer-loop iterations T =
1000
- Monte Carlo perturbation proposal/step size
- Validation-filter retry limit =
3
axioms (4)
- domain assumption Every GeoLingua expression can be executed by a deterministic constructor function Φ(P_f, C_k) that computes all dependent point coordinates from free points and constraints.
- ad hoc to paper The constraint scores C_k are normalized to [0,1] and are a faithful measure of geometric fidelity.
- domain assumption Natural-language geometry statements can be autoformalized into GeoLingua with sufficient semantic fidelity.
- domain assumption Monte Carlo random optimization with Q=T=1000 and Newton descent escapes local minima often enough for correctness.
read the original abstract
High-quality geometric diagram generation presents both a challenge and an opportunity: it demands strict spatial accuracy while offering well-defined constraints to guide generation. Inspired by recent advances in geometry problem solving that employ formal languages and symbolic solvers for enhanced correctness and interpretability, we propose GeoLoom, a novel framework for text-to-diagram generation in geometric domains. GeoLoom comprises two core components: an autoformalization module that translates natural language into a specifically designed generation-oriented formal language GeoLingua, and a coordinate solver that maps formal constraints to precise coordinates using the efficient Monte Carlo optimization. To support this framework, we introduce GeoNF, a dataset aligning natural language geometric descriptions with formal GeoLingua descriptions. We further propose a constraint-based evaluation metric that quantifies structural deviation, offering mathematically grounded supervision for iterative refinement. Empirical results demonstrate that GeoLoom significantly outperforms state-of-the-art baselines in structural fidelity, providing a principled foundation for interpretable and scalable diagram generation.
Figures





Reference graph
Works this paper leans on
-
[1]
Jinze Bai, Shuai Bai, Shusheng Yang, Shijie Wang, Sinan Tan, Peng Wang, Jian Lin, Chang Zhou, and Jingren Zhou. Qwen-vl: A frontier large vision-language model with versatile abilities.arXiv preprint arXiv:2308.12966,
-
[4]
Deepsvg: A hierarchical generative network for vector graphics animation
Alexandre Carlier, Martin Danelljan, Alexandre Alahi, and Radu Timofte. Deepsvg: A hierarchical generative network for vector graphics animation. InProceedings of the 34th Conference on Neural Information Processing Systems (NeurIPS 2020),
2020
-
[6]
Geoqa: A geometric question answering benchmark towards multimodal numerical reason- ing.In Findings of the Association for Computational Linguistics: ACL-IJCNLP 2021,
Jiaqi Chen, Jinghui Tang, Jianheng ang Qin, Xiaodan Liang, Eric Liu, Lingbo anf Xing, and Liang Lin. Geoqa: A geometric question answering benchmark towards multimodal numerical reason- ing.In Findings of the Association for Computational Linguistics: ACL-IJCNLP 2021,
2021
-
[10]
Seedream 3.0 technical report.arXiv preprint arXiv:2504.11346,
Yu Gao, Lixue Gong, Qiushan Guo, Xiaoxia Hou, Zhichao Lai, Fanshi Li, Liang Li, Xiaochen Lian, Chao Liao, et al. Seedream 3.0 technical report.arXiv preprint arXiv:2504.11346,
-
[11]
The llama 3 herd of models.arXiv preprint arXiv:2407.21783,
Aaron Grattafiori, Abhimanyu Dubey, Abhinav Jauhri, Abhinav Pandey, Abhishek Kadian, Ahmad Aldahle, Aiesha Letman, Akhil Mathur, Alan Schelten, Alex Vaughan, et al. The llama 3 herd of models.arXiv preprint arXiv:2407.21783,
-
[12]
Yu Jiahui, Xu Yuanzhong, Jing Yukoh, James Pang, Qin Ruoming, Alexander Ku, Xu Yuhui, Ja- son Baldridge, and Wu Yonghui. Scaling autoregressive models for content-rich text-to-image generation.arXiv preprint arXiv:2206.10789,
-
[13]
Scaling up gans for text-to-image synthesis
Minguk Kang, Junyan Zhu, Richard Zhang, Jaesik Park, Eli Shechtman, Sylvain Paris, and Taesung Park. Scaling up gans for text-to-image synthesis. InIEEE/CVF Conference on Computer Vision and Pattern Recognition, CVPR 2023, Vancouver, BC, Canada, June 17-24, 2023, pp. 10124– 10134,
2023
-
[14]
Evaluating text-to-visual generation with image-to-text generation.arXiv preprint arXiv:2404.01291,
Zhiqiu Lin, Deepak Pathak, Baigl Li, Jiayao Li, Xide Xia, Graham Neubig, Pengchuan Zhang, and Deva Ramanan. Evaluating text-to-visual generation with image-to-text generation.arXiv preprint arXiv:2404.01291,
-
[15]
Deepseek-v3 technical report.arXiv preprint arXiv:2412.19437,
Aixin Liu, Bei Feng, Bing Xue, Bingxuan Wang, Bochao Wu, Chengda Lu, Chenggang Zhao, Chengqi Deng, Chenyu Zhang, Chong Ruan, et al. Deepseek-v3 technical report.arXiv preprint arXiv:2412.19437,
-
[17]
Generative language modeling for automated theorem proving
Stanislas Polu and Ilya Sutskever. Generative language modeling for automated theorem proving. arXiv preprint arXiv:2009.03393,
Pith/arXiv arXiv 2009
-
[19]
Hierarchical text- conditional image generation with clip latents.arXiv preprint arXiv:2204.06125,
12 Aditya Ramesh, Prafulla Dhariwal, Alex Nichol, Casey Chu, and Mark Chen. Hierarchical text- conditional image generation with clip latents.arXiv preprint arXiv:2204.06125,
-
[20]
High resolution image synthesis with latent diffusion models
Robin Rombach, Andreas Blattmann, Dominik Lorenz, Patrick Esser, and Bj ¨orn Ommer. High resolution image synthesis with latent diffusion models. InIEEE/CVF Conference on Computer Vision and Pattern Recognition (CVPR 2022), pp. 10674–10685,
2022
-
[21]
Photorealistic text-to- image diffusion models with deep language understanding
Chitwan Saharia, William Chan, Saurabh Saxena, LaLa Li, Jay Whang, et al. Photorealistic text-to- image diffusion models with deep language understanding. InNeurIPS 2022,
2022
-
[22]
Magicgeo: Training-free text- guided geometric diagram generation.arXiv preprint arXiv:2502.13855,
Jie Wang, Tianyu Zhang, Haiyng Yu, Chen Li, Yuxin Yang, et al. Magicgeo: Training-free text- guided geometric diagram generation.arXiv preprint arXiv:2502.13855,
-
[23]
Ronghuan Wu, Wanchao Su, Kede Ma, and Jing Liao. Iconshop: Text-guided vector icon synthesis with autoregressive transformers.arXiv preprint arXiv:2304.14400,
-
[24]
Chat2SVG: Vector graphics generation with large language models and image diffusion models
Ronghuan Wu, Wanchao Su, and Jing Liao. Chat2SVG: Vector graphics generation with large language models and image diffusion models. InProceedings of the IEEE/CVF Conference on Computer Vision and Pattern Recognition (CVPR 2025), pp. 23690–23700,
2025
-
[25]
Xiaodong Xing, Jun Hu, Jie Zhang, Chen Li, Yizhou Wang, et al. SVGFusion: Scalable text-to-svg generation via vector space diffusion.arXiv preprint arXiv:2412.10437,
-
[27]
Text-to-image diffusion models in generative ai: A survey.arXiv preprint arXiv:2303.07909, 2023a
Chenshuang Zhang, Chaoning Zhang, Mengchun Zhang, and Inso Kweon. Text-to-image diffusion models in generative ai: A survey.arXiv preprint arXiv:2303.07909, 2023a. Han Zhang, Tao Xu, and Hongsheng Li. Stackgan: Text to photo-realistic image synthesis with stacked generative adversarial networks. pp. 5908–5916,
-
[1949]
NeuralSVG: An implicit representation for text-to-vector generation.arXiv preprint arXiv:2501.03992,
Sebastian Polaczek, Yuval Alaluf, Elad Richardson, Ariel Shamir, Daniel Cohen-Or, et al. NeuralSVG: An implicit representation for text-to-vector generation.arXiv preprint arXiv:2501.03992,
-
[2001]
Freeman, Michael Rubinstein, Yuanzhen Li, and Dilip Krishnan
Huiwen Chang, Han Zhang, Jarred Barber, Aaron Maschinot, Jos ´e Lezama, Lu Jiang, Ming-Hsuan Yang, Kevin Patrick Murphy, William T. Freeman, Michael Rubinstein, Yuanzhen Li, and Dilip Krishnan. Muse: Text-to-image generation via masked generative transformers. In Andreas Krause, Emma Brunskill, Kyunghyun Cho, Barbara Engelhardt, Sivan Sabato, and Jonathan...
2023
-
[2015]
Abhay Zala, Hanzhuo Lin, Jaemin Cho, Mohit Bansal, Yue Yang, Silvio Savarese, Dan Gutfre- und, Shiyu Zhou, Hongxu Chen, et al. Diagrammergpt: Generating open-domain, open-platform diagrams via llm planning.arXiv preprint arXiv:2310.12128,
-
[2020]
Alec Radford, Jong-Wook Kim, Chris Hallacy, Aditya Ramesh, Gabriel Goh, Sandhini Agar- wal, Girish Sastry, Amanda Askell, Pamela Mishkin, Jack Clark, Gretchen Krueger, and Ilya Sutskever. Learning transferable visual models from natural language supervision.arXiv preprint arXiv:2103.00020,
-
[2021]
Unigeo: Unifying geometry logical reasoning via reformulating mathematical expression.In Proceedings of the 2022 Conference on Empirical Methods in Natural Language Processing, pp
Jiaqi Chen, Tong Li, Jinghui Qin, Pan Lu, Liang Lin, Chongyu Chen, and Xiaodan Liang. Unigeo: Unifying geometry logical reasoning via reformulating mathematical expression.In Proceedings of the 2022 Conference on Empirical Methods in Natural Language Processing, pp. 3313–3323,
2022
-
[2022]
Yuri Chervonyi, Trieu H. Trinh, Miroslav Olˇs´ak, Xiao-Meng Yang, Hoang Nguyen, Marcelo Mene- gali, Junehyuk Jung, Vikas Verma, Quoc V . Le, and Thang Luong. Gold-medalist performance in solving olympiad geometry with alphageometry2.arXiv preprint arXiv:2502.03544,
-
[2023]
Jonas Belouadi, Anne Lauscher, and Steffen Eger. Automattikz: Text-guided synthesis of scientific vector graphics with tikz.arXiv preprint arXiv:2310.00367,
-
[2024]
Mu Cai, Zeyi Huang, Yuheng Li, Haohan Wang, and Yongjae Lee. Leveraging large language mod- els for scalable vector graphics-driven image understanding.arXiv preprint arXiv:2306.06094,
-
[2025]
Cogview: Mastering text-to-image generation via transformers
11 Ming Ding, Zhuoyi Yang, Wenyi Hong, Wendi Zheng, Chang Zhou, Da Yin, Junyang Lin, Xu Zou, Zhou Shao, Hongxia Yang, and Jie Tang. Cogview: Mastering text-to-image generation via transformers. In Marc’Aurelio Ranzato, Alina Beygelzimer, Yann N. Dauphin, Percy Liang, and Jennifer Wortman Vaughan (eds.),Advances in Neural Information Processing Systems 34 ...
2021
discussion (0)
Sign in with ORCID, Apple, or X to comment. Anyone can read and Pith papers without signing in.