REVIEW 3 major objections 5 minor 5 cited by
At z=10, cosmic variance—not Poisson noise—dominates the uncertainty in galaxy number counts, reaching 100–240% per JWST field.
Reviewed by Pith at T0; open to challenge. T0 means a machine referee read the full paper against a public rubric. the ladder, T0–T4 →
T0 review · deepseek-v4-flash
2026-08-03 16:13 UTC pith:XKE7NCME
load-bearing objection First z~10 cosmic variance measurement from 34 sightlines is a genuinely useful new observable, but the model-ranking claim in the abstract rests on a tension statistic that ignores σ_CV. the 3 major comments →
Exploring Cosmic Dawn with PANORAMIC II: Cosmic Variance and Galaxy Clustering at zsim10
The pith
A machine-rendered reading of the paper's core claim, the machinery that carries it, and where it could break.
Core claim
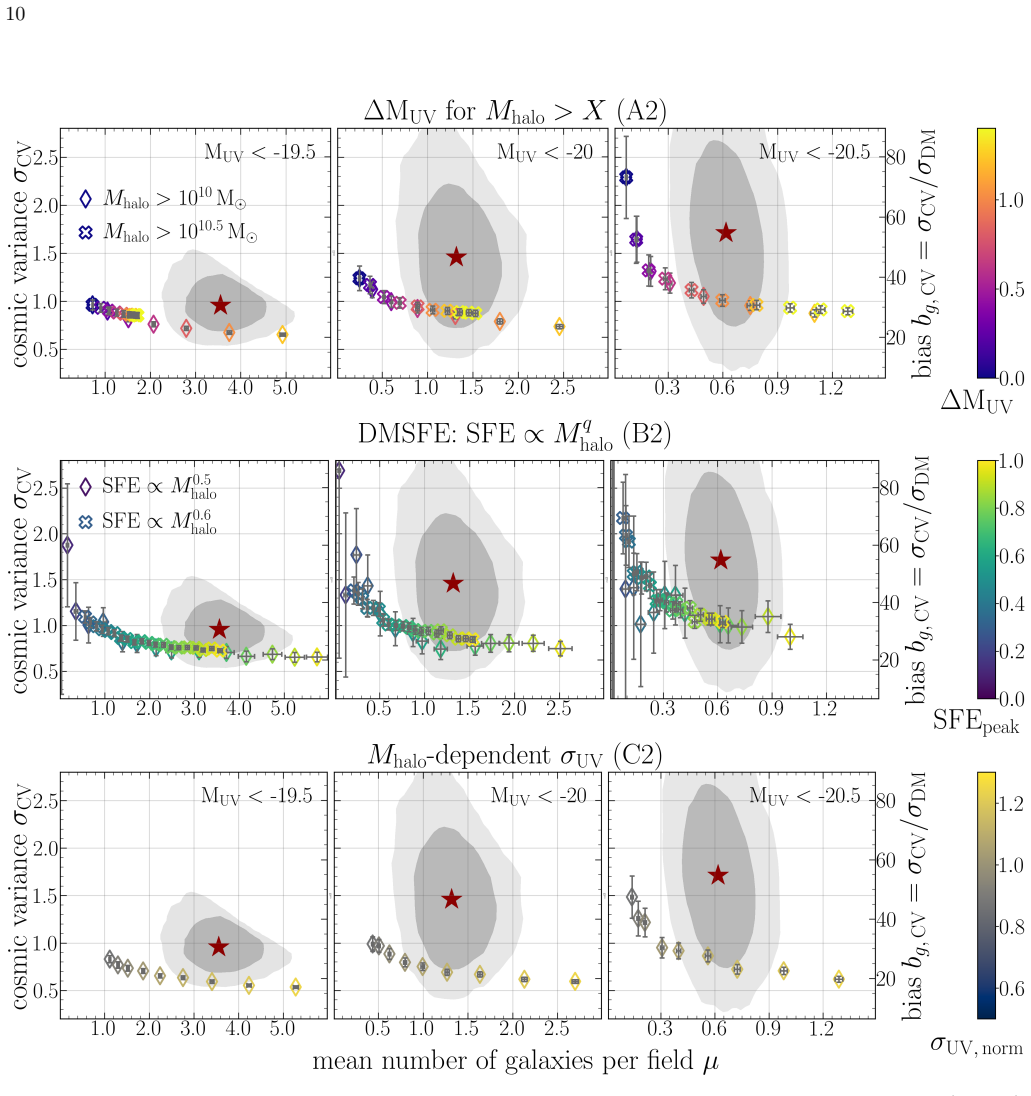
Using 34 independent sightlines, the paper finds z~10 Lyman-break galaxy counts vary with sigma_CV = 0.96, 1.46, and 1.71 per NIRCam pointing (M_UV<-19.5, -20, -20.5) — a 100–240% fractional scatter, implying b_g,CV~30–50. Combining this clustering signal with the UV luminosity function disfavors global star-formation-efficiency boosts and increased UV scatter models, favoring lower mass-to-light ratios or halo-mass-dependent SFE. This makes cosmic variance a new diagnostic that can break degeneracies among models for the overabundance of bright z~10 galaxies.
What carries the argument
Central is sigma_CV, the fractional field-to-field variance in completeness-corrected galaxy counts, sigma_CV^2 = (sigma^2_total - sigma^2_Poisson)/mu^2, where sigma^2_Poisson = <N>. The fiducial measurement fits a Gamma distribution to counts across 34 independent lines of sight via MCMC, which is robust to rare overdense outliers. sigma_CV is converted to a galaxy bias b_g,CV = sigma_CV/sigma_DM, with sigma_DM=0.031 computed for the NIRCam survey volume. Because small non-linear scales dominate such a small field, b_g,CV exceeds the linear bias by 3–5x; the UniverseMachine simulation is used to calibrate this non-linear enhancement and to translate the b_g,CV measurements into linear bias.
Load-bearing premise
The load-bearing premise is that the 34 lines of sight (28 pure-parallel pointings plus randomly placed mock pointings on legacy fields) are independent and statistically equivalent surveys, so that the observed spread in their counts is dominated by true cosmic variance rather than by field selection or residual large-scale correlation.
What would settle it
A revised measurement from a substantially larger set of independent pointings (e.g., ~100) that yields sigma_CV close to the Poisson expectation at M_UV<-20 — or a direct 2PCF measurement showing linear bias around 5 rather than the corrected ~10–14 — would falsify the claim that bright z~10 galaxies are this strongly clustered.
If this is right
- Cosmic variance, not Poisson noise, dominates the uncertainty in single- or few-field JWST counts of bright z~10 galaxies; UVLF estimates from small-area surveys can be off by factors of ~2–4.
- The implied galaxy bias b_g,CV ~30–50 (linear bias ~10–14 after correction) means bright z~10 galaxies are hosted by very massive, strongly clustered halos, a datum any successful model of early galaxy formation must reproduce.
- Models that raise global star-formation efficiency or increase the scatter in the UV–halo mass relation (e.g., bursty star formation) are disfavored relative to models that lower the mass-to-light ratio or make SFE grow with halo mass.
- Adding ~50 independent NIRCam pure-parallel pointings would allow the method to distinguish between the remaining model families at >3 sigma significance.
Where Pith is reading between the lines
- Because the paper itself flags that its measurements may be biased high (a consequence of the skewed count distribution), the true sigma_CV could be lower; if future data confirm lower values, the tentative model ranking could shift back toward bursty/scatter models.
- The same technique can be applied at z~13–17, where the UVLF is even more uncertain; measuring sigma_CV there would test whether the steep drop in galaxy number density from z~10 to z~17 is real or partly a cosmic-variance artifact.
- The non-linear enhancement factor calibrated from the simulation is strong: b_g,CV / b_lin ~3–5 for NIRCam-sized fields. Direct 2PCF measurements in wide JWST fields could calibrate this factor empirically, removing the current reliance on the simulation's small-scale clustering.
- If the high bias is real, targeted spectroscopy of the most overdense sightlines might reveal protocluster-scale overdensities at z~10, linking the variance measurement to large-scale structure formation.
Editorial analysis
A structured set of objections, weighed in public.
Referee Report
Summary. This paper measures the cosmic variance (σ_CV) of z~10 Lyman-break galaxies using 34 independent NIRCam-pointing-sized fields, combining PANORAMIC pure parallels and legacy fields with mock pointings. Two estimators — bootstrap and MCMC Gamma-distribution fitting — give σ_CV ≈ 0.96–1.71 depending on M_UV limit, implying per-field cosmic-variance uncertainties of 100–240% and a large cosmic-variance-based galaxy bias. The authors compare with the fiducial UniverseMachine, which reproduces σ_CV but underproduces the abundance by a factor ≳5. They then implement simple UniverseMachine variants (global/halo-dependent M_UV boosts, constant/power-law SFE, global/halo-dependent scatter) and use the σ_CV–μ plane plus a 'combined model tension' statistic to argue that global SFE and enhanced-scatter models are disfavored relative to a power-law SFE model. Future prospects with additional parallel pointings are discussed.
Significance. If the measurement holds, this is one of the first direct cosmic-variance measurements at z~10, using a novel combination of pure-parallel and legacy sightlines. The consistency between two independent estimators and with UniverseMachine strengthens the empirical result. The model-comparison framework is a useful proof-of-concept for using σ_CV to break degeneracies among UV-bright-galaxy models. However, the quantitative model-ranking claim is weakened by the fact that the 'combined model tension' statistic is computed only from mean counts, not from σ_CV; the abstract's 'combined constraints on σ_CV and the UVLF' therefore overstates what the statistic demonstrates. With a corrected joint statistic or more carefully qualified claims, the paper would be a valuable contribution.
major comments (3)
- [§3.3, Figure 4] The 'combined model tension' m is defined as (μ_model − μ_data)(Σ_model + Σ_data)^−1(μ_model − μ_data)^T, where μ is the mean galaxy count per field in distinct M_UV bins. This statistic contains no term involving σ_CV. Section 5 confirms that the tension is computed 'across distinct M_UV bins (i.e. along the UVLF).' Consequently, the quantitative rankings in Figure 4 — B2 best, C1/C2/B1 disfavored at ≳2σ — are driven solely by abundance/UVLF constraints. The abstract's statement that 'combined constraints on σ_CV and the UVLF' disfavor these models is not supported by this statistic. Either build a joint statistic over (μ, σ_CV) using the full posteriors, or state explicitly that the quantitative ranking is UVLF-only and that σ_CV contributes only qualitative ~1σ support. As written, the headline model-discrimination claim is not demonstrated by the paper's own statistic.
- [§2.4, §3.1.2] The fiducial MCMC σ_CV values use a single random placement of one mock NIRCam pointing in each legacy field. The bootstrapping estimator (§2.4.1) re-samples new mock pointings, but the MCMC estimator (which provides the fiducial values) does not propagate the uncertainty arising from the choice of pointing position within the irregular legacy footprints. Because the legacy fields dominate the area and the mock pointings are treated as independent equal-area sightlines, a different realization of mock pointings could shift the inferred σ_CV. Please quantify this by re-running the MCMC fit over many mock-pointing realizations, and/or by reporting a PANORAMIC-only measurement. This is directly relevant to the claimed precision of the central σ_CV measurement.
- [§4.1–4.2] The conversion from the measured b_g,CV to a linear bias uses the ratio b_g,CV/b_g,lin measured from the fiducial UniverseMachine. The quoted conversion-factor uncertainties reflect only the scatter among UniverseMachine light cones; they do not include the systematic uncertainty in UniverseMachine's small-scale, non-linear clustering or in the assumed M_UV–M_halo relation. Since the conversion is then used to compare with literature linear-bias values, the comparison in §4.2 is model-dependent. I would ask the authors to state this limitation explicitly and, if possible, estimate the systematic error using an alternative clustering model or by varying the halo-occupation assumptions.
minor comments (5)
- [§5] The sentence 'A direct measurement of σ_UV at z∼10...' appears to be a typo; the paper measures σ_CV, not σ_UV.
- [§3.3 and §5] There is an inconsistency in identifying the best-fitting model: §3.3 and Figure 4 refer to the sharp DMSFE model with SFE∝M_halo^0.6 as best, while §5 states the best model has SFE∝M_halo^0.5. Please correct.
- [§3.3] Typo: 'difavored' should be 'disfavored'.
- [§2.4.2] The description of the Negative Binomial likelihood as an 'outlier-resistant Poisson-likelihood' is confusing. The Negative Binomial is the Gamma-Poisson mixture; the robustifying behavior should be explained more precisely.
- [§2.4.2] The exclusion of one of the five UniverseMachine light cones as 'unexplainable and significantly lower typical number densities' deserves more justification. Since the model comparison uses these light cones to estimate σ_CV and μ, a brief discussion of whether this light cone could instead be a rare fluctuation would be useful.
Circularity Check
No significant circularity: the σ_CV measurement is empirical and the model σ_CV tracks are genuine predictions; the §3.3 tension statistic is UVLF-only, a correctness gap rather than a circular reduction.
full rationale
The central σ_CV measurement is not circular: Eq. 4 and the MCMC Gamma-distribution fit operate on observed completeness-corrected counts per field, with no σ_CV input fed into the estimator that is then reported as the measurement. The bootstrap and MCMC agree within uncertainties, and the MCMC prior/likelihood choices are stated and motivated by Jespersen et al. (2025c), a published, reproducible method paper; the paper explicitly notes alternative distributions (negative binomial) are equally adequate, so no ansatz is smuggled by citation. The sample from W25 is a standard self-use of a companion catalog, not a definitional input: σ_CV is not defined by W25's UVLF values. The model comparison is also not circular in its σ_CV content: the UniverseMachine-based models are tuned to the UVLF (μ) and then their σ_CV is computed and compared to the data, so σ_CV is an independent prediction; the baseline UniverseMachine is a calibrated external simulation. The one real flaw is in §3.3: the 'combined model tension' m is explicitly a function of μ_model and μ_data only, with no σ_CV term, and §5 confirms the ranking is 'along the UVLF.' Thus Figure 4 and the relative model significances do not actually include σ_CV, contradicting the abstract's 'combined constraints on σ_CV and the UVLF' wording. This is a missing/incomplete statistic and a correctness risk, not a circular reduction: the empirical σ_CV measurement and the qualitative joint contours (Figures 2/3) remain independent. Appendix B's caveat that quoted uncertainties ignore model misspecification further weakens the quantitative rankings, again a statistical limitation rather than circularity. Overall: no load-bearing step reduces a prediction to its fitted input; minor self-citations (W25, Jespersen et al. 2025c) are not load-bearing. Score 2.
Axiom & Free-Parameter Ledger
free parameters (8)
- ΔM_UV (global boost, model A1) =
1.02^{+0.08}_{-0.07} mag
- ΔM_UV (halo mass > 10^10 M_sun, model A2) =
1.01^{+0.08}_{-0.08} mag
- ΔM_UV (halo mass > 10^10.5 M_sun, model A2) =
0.93^{+0.13}_{-0.19} mag
- SFE (global constant, model B1) =
0.098^{+0.004}_{-0.006}
- SFE_peak (DMSFE slope 0.5, model B2) =
0.63^{+0.03}_{-0.02}
- SFE_peak (DMSFE slope 0.6, model B2) =
0.94^{+0.06}_{-0.06}
- σ_UV (global scatter, model C1) =
1.21^{+0.04}_{-0.04} mag
- σ_UV,norm (halo-mass dependent scatter, model C2) =
1.11^{+0.06}_{-0.05} mag
axioms (6)
- domain assumption ΛCDM cosmology with WMAP9 parameters (h=0.6932, Ω_m,0=0.2865) is assumed throughout.
- domain assumption The F115W-dropout color selection isolates a pure z~10 LBG sample; the 18/18 spectroscopic confirmation rate is taken as evidence of high purity.
- domain assumption Field-to-field galaxy number counts follow a Gamma distribution with variance = mean + μ²σ_CV², and the Negative-Binomial likelihood down-weights outliers.
- domain assumption UniverseMachine light cones reproduce small-scale/non-linear clustering at z~10 well enough to convert b_g,CV to linear bias and to serve as the fiducial comparison.
- ad hoc to paper The simple UniverseMachine modifications (uniform ΔM_UV, constant SFE, power-law SFE, global/halo-dependent σ_UV) faithfully represent the proposed physical model classes.
- ad hoc to paper Dropping one UniverseMachine CANDELS light cone with 'unexplainable and significantly lower typical number densities' is valid; the remaining 32 lines of sight are representative.
Cite this review
Pith. "Pith review of Exploring Cosmic Dawn with PANORAMIC II: Cosmic Variance and Galaxy Clustering at $z\sim10$." pith.science (2026). https://pith.science/paper/XKE7NCME
@misc{pith2026251214212,
  author       = {Pith},
  title        = {Pith review of: Exploring Cosmic Dawn with PANORAMIC II: Cosmic Variance and Galaxy Clustering at $z\sim10$},
  year         = {2026},
  howpublished = {\url{https://pith.science/paper/XKE7NCME}},
  note         = {Machine review of arXiv:2512.14212}
}
read the original abstract
Observational campaigns with JWST have revealed a higher-than-expected abundance of UV-bright galaxies at $z\gtrsim10$, with various proposed theoretical explanations. A powerful complementary constraint to break degeneracies between different models is galaxy clustering. In this paper, we combine PANORAMIC pure parallel and legacy imaging along 34 independent sightlines to measure the cosmic variance ($\sigma_{\rm CV}$) in the number counts of Lyman break galaxies at $z\sim10$ which is directly related to their clustering strength. We find $\sigma_{\rm CV}=0.96^{+0.20}_{-0.18}$, $1.46^{+0.54}_{-0.44}$, and $1.71^{+0.72}_{-0.59}$ per NIRCam pointing ($\sim9.7\,{\rm arcmin}^2$, $\lesssim1.5\,{\rm pMpc}$ at $z\sim10$) for galaxies with M$_{\rm UV}<-19.5$, $-20$, and $-20.5$. Comparing to galaxies in the fiducial UniverseMachine, we find that $\sigma_{\rm CV}$ is consistent with our measurements, but that the number densities are a factor $\gtrsim5$ lower. We implement simple models in the UniverseMachine that represent different physical mechanisms to enhance the number density of UV-bright galaxies. All models decrease $\sigma_{\rm CV}$ by placing galaxies at fixed M$_{\rm UV}$ in lower mass halos, but to varying degrees. Combined constraints on $\sigma_{\rm CV}$ and the UVLF thus tentatively disfavor models that globally increase the star formation efficiency (SFE) or the scatter in the M$_{\rm UV}$-$M_{\rm halo}$ relation, while models that decrease the mass-to-light ratio, or assume a power-law scaling of the SFE with $M_{\rm halo}$ agree better with the data. We show that with sufficient additional independent sightlines, robust discrimination between models is possible, paving the way for powerful constraints on the physics of early galaxy evolution through NIRCam pure parallel imaging.
Figures




Forward citations
Cited by 5 Pith papers
-
The Impact of Cosmic Variance and Satellites on JWST Clustering Measurements at Redshift around 6
Using 1000 mock realizations matched to the ASPIRE survey, the authors find cosmic variance increases clustering errors by ~3x over Poisson estimates and widens minimum halo mass uncertainties by 1.5-3x for z~6 quasar...
-
DeepDive: Simultaneous Formation of Massive Quiescent Galaxies in High-Redshift Galaxy Proto-clusters
JWST data show massive quiescent galaxies in high-redshift proto-clusters formed and quenched simultaneously, with AGN signatures, indicating environmental triggering of quenching.
-
Winding Back the Clock: Recent Star Formation Histories of Massive Quiescent Galaxies Are Consistent With Their Rapid Number Density Evolution Since $\mathbf{z\sim7}$
Star formation histories inferred for z=2-5 massive quiescent galaxies imply past number densities that align with observed rapid evolution since z~7.
-
Tilting at the Turnover: Modeling the Faint-End of the UV Luminosity Function Behind Abell s1063 with JWST
Using lensed JWST data behind Abell S1063, the UVLF at z~6-11 is fit with gradual quadratic turnover, yielding no evidence for turnover to M_UV=-13.5 at z=6, exclusion limits on turnover models, and lower bounds showi...
-
JWST Advanced Deep Extragalactic Survey (JADES) Data Release 5: Photometrically Selected Galaxy Candidates at z > 8
JADES DR5 delivers 2081 z_phot > 8 galaxy candidates with UV slope trends, morphological evidence of clumpy growth, and improved photo-z methods tested on a spectroscopic subsample.
Reference graph
Works this paper leans on
-
[1]
Adams, N. J., Conselice, C. J., Ferreira, L., et al. 2023, MNRAS, 518, 4755, doi: 10.1093/mnras/stac3347
-
[2]
Adams, N. J., Conselice, C. J., Austin, D., et al. 2024, ApJ, 965, 169, doi: 10.3847/1538-4357/ad2a7b Arrabal Haro, P., Dickinson, M., Finkelstein, S. L., et al. 2023, Nature, 622, 707, doi: 10.1038/s41586-023-06521-7
-
[3]
2025, arXiv e-prints, arXiv:2507.03124
Asada, Y., Willott, C., Muzzin, A., et al. 2025, arXiv e-prints, arXiv:2507.03124. https://arxiv.org/abs/2507.03124
arXiv 2025
-
[4]
2023, MNRAS, 524, 5486, doi: 10.1093/mnras/stad1998
Atek, H., Chemerynska, I., Wang, B., et al. 2023, MNRAS, 524, 5486, doi: 10.1093/mnras/stad1998
-
[5]
Barone-Nugent, R. L., Trenti, M., Wyithe, J. S. B., et al. 2014, ApJ, 793, 17, doi: 10.1088/0004-637X/793/1/17
-
[6]
Behroozi, P., Wechsler, R. H., Hearin, A. P., & Conroy, C. 2019, MNRAS, 488, 3143, doi: 10.1093/mnras/stz1182
-
[7]
Berlind, A. A., & Weinberg, D. H. 2002, ApJ, 575, 587, doi: 10.1086/341469
doi:10.1086/341469 2002
-
[8]
1996, A&AS, 117, 393, doi: 10.1051/aas:1996164
Bertin, E., & Arnouts, S. 1996, A&AS, 117, 393, doi: 10.1051/aas:1996164
-
[9]
Blanc, G. A., Lira, P., Barrientos, L. F., et al. 2008, ApJ, 681, 1099, doi: 10.1086/588018
-
[10]
Bouwens, R. J., Oesch, P. A., Labb´ e, I., et al. 2016, ApJ, 830, 67, doi: 10.3847/0004-637X/830/2/67
-
[11]
Accelerated by Dark Matter: a High-redshift Pathway to Efficient Galaxy-scale Star Formation
Boylan-Kolchin, M. 2024, arXiv e-prints, arXiv:2407.10900, doi: 10.48550/arXiv.2407.10900
work page internal anchor Pith review Pith/arXiv arXiv doi:10.48550/arxiv.2407.10900 2024
-
[12]
2023, grizli, 1.9.11, Zenodo, Zenodo, doi: 10.5281/zenodo.8370018
Brammer, G. 2023, grizli, 1.9.11, Zenodo, Zenodo, doi: 10.5281/zenodo.8370018
-
[13]
Brammer, G. B., van Dokkum, P. G., & Coppi, P. 2008, The Astrophysical Journal, 686, 1503 Budav´ ari, T., Connolly, A. J., Szalay, A. S., et al. 2003, ApJ, 595, 59, doi: 10.1086/377168
doi:10.1086/377168 2008
-
[14]
2019, MNRAS, 483, 1922, doi: 10.1093/mnras/sty3069
Velden, C. 2019, MNRAS, 483, 1922, doi: 10.1093/mnras/sty3069
-
[15]
Carnall, A. C., McLure, R. J., Dunlop, J. S., & Dav´ e, R. 2018, MNRAS, 480, 4379, doi: 10.1093/mnras/sty2169
-
[16]
2024, Nature, 633, 318, doi: 10.1038/s41586-024-07860-9
Carniani, S., Hainline, K., D’Eugenio, F., et al. 2024, Nature, 633, 318, doi: 10.1038/s41586-024-07860-9
-
[17]
Carrasco, D., Trenti, M., Mutch, S., & Oesch, P. A. 2018, PASA, 35, e022, doi: 10.1017/pasa.2018.17
-
[18]
2025, arXiv e-prints, arXiv:2507.13160, doi: 10.48550/arXiv.2507.13160
Carvajal-Bohorquez, C., Ciesla, L., Laporte, N., et al. 2025, arXiv e-prints, arXiv:2507.13160, doi: 10.48550/arXiv.2507.13160
-
[19]
Casey, C. M., Kartaltepe, J. S., Drakos, N. E., et al. 2023, ApJ, 954, 31, doi: 10.3847/1538-4357/acc2bc
-
[20]
Casey, C. M., Akins, H. B., Shuntov, M., et al. 2024, ApJ, 965, 98, doi: 10.3847/1538-4357/ad2075
-
[21]
2022, ApJL, 938, L15, doi: 10.3847/2041-8213/ac94d0
Castellano, M., Fontana, A., Treu, T., et al. 2022, ApJL, 938, L15, doi: 10.3847/2041-8213/ac94d0
-
[22]
2024, ApJ, 972, 143, doi: 10.3847/1538-4357/ad5f88
Castellano, M., Napolitano, L., Fontana, A., et al. 2024, ApJ, 972, 143, doi: 10.3847/1538-4357/ad5f88
-
[23]
2024, ApJ, 965, 101, doi: 10.3847/1538-4357/ad2b6c
Genel, S. 2024, ApJ, 965, 101, doi: 10.3847/1538-4357/ad2b6c
-
[24]
2002, PhR, 372, 1, doi: 10.1016/S0370-1573(02)00276-4
Cooray, A., & Sheth, R. 2002, PhR, 372, 1, doi: 10.1016/S0370-1573(02)00276-4
-
[25]
R., Hutter, A., Dayal, P., et al
Cueto, E. R., Hutter, A., Dayal, P., et al. 2024, A&A, 686, A138, doi: 10.1051/0004-6361/202349017
-
[26]
2023, Nature Astronomy, 7, 622, doi: 10.1038/s41550-023-01918-w
Curtis-Lake, E., Carniani, S., Cameron, A., et al. 2023, Nature Astronomy, 7, 622, doi: 10.1038/s41550-023-01918-w
-
[27]
2024, MNRAS, 533, 2391, doi: 10.1093/mnras/stae2006
Dalmasso, N., Leethochawalit, N., Trenti, M., & Boyett, K. 2024, MNRAS, 533, 2391, doi: 10.1093/mnras/stae2006
-
[28]
Dayal, P., Ferrara, A., Dunlop, J. S., & Pacucci, F. 2014, MNRAS, 445, 2545, doi: 10.1093/mnras/stu1848
-
[29]
2023, MNRAS, 523, 3201, doi: 10.1093/mnras/stad1557
Li, Z. 2023, MNRAS, 523, 3201, doi: 10.1093/mnras/stad1557
-
[30]
Donnan, C. T., Dunlop, J. S., McLure, R. J., McLeod, D. J., & Cullen, F. 2025, arXiv e-prints, arXiv:2501.03217, doi: 10.48550/arXiv.2501.03217
-
[31]
Donnan, C. T., McLeod, D. J., Dunlop, J. S., et al. 2023, MNRAS, 518, 6011, doi: 10.1093/mnras/stac3472
-
[32]
Donnan, C. T., McLure, R. J., Dunlop, J. S., et al. 2024, MNRAS, 533, 3222, doi: 10.1093/mnras/stae2037
-
[33]
Feldmann, R., Boylan-Kolchin, M., Bullock, J. S., et al. 2025, MNRAS, 536, 988, doi: 10.1093/mnras/stae2633
-
[34]
2023, MNRAS, 522, 3986, doi: 10.1093/mnras/stad1095
Ferrara, A., Pallottini, A., & Dayal, P. 2023, MNRAS, 522, 3986, doi: 10.1093/mnras/stad1095
-
[35]
Finkelstein, S. L., Bagley, M. B., Ferguson, H. C., et al. 2023, ApJL, 946, L13, doi: 10.3847/2041-8213/acade4
-
[36]
Finkelstein, S. L., Leung, G. C. K., Bagley, M. B., et al. 2024, ApJL, 969, L2, doi: 10.3847/2041-8213/ad4495
-
[37]
Foreman-Mackey, D., Hogg, D. W., Lang, D., & Goodman, J. 2013, PASP, 125, 306, doi: 10.1086/670067
doi:10.1086/670067 2013
-
[38]
Fujimoto, S., Wang, B., Weaver, J. R., et al. 2024, ApJ, 977, 250, doi: 10.3847/1538-4357/ad9027
-
[39]
Gelli, V., Mason, C., & Hayward, C. C. 2024, ApJ, 975, 192, doi: 10.3847/1538-4357/ad7b36
-
[40]
Grogin, N. A., Kocevski, D. D., Faber, S. M., et al. 2011, ApJS, 197, 35, doi: 10.1088/0067-0049/197/2/35
-
[41]
Hainline, K. N., Johnson, B. D., Robertson, B., et al. 2024, ApJ, 964, 71, doi: 10.3847/1538-4357/ad1ee4
-
[42]
2024, ApJ, 960, 56, doi: 10.3847/1538-4357/ad0b7e
Harikane, Y., Nakajima, K., Ouchi, M., et al. 2024, ApJ, 960, 56, doi: 10.3847/1538-4357/ad0b7e
-
[43]
2016, ApJ, 821, 123, doi: 10.3847/0004-637X/821/2/123 —
Harikane, Y., Ouchi, M., Ono, Y., et al. 2016, ApJ, 821, 123, doi: 10.3847/0004-637X/821/2/123 —. 2018, PASJ, 70, S11, doi: 10.1093/pasj/psx097 19
-
[44]
2023, ApJS, 265, 5, doi: 10.3847/1538-4365/acaaa9
Harikane, Y., Ouchi, M., Oguri, M., et al. 2023, ApJS, 265, 5, doi: 10.3847/1538-4365/acaaa9
-
[45]
2016, MNRAS, 460, 2552, doi: 10.1093/mnras/stw840
Campbell, D., & Tollerud, E. 2016, MNRAS, 460, 2552, doi: 10.1093/mnras/stw840
-
[46]
Hegde, S., Wyatt, M. M., & Furlanetto, S. R. 2024, JCAP, 2024, 025, doi: 10.1088/1475-7516/2024/08/025
-
[47]
2009, A&A, 498, 725, doi: 10.1051/0004-6361/200811042
Hildebrandt, H., Pielorz, J., Erben, T., et al. 2009, A&A, 498, 725, doi: 10.1051/0004-6361/200811042
-
[48]
2013, ApJS, 208, 19, doi: 10.1088/0067-0049/208/2/19
Hinshaw, G., Larson, D., Komatsu, E., et al. 2013, ApJS, 208, 19, doi: 10.1088/0067-0049/208/2/19
-
[49]
Hogg, D. W., Bovy, J., & Lang, D. 2010, arXiv e-prints, arXiv:1008.4686, doi: 10.48550/arXiv.1008.4686
-
[50]
Hutter, A., Cueto, E. R., Dayal, P., et al. 2025, A&A, 694, A254, doi: 10.1051/0004-6361/202452460
-
[51]
2018, ApJ, 854, 73, doi: 10.3847/1538-4357/aaa544
Ishigaki, M., Kawamata, R., Ouchi, M., et al. 2018, ApJ, 854, 73, doi: 10.3847/1538-4357/aaa544
-
[52]
2017, ApJ, 841, 8, doi: 10.3847/1538-4357/aa6d64
Ishikawa, S., Kashikawa, N., Toshikawa, J., et al. 2017, ApJ, 841, 8, doi: 10.3847/1538-4357/aa6d64
-
[53]
1946, Proceedings of the Royal Society of London
Jeffreys, H. 1946, Proceedings of the Royal Society of London. Series A. Mathematical and Physical Sciences, 186, 453
1946
-
[54]
Jespersen, C. K., Carnall, A. C., & Lovell, C. C. 2025a, ApJL, 988, L19, doi: 10.3847/2041-8213/adeb7c
-
[55]
K., Cranmer, M., Melchior, P., et al
Jespersen, C. K., Cranmer, M., Melchior, P., et al. 2022, ApJ, 941, 7, doi: 10.3847/1538-4357/ac9b18
-
[56]
Jespersen, C. K., Melchior, P., Spergel, D. N., et al. 2025b, arXiv e-prints, arXiv:2503.03816, doi: 10.48550/arXiv.2503.03816
-
[57]
Lovell, C. C. 2025c, ApJ, 982, 23, doi: 10.3847/1538-4357/adb422
-
[58]
Jose, C., Baugh, C. M., Lacey, C. G., & Subramanian, K. 2017, MNRAS, 469, 4428, doi: 10.1093/mnras/stx1014
-
[59]
Jose, C., Lacey, C. G., & Baugh, C. M. 2016, MNRAS, 463, 270, doi: 10.1093/mnras/stw1702
-
[60]
2016, MNRAS, 457, 4340, doi: 10.1093/mnras/stw248
Klypin, A., Yepes, G., Gottl¨ ober, S., Prada, F., & Heß, S. 2016, MNRAS, 457, 4340, doi: 10.1093/mnras/stw248
-
[61]
2024, arXiv e-prints, arXiv:2405.04578, doi: 10.48550/arXiv.2405.04578
Kravtsov, A., & Belokurov, V. 2024, arXiv e-prints, arXiv:2405.04578, doi: 10.48550/arXiv.2405.04578
-
[62]
2022, MNRAS, 509, 5836, doi: 10.1093/mnras/stab3265
Roberts-Borsani, G., & Treu, T. 2022, MNRAS, 509, 5836, doi: 10.1093/mnras/stab3265
- [63]
-
[64]
Li, Z., Dekel, A., Sarkar, K. C., et al. 2024, A&A, 690, A108, doi: 10.1051/0004-6361/202348727
-
[65]
2025, arXiv e-prints, arXiv:2511.09618, doi: 10.48550/arXiv.2511.09618
Schaye, J. 2025, arXiv e-prints, arXiv:2511.09618, doi: 10.48550/arXiv.2511.09618
-
[66]
2012, ApJ, 756, 71, doi: 10.1088/0004-637X/756/1/71 L´ opez-Sanjuan, C., Cenarro, A
Lin, L., Dickinson, M., Jian, H.-Y., et al. 2012, ApJ, 756, 71, doi: 10.1088/0004-637X/756/1/71 L´ opez-Sanjuan, C., Cenarro, A. J., Hern´ andez-Monteagudo, C., et al. 2015, A&A, 582, A16, doi: 10.1051/0004-6361/201526731
-
[67]
Lu, S., Frenk, C. S., Bose, S., et al. 2025, MNRAS, 536, 1018, doi: 10.1093/mnras/stae2646
-
[68]
Mason, C. A., Trenti, M., & Treu, T. 2015, ApJ, 813, 21, doi: 10.1088/0004-637X/813/1/21 —. 2023, MNRAS, 521, 497, doi: 10.1093/mnras/stad035
-
[69]
Mauerhofer, V., Dayal, P., Haehnelt, M. G., et al. 2025, A&A, 696, A157, doi: 10.1051/0004-6361/202554042
-
[70]
J., Wolk, M., Colombi, S., et al
McCracken, H. J., Wolk, M., Colombi, S., et al. 2015, MNRAS, 449, 901, doi: 10.1093/mnras/stv305
-
[71]
2009, A&A, 505, 463, doi: 10.1051/0004-6361/200912314
Meneux, B., Guzzo, L., de la Torre, S., et al. 2009, A&A, 505, 463, doi: 10.1051/0004-6361/200912314
-
[72]
2020, MNRAS, 499, 4534, doi: 10.1093/mnras/staa3150
Mirocha, J. 2020, MNRAS, 499, 4534, doi: 10.1093/mnras/staa3150
-
[73]
Mo, H. J., & White, S. D. M. 1996, MNRAS, 282, 347, doi: 10.1093/mnras/282.2.347
-
[74]
Morishita, T., Mason, C. A., Kreilgaard, K. C., et al. 2025, ApJ, 983, 152, doi: 10.3847/1538-4357/adbbdc
-
[75]
Moster, B. P., Somerville, R. S., Newman, J. A., & Rix, H.-W. 2011, ApJ, 731, 113, doi: 10.1088/0004-637X/731/2/113 Mu˜ noz, J. B., Mirocha, J., Furlanetto, S., & Sabti, N. 2023, MNRAS, 526, L47, doi: 10.1093/mnrasl/slad115
-
[76]
Naidu, R. P., Oesch, P. A., van Dokkum, P., et al. 2022, ApJL, 940, L14, doi: 10.3847/2041-8213/ac9b22
-
[77]
Naidu, R. P., Oesch, P. A., Brammer, G., et al. 2025, arXiv e-prints, arXiv:2505.11263. https://arxiv.org/abs/2505.11263
arXiv 2025
-
[78]
Newman, J. A., & Davis, M. 2002, ApJ, 564, 567, doi: 10.1086/324148
doi:10.1086/324148 2002
-
[79]
A., & Moster, B
Newman, J. A., & Moster, B. P. 2014, QUICKCV: Cosmic variance calculator, Astrophysics Source Code Library, record ascl:1402.012
2014
-
[80]
Norberg, P., Baugh, C. M., Hawkins, E., et al. 2002, MNRAS, 332, 827, doi: 10.1046/j.1365-8711.2002.05348.x
arXiv 2002
discussion (0)
Sign in with ORCID, Apple, or X to comment. Anyone can read and Pith papers without signing in.