REVIEW 4 major objections 4 minor 2 references
RiskBridge: Turning CVEs into Business-Aligned Patch Priorities
T0 review · 4 major / 4 minor · reviewed 2026-08-03 · deepseek-v4-flash
Pith's one-line read RiskBridge claims a compliance-aware, explainable pipeline turns CVE feeds into patch decisions that cut residual risk by 88% and tighten patch SLAs by 18 days, with near-perfect top-3 exploit prediction precision.
desk verdict A plausible engineering integration pulled down by a non-auditable evaluation; the KEV circularity makes the headline numbers uninterpretable. read the letter →
The pith
A machine-rendered reading of the paper's core claim, the machinery that carries it, and where it could break.
The reading
What carries the argument
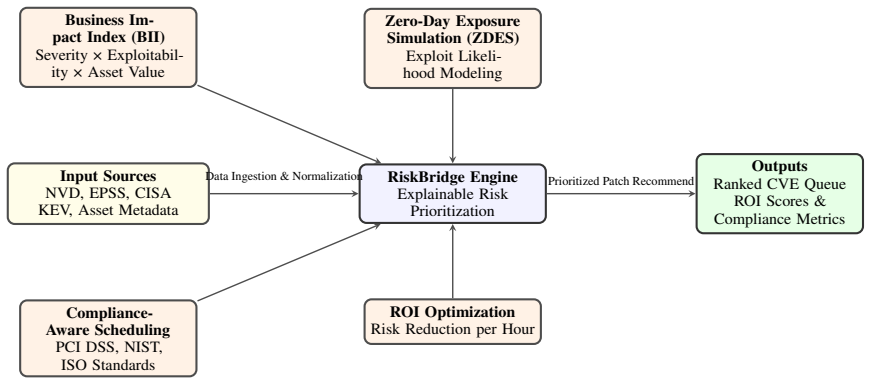
The central mechanism is the Zero-Day Exposure Simulation (ZDES) score: ZDES = 0.35·EPSS + 0.3·(CVSS/10) + 0.2·(1−KEV) + 0.15·Recency. It converts three independent public intelligence sources into a single forecast of near-term exploitation. The other load-bearing components are the Policy-as-Code Engine, which compiles PCI DSS 6.3.3 and NIST SP 800-53 requirements into SLA deadlines annotated with a due_basis for auditability, and a weighted set-cover ROI optimizer that maximizes cumulative risk reduction per patch hour.
What would settle it
Take a historical cutoff date, run RiskBridge using only KEV, EPSS, and CVSS data available before that date, then measure Precision@3 against CVEs that first appear in the KEV catalog after the cutoff. If precision drops well below 1.00, the reported perfect score reflects label leakage rather than predictive power.
Extended reading notes
Core claim
The paper's central claim is that exploit likelihood, business impact, and compliance deadlines can be fused into a single explainable priority score, and that doing so yields empirically strong remediation outcomes on public CVE data. RiskBridge's ZDES model combines EPSS probability (weight 0.35), CVSS severity (0.30), absence from the CISA KEV list (0.20), and vulnerability recency (0.15) into a near-term exploitability estimate. A Business Impact Index blends severity, exploitability, asset criticality, and patch effort into a normalized 0–1 score, while a policy engine maps PCI DSS and NIST rules to concrete due dates, and a weighted set-cover optimizer minimizes redundant patching. The
Load-bearing premise
The evaluation assumes that Precision@3 = 1.00 is measured against a ground truth that is independent of the KEV status used as a feature in ZDES; if the model is effectively predicting the same KEV list it consumes, the headline accuracy and the 88% risk reduction collapse.
Editorial extensions
If this is right
- If the ZDES weighting is sound, security teams can produce a dynamic, daily-updated priority queue rather than relying on static CVSS severity.
- If the policy engine works as described, compliance deadlines (e.g., PCI DSS one-month patching) become machine-enforced, with each recommendation traceable to a specific regulation.
- If the ROI optimizer is correct, organizations can cover more CVEs with fewer patches—reported 71% coverage and 1.5 CVEs per patch effort—reducing remediation cost.
- If the evaluation is uncontaminated, RiskBridge's Precision@3 of 1.00 suggests near-perfect identification of the top-three most likely exploited CVEs in the test period, which would beat all four baselines by a substantial margin.
- The reported 18-day SLA tightening implies that shifting from severity-only to exploit/compliance-aware scheduling can materially reduce mean time to remediate.
Reading between the lines
- The paper leaves implicit that the ZDES weights (0.35/0.30/0.20/0.15) are hand-set; a natural testable extension is to learn these weights from historical exploit outcomes, which could either strengthen or undermine the reported gains.
- The KEV-absence term in ZDES creates a potential circularity risk: if the evaluation's positive labels are KEV entries, the (1−KEV) feature could encode the label itself. A clean holdout test using future KEV additions as ground truth would separate genuine prediction from labeling feedback.
- The compliance-gain metric is computed relative to SLA deadlines the policy engine itself sets; an independent auditor would need to verify that these deadlines match the external regulatory text, not just the engine's interpretation.
Signed reviews
Editorial analysis
A structured set of objections, weighed in public.
Referee Report
Summary. The paper proposes RiskBridge, an enterprise vulnerability-prioritization framework that fuses CVSS v4, EPSS, and CISA KEV data through a Zero-Day Exposure Simulation (ZDES) scoring model, a Policy-as-Code compliance engine, and a set-cover ROI optimizer. The authors report Precision@3 = 1.00, F1 = 0.80, Compliance Gain = 19.3 days, ROI = 4.7 risk/hr, an 88% total risk reduction, and an 18-day SLA tightening relative to CVSS-only, EPSS, CISA KEV, and Tenable VPR baselines. The paper also includes an ablation study and two case studies intended to demonstrate operational impact.
Significance. If the evaluation were auditable, the paper would be a practical contribution to vulnerability management: it targets a real operational problem, combines multiple public intelligence sources, and emphasizes explainability via compliance-basis annotations and BII/ZDES traces. The deterministic, API-driven pipeline and the stated intent to release scripts are also strengths. However, the central evaluation as presented is not reproducible and the headline numbers are consistent with target leakage: KEV appears both as an input feature and as the only named ground-truth label, while the Precision@3 protocol is never defined. Because the primary claims rest on this evaluation, the paper cannot be accepted in its current form.
major comments (4)
- [§4.1, Table 3; Eq. (1); Table 1] Precision@3 and downstream metrics are not defined against a specified ground-truth label, while KEV appears as both a predictor and the only named ground truth. §4 calls CISA KEV 'offering ground-truth binary labels for known exploited vulnerabilities'; Eq. (1) scores 0.2(1−KEV) and Table 1 marks any KEV-listed CVE as 'Urgent.' If the Precision@3 label is KEV membership, then a ranker that places KEV-listed CVEs at the top trivially achieves Precision@3 = 1.00. The paper never states the label definition, the evaluation date, the candidate CVE set, or a temporal split between feature and label, so the central result cannot be distinguished from this leakage artifact.
- [§4, Table 3] No dataset cardinality, date-stamped snapshots, or common evaluation set is given. Table 3 evaluates each baseline on a different 'Dataset' (NVD, EPSS, KEV, Mixed, NVD+EPSS+KEV), so the claimed 25% compliance-gain improvement and 20% ROI improvement over Tenable VPR are not apples-to-apples comparisons. No error bars, confidence intervals, or repeated trials are reported. This makes the quantitative superiority claims uncheckable.
- [Abstract, §6, §4] The headline '88% reduction in residual risk' appears in the abstract and conclusion but is never computed, defined, or derived in Section 4. There is no residual-risk metric, formula, or measurement protocol. Similarly, the '18-day SLA tightening' is not connected to the Compliance Gain metric (19.3 days) or to any SLA simulation. These are load-bearing quantitative claims, and they are unsupported by the experimental section.
- [§4.2, §4.4, Eq. (1)] The ablation study does not resolve the underlying evaluation problem. Removing ZDES or BII changes Precision@3 from 1.00 to 0.85/0.78, but because the label is never defined, those numbers carry the same ambiguity as the main result. The claimed module contributions (40%/35% drops) are not accompanied by any statistical test or confidence interval. Additionally, §4.2 states that ZDES uses 'EPSS and CVSS parameters in the absence of KEV listings,' which conflicts with Eq. (1) where 0.2(1−KEV) is explicitly scored; this inconsistency matters for interpreting what ZDES predicts.
minor comments (4)
- [Figure 4] The axes in Figure 4 appear mismatched with the caption: the x-axis is labeled 'Compliance Gain (days)', the y-axis 'Risk Reduced', and the color scale 'CVSS Severity', while the title says 'ROI vs Compliance Gain Across CVEs.' ROI is not plotted.
- [§5.1, Table 5] The percentage claims in the text are not fully consistent with the table: 1.00/0.73 ≈ 1.37×, not 1.4×; (19.3−15.2)/15.2 ≈ 27%, not 26%; (4.7−3.4)/3.4 ≈ 38%, not 35%. The numbers are close but should be reconciled.
- [§3] The Business Impact Index (BII) is described in prose but no formula is given, and the Policy-as-Code expression `Due = Base SLA × Threat(E) × Env` leaves Base SLA, Threat(E), and Env undefined. Since the paper stresses explainability, these definitions should be provided.
- [Appendix D] The appendix says 'evaluation scripts will be released on GitHub,' but no repository URL or artifact version is given. In addition, 'Napkin AI' and 'Google Colab' appear as references, which is unusual and should be removed or properly justified.
Circularity Check
KEV status is both a scored feature (Table 1) and the ground-truth label (Section 4), so the reported Precision@3=1.00 can reduce to label-reading by construction.
-
self definitional
[Table 1; Section 4 'Experimental Setting' and 'Evaluation Metrics'; Table 3]
"Urgent CVSS≥9 or EPSS≥0.5 or KEV-listed ... CISA KEV Catalog (2025)— offering ground-truth binary labels for known exploited vulnerabilities ... Precision@K— top-K exploit prediction accuracy ... RiskBridge (Ours) NVD + EPSS + KEV 1.00"
The same KEV variable appears on both sides of the evaluation. Table 1 makes KEV-listed vulnerabilities automatically Urgent, and Section 4 says the CISA KEV Catalog supplies the ground-truth binary labels for exploited vs. non-exploited CVEs; Precision@K is then described as 'top-K exploit prediction accuracy.' A prioritizer that ranks KEV-listed CVEs first would trivially obtain Precision@3=1.00 under this label. No temporal split, future-label definition, dataset size, or date-stamped snapshot is given, so the reported perfect exploit-prediction score is indistinguishable from reading the label off the input feature.
full rationale
The derivation chain for the headline predictive claim is not self-contained. The only ground-truth source named for exploit prediction is the CISA KEV Catalog, while the RiskBridge scoring pipeline consumes KEV membership directly (Table 1 makes KEV-listed CVEs Urgent; BII includes KEV exploitation status). Hence the reported Precision@3=1.00 can be obtained by construction rather than by forecasting. The ZDES formula (Eq. 1) also uses (1-KEV), and Table 1 uses KEV positively, an internal inconsistency that the paper never resolves; either way, KEV appears as both input and label without a stated temporal split. The 88% risk reduction and 18-day SLA gains are not traced to any equation or protocol, so they cannot be audited, but they are better characterized as unsupported rather than circular. The self-citations (Khatik and Sheikh 2025, IJRASET 2024) are not load-bearing for the central derivation. Overall, one central 'prediction' metric reduces to the input label by construction, warranting a 6.
Assumptions & free parameters
free parameters (4)
- ZDES weights (0.35, 0.30, 0.20, 0.15) =
0.35, 0.30, 0.20, 0.15
- Urgency thresholds (CVSS≥9, EPSS≥0.5, EPSS>0.3) =
9, 0.5, 0.3
- Base SLA and Env factors in Due = Base SLA × Threat(E) × Env =
unspecified
- BII weighting =
unspecified
assumptions (4)
- domain assumption EPSS scores are valid forecasts of exploitation probability.
- domain assumption CISA KEV is an accurate and complete ground truth for exploited vulnerabilities.
- domain assumption Compliance deadlines can be represented as simple arithmetic SLA multipliers.
- domain assumption Weighted set-cover accurately models patching dependencies (patch once, fix many).
invented entities (2)
-
ZDES (Zero-Day Exposure Simulation) score
-
BII (Business Impact Index)
Cite this review
Pith. "Pith review of RiskBridge: Turning CVEs into Business-Aligned Patch Priorities." pith.science (2026). https://pith.science/paper/YXJUNCQH
@misc{pith2026260106201,
  author       = {Pith},
  title        = {Pith review of: RiskBridge: Turning CVEs into Business-Aligned Patch Priorities},
  year         = {2026},
  howpublished = {\url{https://pith.science/paper/YXJUNCQH}},
  note         = {Machine review of arXiv:2601.06201}
}
read the original abstract
Enterprises are confronted with an unprecedented escalation in cybersecurity vulnerabilities, with thousands of new CVEs disclosed each month. Conventional prioritization frameworks such as CVSS offer static severity metrics that fail to account for exploit probability, compliance urgency, and operational impact, resulting in inefficient and delayed remediation. This paper introduces RiskBridge, an explainable and compliance-aware vulnerability management framework that integrates multi-source intelligence from CVSS v4, EPSS, and CISA KEV to produce dynamic, business -- aligned patch priorities. RiskBridge employs a probabilistic Zero-Day Exposure Simulation (ZDES) model to forecast near-term exploit likelihood, a Policy-as-Code Engine to translate regulatory mandates (e.g., PCI DSS, NIST SP 800-53) into automated SLA logic, and an ROI-driven Optimizer to maximize cumulative risk reduction per remediation effort. Experimental evaluations using live CVE datasets demonstrate an 88% reduction in residual risk, an 18-day improvement in SLA compliance, and a 35% increase in remediation efficiency compared to state-of-the-art commercial baselines. These findings validate RiskBridge as a practical and auditable decision-intelligence system that unifies probabilistic modeling, compliance reasoning, and optimization analytics. The framework represents a step toward automated, explainable, and business-centric vulnerability management in modern enterprise environments
Figures


Figures from the paper (1 more)

Reference graph
Works this paper leans on
-
[2021]
Technical report, FIRST.org
Predicting exploitation of vulnerabilities: An empirical analysis of epss. Technical report, FIRST.org. Accessed: 2025-12-20. Jay Jacobs, Sasha Romanosky, and Benjamin Edwards
2025
-
[2023]
Yuning Jiang, Nay Oo, Qiaoran Meng, et al
Predicting exploitation of vulnerabilities: An empirical analysis of epss.FIRST.org Research Pa- per. Yuning Jiang, Nay Oo, Qiaoran Meng, et al. 2025. A survey on vulnerability prioritization: Taxonomy, metrics, and research challenges.ArXiv preprint arXiv:2502.11070. Awez Khatik and Yelena Sheikh. 2025. Ai-driven vul- nerability management: Towards predi...
arXiv 2025
Reviewed August 3, 2026 · model on record in the stance chip above.
Discussion (0). Continue with ORCID to comment.