REVIEW 4 major objections 5 minor 5 cited by
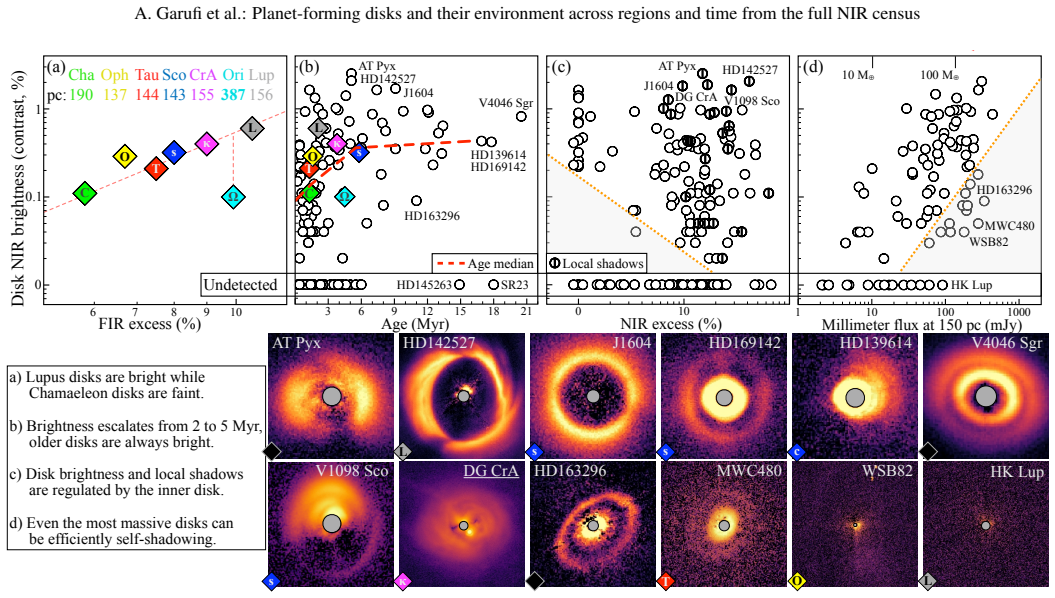
This census of 268 near-infrared disk images argues that ambient infalling material—not only young planets—produces many of the spirals and shadows seen in planet-forming disks, and that disk brightness jumps sharply between 2 and 5 Myr.
Reviewed by Pith at T0; open to challenge. T0 means a machine referee read the full paper against a public rubric. the ladder, T0–T4 →
T0 review · deepseek-v4-flash
2026-08-02 19:33 UTC pith:AFVQU72C
load-bearing objection A valuable, carefully assembled census that should be the reference for NIR disk demographics—but the abstract's claim that environment 'proves' the infall-spiral connection outruns what the body actually establishes. the 4 major comments →
Planet-forming disks and their environment across regions and time from the full NIR census
The pith
A machine-rendered reading of the paper's core claim, the machinery that carries it, and where it could break.
Core claim
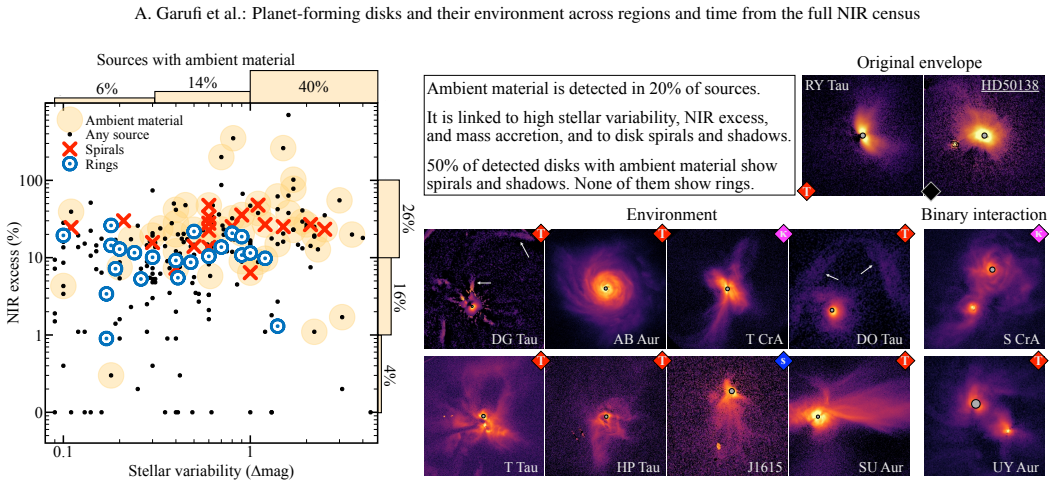
By homogenizing stellar ages, masses, accretion rates, variability, and infrared excesses across a 268-source sample, the paper shows that disks in coeval regions differ systematically: Lupus disks are bright, Chamaeleon disks faint, and Taurus and Corona Australis disks are frequently embedded in ambient emission. The time sequence shows a sharp rise in disk brightness between 2 and 5 Myr, with no near-infrared cavities around single stars younger than about 2.5–3 Myr. The strongest specific result is statistical: among disks with detected ambient material, about half show spiral arms and half show shadows, while none show rings. The paper therefore proposes that late infall from the inters
What carries the argument
The key object is the census itself: a uniformly processed sample of 268 near-infrared scattered-light images with re-derived stellar parameters. The mechanistic load is carried by the classification of ambient material (streamers, envelope leftovers, binary-interaction structures) as a tracer of late infall. Because this infalling gas arrives with a different angular momentum direction, it can warp the inner disk and excite spiral density waves in the outer surface seen in scattered light, while a ring-like structure would require a more symmetric perturbation.
Load-bearing premise
The ages of the stars come from pre-main-sequence evolutionary tracks, which carry factor-of-two-to-three systematic uncertainties for young stars, and every time-dependent claim in the paper rests on this age scale.
What would settle it
A sample of disks with ages measured directly from cluster membership or lithium depletion (instead of isochrones) that showed no sharp brightness jump between 2 and 5 Myr, or a single disk with clear rings embedded in strong infalling ambient material, would contradict the paper's central claims.
If this is right
- If infall-driven spirals are common, then many spiral patterns in near-infrared images are weak evidence for embedded planets; planet-search programs should treat disks with ambient material as contaminated.
- The 2–5 Myr brightness jump implies that disk evolution has a sharp transition at roughly 3 Myr, when inner dust clearing begins in single stars.
- Long-lived disks (>8 Myr) are always bright and usually cavity-bearing, supporting the idea that only disks with a strong pressure bump survive.
- The region-to-region differences among coeval disks mean that local environment, not age alone, sets the typical disk morphology.
- The association of ambient material with higher accretion rates ties episodic accretion to the disk's external environment.
Where Pith is reading between the lines
- A deeper survey reaching fainter low-mass old disks (e.g., with future 30-m telescopes) could test whether the 'old disks are always bright' statement is an upper-envelope selection effect rather than a physical law.
- If infall drives warps, then the fraction of disks with shadows in a region should correlate with the local interstellar gas density; this is testable region by region with current cloud surveys.
- The claim that rings never appear in disks with ambient material may be a timescale effect: rings take longer to emerge, and infall either prevents their formation or destroys them, a distinction that ALMA midplane observations could decide.
- Spin-orbit misalignment statistics from future astrometric surveys could independently confirm that late infall, rather than companions, is the dominant warp mechanism.
Editorial analysis
A structured set of objections, weighed in public.
Referee Report
Summary. This manuscript presents a census of 268 young stars with near-IR high-contrast imaging, adding 51 unpublished SPHERE datasets. The authors consistently derive stellar masses, ages, accretion rates, IR excesses, and mm-based dust-mass proxies; they flag sources with poor parallaxes, high extinction, and high disk inclination; and they classify disk detections, disk brightness via alpha_pol, substructures (cavity, rings, spirals), shadows, and ambient material. The main claims are: disk NIR brightness rises abruptly between ~2 and 5 Myr; NIR cavities around single stars appear only after 2–3 Myr; old disks are always bright; ambient material is present in ~20% of sources and decreases with age; and half of disks with ambient material show spirals and shadows while none show rings. The authors propose that late infall from the ISM generally induces the spirals and warps responsible for shadows, and that this infall also boosts stellar variability and accretion.
Significance. If the results hold, this becomes the reference NIR disk census and shifts the interpretation of NIR spirals/shadows from primarily planet-induced to partly environment-induced. The manuscript's strengths are real: a transparent 268-source compilation, 51 new SPHERE images, explicit quality flags for parallax/extinction/inclination, an honest completeness analysis (Table 2), consistent derivation of stellar and disk properties, and open publication of the per-object table. The statistics are direct measurements and no quantity is fitted to a target claim, so circularity is not the concern. The main risks are age-systematics and a brightness/selection confound in the infall–morphology association; both are addressable within this manuscript's scope.
major comments (4)
- [§2.2/2.4, Fig. 4b] All time-dependent claims (brightness rise 2–5 Myr, cavity onset at 2.5–3 Myr, declining ambient fraction, “old disks are always bright”) are binned by isochrone ages. The paper acknowledges the difficulty and flags high-extinction/poor-parallax/inclined sources, but flagged sources cluster in the oldest quartile of the young regions, and the age scale depends on the choice among five track sets. A factor-of-2–3 age error would smear or shift the 2–5 Myr transition, while the absence of old faint/low-mass disks is partly an R<13 selection effect. Please provide a robustness test: recompute Fig. 4(b) and the age-bin statistics for each track set separately and with/without flagged sources; ideally anchor the young/mature/old boundaries to region membership as a cross-check.
- [§3.3.3 and §3.4, Fig. 6] The core infall–spiral association is not controlled for disk brightness. The same paper states that substructures are found in >90% of bright disks but <20% of faint disks, and ambient sources preferentially occupy the high-NIR-excess, enshrouded quadrant (two-thirds of the 52 ambient sources). Since alpha_pol and NIR excess govern both the detectability of spirals and the detectability of faint ambient scattered light, the reported correlation may be a selection effect. Ring hosts have lower NIR excess and variability than spiral hosts, so the zero-ring count among ambient disks may partly reflect non-detection of ambient material around ring disks. Please stratify the ambient–morphology comparison by alpha_pol and NIR-excess bins, or match non-ambient control disks, and report exact counts with binomial confidence intervals for the 52%/48%/0% fractions.
- [§3.4] The “ambient material” category includes 25 sources classified as binary interaction, and stellar systems show a higher ambient fraction (Fig. 3). Stellar companions can independently create spirals, warps, shadows, and variability (e.g., GG Tau, HD100453). Therefore the statistical association between ambient signal and spirals is not uniquely attributable to late infall. Please separate the binary-interaction class from the streamer/environment class in the correlation analysis, or control for multiplicity; at minimum, report how many of the spiral+ambient disks are binary systems.
- [§4.3, Table 3] The cross-region test connecting ISM surface density to ambient fraction is acknowledged as “suggestive rather than conclusive,” but as written it is not a test: aggregate Sigma_gas is averaged over YSO sub-regions, Taurus has no quoted uncertainty, and n=7 regions. The same table shows Corona Australis with high ambient fraction but not the highest Sigma_gas, and Ophiuchus has only a slightly higher ambient fraction than Lupus despite a much higher Sigma_gas. This is acceptable as motivation, but it should not be presented as supporting evidence for infall; either provide per-source local density estimates or explicitly mark the comparison as an untested hypothesis.
minor comments (5)
- [Abstract and §4] Minor language issues: “why are young disks faint” should be “why young disks are faint”; “two-third” should be “two-thirds”; the opening of §4 has “the our considerations” — remove “the”.
- [Fig. 4 and Appendix A tables] The units of disk brightness are inconsistent: Fig. 4 uses percent contrast, while Tables A.1–A.5 quote alpha_pol in 10^-3. Please define the conversion once and use a single convention throughout.
- [Table 2] The column header f_obs/II(R<13) is dense and ambiguous. Clarify in the caption whether the denominator is all Class II sources or only those with R<13, and label columns more explicitly.
- [§3.4] The ambient categories (envelope, binary interaction, environment) are said to be non-exclusive, but the text reports 8, 25, and 44 sources. State how many unique sources have each flag and how the 52 total is obtained after overlap.
- [Appendix A] PDS 144 N is shown in Fig. A.1 but excluded from the sample, and the text also uses “PDS 144 A” and “PDS 144 S.” Please make the naming and inclusion decision consistent in the table and gallery.
Circularity Check
No significant circularity: census statistics are direct measurements; no fitted parameter is repackaged as a prediction.
full rationale
This paper is an observational census, not a derivation with fitted parameters that are then used to predict the same data. The central claims—disk brightness trends, substructure fractions, ambient-material incidence, and correlations with variability/accretion—are direct counts, medians, and classifications from the 268-source image sample. No equation in the paper defines a quantity in terms of the very quantity it is used to explain; for example, the brightness measure α_pol is a defined observable, and the paper explicitly notes where its construction affects interpretations (Sect. 3.2.2: 'any flux detected at large radii, by construction of α_pol, significantly contributes to the disk brightness'), rather than treating that as an independent prediction. The infall–spiral proposal (Sect. 4.3) is presented as an interpretation of a statistical association, not as a result forced by fitting a parameter to that association. Self-citations (Garufi et al. 2017 for α_pol, Garufi et al. 2018 for the age method, Garufi et al. 2022a for the SED quadrant scheme) are methodological lineage or prior independent data applied to a larger sample; they are not used in place of evidence for the paper's new claims. The paper also acknowledges and attempts to address known selection effects, such as the faintness of old low-mass stars and the brightness dependence of substructure detectability, rather than hiding them. Thus no step in the claimed chain reduces to its own inputs by construction.
Axiom & Free-Parameter Ledger
free parameters (4)
- Age boundaries (young ≤3 Myr, mature 3–8 Myr, old >8 Myr) =
3 Myr, 8 Myr
- Observability threshold R<13 (G_RP) =
R ≈ 13 mag
- Sample exclusions (embedded Class I, edge-on disks, no IR excess to 20 µm) =
10 Class I, ~2 edge-on, no-excess sources excluded
- Millimeter flux → dust mass conversion =
≈100 mJy at 150 pc ≃ 10 M⊕
axioms (5)
- domain assumption Pre-main-sequence isochrones (Siess 2000; Bressan 2012; Baraffe 2015; Choi 2016; Feiden 2016) give unbiased stellar ages for 1–20 Myr stars once extinction/inclination are flagged
- domain assumption Polarized near-IR scattered light (α_pol) is a fair proxy for outer-disk illumination and brightness
- domain assumption Visual classification of disks (detection, cavity/ring/spiral/shadow) and of ambient material is uniform and reliable across SPHERE, GPI, NaCo, HiCiao, and HST images
- domain assumption NIR cavities in scattered light trace dust-depleted inner regions whose opening requires a pressure bump (planet or companion)
- domain assumption Ambient light in the NIR traces late infall from the ISM rather than outflow cavities, envelope remnants, or chance projection
read the original abstract
The evolution of planet-forming disks and the processes of planet formation influence each other, and both of them are possibly impacted by the local environment. Extensive high-resolution imagery of disks across space and time is the best tool for determining their evolution. We compiled a comprehensive list of disk-bearing young stars with near-IR high-contrast images available. The sample sums up to 268 sources, including 51 targets with no prior publications, which makes this study the largest of its kind and the most extensive release of IR disk images to date. Our census reveals very diverse disk and ambient morphologies. Disks in Lupus are bright, in Chamaeleon are faint, in Corona Australis and Taurus are frequently surrounded by ambient emission. Disks experience an abrupt increase in IR brightness between 2 Myr and 5 Myr. The earliest IR disk cavities around single stars arise after 2-3 Myr explaining why are young disks faint in the near-IR, and determining which disks can live longer. Well-known, high-longevity disks (>8 Myr) are always bright. Ambient material is detected in more than 20% of young sources but the fraction drops with time. We find a clear correspondence for the presence of ambient material with the stellar variability, near-IR excess, and mass accretion rate as well as, in turn, with spirals and shadows in disks. Half of the disks with ambient material show spirals while none of them show rings. We therefore propose that the spirals and the disk warps responsible for shadows are generally induced by late infall from the medium, and that this also affects the stellar accretion. The emerging picture proves the fundamental role of the environment for the disk evolution and planet formation.
Figures





Forward citations
Cited by 5 Pith papers
-
Interpreting the scattering surface in protoplanetary disks
Semi-analytical model links observed scattering-surface height to small-dust mass, yielding global mass fractions of order 10^{-3} consistent with modest grain growth in ten protoplanetary disks.
-
Interpreting the scattering surface in protoplanetary disks
Scattered-light ring heights trace the tau~1 surface and, combined with CO temperature maps, yield small-dust mass fractions near 10^-3 in ten protoplanetary disks.
-
Scattered light signatures of flyby-induced warps in protoplanetary discs
Flyby-induced warps create broad, time-varying shadows in scattered light that persist for most of a low-viscosity disc lifetime and could be used to constrain disc viscosity.
-
Scattered light signatures of flyby-induced warps in protoplanetary discs
Flyby-induced warps create observable oscillating shadows in scattered light for low-viscosity discs lasting most of their ~10^6 year lifetime, enabling surveys to probe viscosity.
-
Analysis of the young disk around WRAY 15-1880: does it contain a primitive planetary system?
A candidate 0.3-7.6 MJup companion is reported in the gap of the ~2.8 Myr pre-transitional disk around WRAY 15-1880, with an ALMA blob interpreted as a vortex at the m=1 Lindblad resonance.
Reference graph
Works this paper leans on
-
[1]
Akeson, R. L., Jensen, E. L. N., Carpenter, J., et al. 2019, ApJ, 872, 158 Akiyama, E., V orobyov, E. I., Liu, H. B., et al. 2019, AJ, 157, 165 Alcalá, J. M., Manara, C. F., Natta, A., et al. 2017, A&A, 600, A20 André, P., Belloche, A., Motte, F., & Peretto, N. 2007, A&A, 472, 519 André, P., Men’shchikov, A., Bontemps, S., et al. 2010, A&A, 518, L102 Andr...
Pith/arXiv arXiv 2019
-
[134]
This case is very similar to that of Sz 72 where a deviation from centro-symmetric scattering induced by a very inclined disk is possible
The disk is only marginally detected around the coro- nagraph. This case is very similar to that of Sz 72 where a deviation from centro-symmetric scattering induced by a very inclined disk is possible. Appendix A.2: Y oung intermediate-mass stars Nine stars were observed in the program 0111.C-0369 (PI: Vioque). Two of them (HD158643 – or 51 Oph – and HD50...
2022
-
[415]
The image shows a very inclined disk
This is a showcase of SPHERE detections. The image shows a very inclined disk. Here, the disk upper rim seems to almost occult the star (since the disk is almost seen edge-on), and the disk back side is almost as bright as the front side. Interestingly, the northern part of the image reveals an asymmetric arm that is intuitively interpreted as a verticall...
2013
-
[2022]
DoAr 28 was observed with HiCiao by Rich et al
revealing a very inclined disk that looks very similar in the SPHERE image. DoAr 28 was observed with HiCiao by Rich et al. (2015) who reported polarized emission from an inclined disk and from some asymmetric features. The SPHERE image reveals the same inclined disk but shows no obvious evidence of extended emission exterior to it. The SPHERE image of J1...
2015
discussion (0)
Sign in with ORCID, Apple, or X to comment. Anyone can read and Pith papers without signing in.