Unsupervised Anomaly Detection in Wearable Foot Sensor Data: A Baseline Feasibility Study Towards Diabetic Foot Ulcer Prevention
Pith reviewed 2026-05-15 18:44 UTC · model grok-4.3
The pith
Unsupervised anomaly detection on foot temperature and pressure data from healthy adults creates a validated baseline pipeline for future diabetic foot ulcer studies.
A machine-rendered reading of the paper's core claim, the machinery that carries it, and where it could break.
Core claim
The authors claim that applying Isolation Forest and KNN/LOF to 93,790 multi-sensor readings from 312 healthy-subject sessions successfully defines normal foot temperature and pressure patterns under a 5 percent contamination model, with Isolation Forest proving more sensitive to subtle anomalies and the overall framework providing a ready baseline for future studies that can directly link detected deviations to diabetic foot ulcer pathophysiology.
What carries the argument
Isolation Forest and Local Outlier Factor algorithms applied to paired temperature and pressure time-series data from wearable foot sensors under a fixed 5 percent contamination assumption.
If this is right
- Isolation Forest identifies subtle distributed anomalies more readily than KNN/LOF.
- KNN/LOF flags concentrated extreme deviations but labels a higher share of sessions as anomalous.
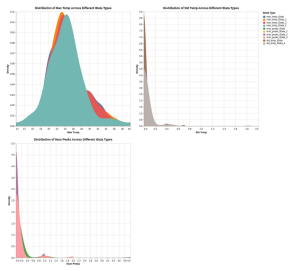
- A mild positive correlation of 0.41-0.48 between pressure and temperature features supports combined multi-modal monitoring.
- Differences between the algorithms reflect relative sensitivity under the shared contamination assumption rather than confirmed error rates.
- The pipeline is positioned as a methodological foundation ready for direct clinical validation in diabetic cohorts.
Where Pith is reading between the lines
- Longitudinal follow-up of patients wearing the same sensors could test whether baseline anomalies predict actual ulcer formation.
- The unsupervised baseline could later be paired with supervised classifiers once patient labels become available.
- Similar reference models built from healthy data might apply to other biomechanical or chronic-disease monitoring tasks.
- Varying the contamination rate to match known clinical prevalence could improve calibration for real-world deployment.
Load-bearing premise
Statistical outliers identified in healthy-subject data under a 5 percent contamination assumption will correspond to clinically relevant diabetic foot ulcer pathophysiology once the same methods are applied to patient measurements.
What would settle it
Collecting equivalent sensor data from diabetic patients with and without foot ulcers and checking whether the rate or type of detected anomalies correlates with clinical DFU indicators or ulcer incidence would directly test the claimed mapping.
Figures


read the original abstract
Diabetic foot ulcers (DFUs) are a severe complication of diabetes associated with significant morbidity, amputation risk, and healthcare burden. Developing effective continuous monitoring frameworks requires first establishing reliable baseline models of normal foot biomechanics. This paper presents a feasibility study of an anomaly detection framework applied to time-series data from wearable foot sensors, specifically NTC thin-film thermocouples for temperature and FlexiForce A401 pressure sensors for plantar load monitoring. Data were collected from healthy adult subjects across 312 capture sessions on an instrumented pathway, generating 93,790 valid multi-sensor readings spanning September 2023 to June 2024. Two unsupervised algorithms, Isolation Forest and K-Nearest Neighbors using Local Outlier Factor (KNN/LOF), were applied to detect statistical deviations in foot temperature and pressure signals. Results show that Isolation Forest is more sensitive to subtle, distributed anomalies, while KNN/LOF identifies concentrated extreme deviations but flags a higher proportion of sessions not corroborated by Isolation Forest. Since no clinical ground truth is available, this difference is interpreted as lower specificity under the shared 5 percent contamination assumption rather than a confirmed false-positive rate. A mild positive correlation (0.41-0.48) between pressure and temperature features supports the case for combined multi-modal monitoring. These findings establish a validated baseline analytical pipeline and provide a methodological foundation for future clinical validation studies involving diabetic patients, where the relationship between detected anomalies and DFU-related pathophysiology can be directly assessed.
Editorial analysis
A structured set of objections, weighed in public.
Referee Report
Summary. The paper presents a feasibility study applying unsupervised anomaly detection (Isolation Forest and KNN/LOF) to multi-modal wearable foot sensor data (NTC temperature and FlexiForce pressure) collected from 312 sessions of healthy adult subjects, yielding 93,790 readings. It reports algorithm-specific anomaly patterns under a fixed 5% contamination assumption, a mild positive correlation (0.41-0.48) between pressure and temperature features, and positions the work as an empirical baseline pipeline to support future clinical validation in diabetic patients for DFU prevention.
Significance. If the pipeline holds under clinical extension, the work supplies a large, well-described healthy-subject dataset and reproducible unsupervised methods that can serve as a methodological foundation for multi-modal DFU monitoring frameworks. The explicit scoping to baseline establishment (rather than clinical mapping) and acknowledgment of absent ground truth are strengths that make the contribution proportionate and useful for subsequent studies.
major comments (1)
- [Abstract] Abstract and Results: the post-hoc attribution of KNN/LOF's higher session-level disagreement to 'lower specificity' under the shared 5% contamination assumption is not quantitatively tested; a sensitivity sweep over contamination rates (or comparison against a supervised proxy) would be needed to support this interpretation as more than descriptive.
minor comments (3)
- [Methods] Methods: explicit values for Isolation Forest hyperparameters (n_estimators, max_samples) and LOF k-neighbor count should be stated so the pipeline is fully reproducible from the 93,790-reading dataset.
- [Results] Results: the reported correlation range (0.41-0.48) should be accompanied by a p-value or confidence interval and by the exact feature definitions (e.g., mean vs. peak pressure) used in the calculation.
- [Discussion] Discussion: the claim that the pipeline provides a 'validated baseline' could be rephrased to 'empirically characterized baseline' to avoid implying external validation that the healthy-subject design cannot supply.
Simulated Author's Rebuttal
We thank the referee for their constructive feedback and positive assessment of our feasibility study as a methodological baseline. We address the single major comment below and will revise the manuscript accordingly.
read point-by-point responses
-
Referee: [Abstract] Abstract and Results: the post-hoc attribution of KNN/LOF's higher session-level disagreement to 'lower specificity' under the shared 5% contamination assumption is not quantitatively tested; a sensitivity sweep over contamination rates (or comparison against a supervised proxy) would be needed to support this interpretation as more than descriptive.
Authors: We agree that the current interpretation of algorithm-specific disagreement would benefit from quantitative support. Because the study is unsupervised and lacks ground-truth labels, a supervised proxy is not feasible; however, we will add a sensitivity sweep over contamination rates (1%, 3%, 5%, 7%, 10%) for both Isolation Forest and KNN/LOF. The revised Results section will report how session-level anomaly flags and inter-algorithm disagreement change across these rates, allowing readers to evaluate the robustness of the specificity claim under varying assumptions. Corresponding updates will be made to the Abstract. revision: yes
Circularity Check
No significant circularity
full rationale
The paper is a purely empirical feasibility study that applies standard off-the-shelf unsupervised algorithms (Isolation Forest, KNN/LOF) to raw sensor time-series collected from healthy subjects. No equations, predictions, or derived quantities are defined in terms of themselves; the 5% contamination assumption is stated explicitly as an input rather than fitted from the target outputs, and the reported correlation (0.41-0.48) is a direct statistical summary of the processed features. Conclusions are scoped to establishing a baseline pipeline with explicit acknowledgment of absent ground truth, so no load-bearing step reduces to a self-citation, ansatz, or renaming of the input data.
Axiom & Free-Parameter Ledger
free parameters (1)
- contamination rate =
0.05
axioms (1)
- domain assumption Unsupervised statistical deviation detection on healthy data will identify patterns relevant to future diabetic pathology
Reference graph
Works this paper leans on
-
[1]
Carmine Gazzaruso, Pietro Gallotti, Arturo Pujia, Tiziana Montalcini, Andrea Giustina, and Adriana Coppola. Predictors of healing, ulcer re- currence and persistence, amputation and mortality in type 2 diabetic patients with diabetic foot: a 10-year retrospective cohort study.En- docrine, 71(1):59–68, 2021
work page 2021
-
[2]
Caitlin W Hicks, Joseph K Canner, Nestoras Mathioudakis, Christopher Lippincott, Ronald L Sherman, and Christopher J Abularrage. Incidence and risk factors associated with ulcer recurrence among patients with diabetic foot ulcers treated in a multidisciplinary setting.Journal of Surgical Research, 246:243–250, 2020
work page 2020
-
[3]
Paola C Aldana, Alexander M Cartron, and Amor Khachemoune. Reap- praising diabetic foot ulcers: a focus on mechanisms of ulceration and 31 clinical evaluation.The international journal of lower extremity wounds, 21(3):294–302, 2022
work page 2022
-
[4]
Lefan Wang, Dominic Jones, Graham J Chapman, Heidi J Siddle, David A Russell, Ali Alazmani, and Peter Culmer. A review of wearable sensor systems to monitor plantar loading in the assessment of diabetic foot ulcers.IEEE Transactions on Biomedical Engineering, 67(7):1989– 2004, 2019
work page 1989
-
[5]
Andrew JM Boulton, David G Armstrong, Robert S Kirsner, Christo- pher E Attinger, Lawrence A Lavery, Benjamin A Lipsky, Joseph L Mills Sr, and John S Steinberg. Diagnosis and management of diabetic foot complications.Diabetes Care, 41(Supplement 1):S145–S150, 2018
work page 2018
-
[6]
Ioulietta Lazarou, Vasiliki Fiska, Lampros Mpaltadoros, Dimitris Tsaopoulos, Thanos G Stavropoulos, Spiros Nikolopoulos, George E Dafoulas, Zoe Dailiana, Alexandra Bargiota, and Ioannis Kompatsiaris. Stepping forward: a scoping systematic literature review on the health outcomes of smart sensor technologies for diabetic foot ulcers.Sensors, 24(6):2009, 2024
work page 2009
-
[7]
M Kerr, E Barron, P Chadwick, Timothy Evans, WM Kong, G Rayman, M Sutton-Smith, G Todd, B Young, and WJ Jeffcoate. The cost of diabetic foot ulcers and amputations to the national health service in england.Diabetic Medicine, 36(8):995–1002, 2019. 32
work page 2019
-
[8]
Wound assessment, imaging and monitoring systems in diabetic foot ulcers: A systematic review
Kai Siang Chan and Zhiwen Joseph Lo. Wound assessment, imaging and monitoring systems in diabetic foot ulcers: A systematic review. International wound journal, 17(6):1909–1923, 2020
work page 1909
-
[9]
Michael R Hufford and Saul Shiffman. Assessment methods for patient- reported outcomes.Disease Management & Health Outcomes, 11(2):77– 86, 2003
work page 2003
-
[10]
Zhongqiang Zhu, Lu Wang, Yaou Peng, Xiaoying Chu, Liyang Zhou, Yingying Jin, Hanwen Guo, Qiang Gao, Jianhua Yang, Xinyi Wang, et al. Continuous self-oxygenated double-layered hydrogel under natural light for real-time infection monitoring, enhanced photodynamic ther- apy, and hypoxia relief in refractory diabetic wounds healing.Advanced Functional Materia...
work page 2022
-
[11]
Sara Nasiri and Mohammad Reza Khosravani. Progress and challenges in fabrication of wearable sensors for health monitoring.Sensors and Actuators A: Physical, 312:112105, 2020
work page 2020
-
[12]
Review on wearables to monitor foot temperature in diabetic patients.Sensors, 19(4):776, 2019
Jes´ us Mart´ ın-Vaquero, Ascensi´ on Hern´ andez Encinas, Araceli Queiruga- Dios, Juan Jos´ e Bull´ on, Alfonso Mart´ ınez-Nova, Jose Torre- blanca Gonz´ alez, and Cristina Bull´ on-Carbajo. Review on wearables to monitor foot temperature in diabetic patients.Sensors, 19(4):776, 2019. 33
work page 2019
-
[13]
Tiago M Fern´ andez-Caram´ es and Paula Fraga-Lamas. Towards the in- ternet of smart clothing: A review on iot wearables and garments for creating intelligent connected e-textiles.Electronics, 7(12):405, 2018
work page 2018
-
[14]
Huifang Guan, Ying Wang, Ping Niu, Yuxin Zhang, Yanjiao Zhang, Runyu Miao, Xinyi Fang, Ruiyang Yin, Shuang Zhao, Jun Liu, et al. The role of machine learning in advancing diabetic foot: a review.Frontiers in Endocrinology, 15:1325434, 2024
work page 2024
-
[15]
Lawrence A Lavery, Brian J Petersen, David R Linders, Jonathan D Bloom, Gary M Rothenberg, and David G Armstrong. Unilateral remote temperature monitoring to predict future ulceration for the diabetic foot in remission.BMJ Open Diabetes Research & Care, 7(1), 2019
work page 2019
-
[16]
Sicco A Bus, B Wouter, Jeff G van Baal, Tessa E Busch-Westbroek, Frans Nollet, and Jaap J van Netten. Effectiveness of at-home skin temperature monitoring in reducing the incidence of foot ulcer recur- rence in people with diabetes: a multicenter randomized controlled trial (diatemp).BMJ open diabetes research & care, 9(1), 2021
work page 2021
-
[17]
Biomechanics of the diabetic foot: the road to foot ulceration
Carine HM van Schie and Andrew JM Boulton. Biomechanics of the diabetic foot: the road to foot ulceration. InThe diabetic foot, pages 185–200. Springer, 2006
work page 2006
-
[18]
Galya Georgieva-Tsaneva, Krasimir Cheshmedzhiev, Yoan-Aleksandar Tsanev, and Miroslav Dechev. Physiological state recognition via hrv 34 and fractal analysis using ai and unsupervised clustering.Information, 16(9):718, 2025
work page 2025
-
[19]
An embedded wearable device for monitoring diabetic foot ulcer parameters
Vishwajit V Kulkarni, Fatjon Seraj, and Jansi Rani Rathikumar. An embedded wearable device for monitoring diabetic foot ulcer parameters. InProceedings of the 13th ACM International Conference on PErvasive Technologies Related to Assistive Environments, pages 1–7, 2020
work page 2020
-
[20]
Bijan Najafi and Ramkinker Mishra. Harnessing digital health technolo- gies to remotely manage diabetic foot syndrome: a narrative review. Medicina, 57(4):377, 2021
work page 2021
-
[21]
Xue Yang, Xuejun Qi, and Xiaobo Zhou. Deep learning technologies for time series anomaly detection in healthcare: A review.Ieee Access, 11:117788–117799, 2023
work page 2023
-
[22]
Hannah Wilson, Pinar Avsar, Natalie McEvoy, Sorcha Byrne, Giulio Brunetti, Declan Patton, and Zena Moore. Integrating technologies to enhance risk assessment for the early detection and prevention of pres- sure ulcers.Journal of Wound Care, 33(9):644–651, 2024
work page 2024
-
[23]
Alhanoof Althnian, Duaa AlSaeed, Heyam Al-Baity, Amani Samha, Alanoud Bin Dris, Najla Alzakari, Afnan Abou Elwafa, and Heba Kurdi. Impact of dataset size on classification performance: an empirical eval- uation in the medical domain.Applied sciences, 11(2):796, 2021. 35
work page 2021
-
[24]
Chioma Virginia Anikwe, Henry Friday Nweke, Anayo Chukwu Ikegwu, Chukwunonso Adolphus Egwuonwu, Fergus Uchenna Onu, Uzoma Rita Alo, and Ying Wah Teh. Mobile and wearable sensors for data-driven health monitoring system: State-of-the-art and future prospect.Expert Systems with Applications, 202:117362, 2022
work page 2022
-
[25]
Jianglin Zhang, Yue Qiu, Li Peng, Qiuhong Zhou, Zheng Wang, and Min Qi. A comprehensive review of methods based on deep learning for diabetes-related foot ulcers.Frontiers in Endocrinology, 13:945020, 2022
work page 2022
-
[26]
Elisabetta Spinazzola, Guillaume Picaud, Sara Becchi, Monica Pittarello, Elia Ricci, Marc Chaumont, G´ erard Subsol, Fabio Pareschi, Luc Teot, and Jacopo Secco. Chronic ulcers healing prediction through machine learning approaches: Preliminary results on diabetic foot ulcers case study.Journal of Clinical Medicine, 14(9):2943, 2025
work page 2025
-
[27]
¨Ozg¨ ur Y¨ ur¨ ur, Chi Harold Liu, Zhengguo Sheng, Victor CM Leung, Wil- frido Moreno, and Kin K Leung. Context-awareness for mobile sensing: A survey and future directions.IEEE Communications Surveys & Tu- torials, 18(1):68–93, 2014
work page 2014
-
[28]
Iot based wearable smart insole
Jochen Wilden, Asti Chandrakar, Atul Ashok, and Neeli Prasad. Iot based wearable smart insole. In2017 Global Wireless Summit (GWS), pages 186–192. IEEE, 2017. 36
work page 2017
discussion (0)
Sign in with ORCID, Apple, or X to comment. Anyone can read and Pith papers without signing in.