Recognition: no theorem link
Automatic search for transiting planets in TESS-SPOC FFIs with RAVEN: over 100 newly validated planets and over 2000 vetted candidates
Pith reviewed 2026-05-15 00:16 UTC · model grok-4.3
The pith
RAVEN pipeline validates 118 TESS planets including 31 new detections and flags over 2000 high-probability candidates
A machine-rendered reading of the paper's core claim, the machinery that carries it, and where it could break.
Core claim
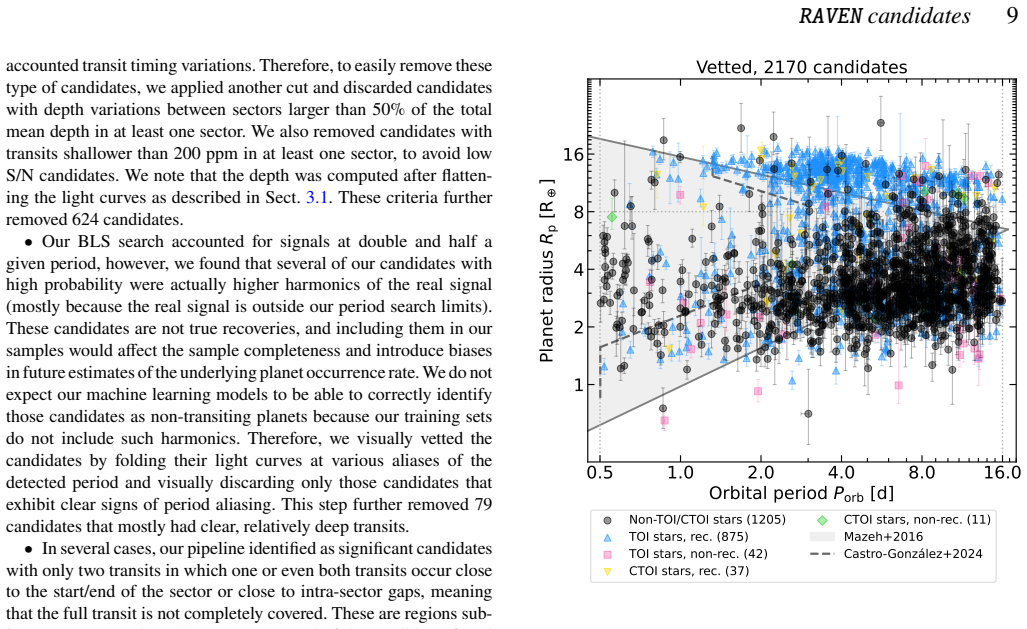
We use the new pipeline RAVEN to perform a uniform search and validation of transiting planet candidates in TESS data focused on periods between 0.5 and 16 days. RAVEN detects candidates with a box least squares algorithm, classifies them into transiting planets and false positives using machine learning models trained with realistic simulations, and performs statistical validation. We newly validate 118 planets, including 31 newly detected here, and present a sample of over 2000 candidates not validated but with high probability of being planets, including approximately 1000 new candidates, along with mono- and duo-transiting candidates and large-radius objects suited for follow-up.
What carries the argument
RAVEN, an automated pipeline that detects transit signals with box-least-squares, classifies them via machine-learning models trained on realistic simulations, and applies statistical validation to separate planets from false positives in TESS full-frame images.
If this is right
- The 118 validated planets enlarge the sample of short-period transiting worlds around well-characterized main-sequence stars.
- The ~2000 high-probability candidates, roughly half newly identified, supply immediate targets for ground-based follow-up to confirm or refute their planetary nature.
- The small set of newly identified mono- and duo-transiting candidates enables study of longer-period planets with limited transit coverage.
- The subsample of large-radius candidates (>8 Earth radii) with high planet probability is positioned for atmospheric or other detailed characterization.
- The uniform, magnitude-limited catalog improves completeness for statistical studies of planet occurrence rates in the TESS short-period regime.
Where Pith is reading between the lines
- If the simulation-trained classifiers generalize reliably, the same approach could be scaled to future missions with larger data volumes to maintain candidate vetting speed.
- Combining the vetted candidates with existing or future radial-velocity surveys could yield mass measurements and densities for a substantial fraction of the sample.
- The Gaia-characterized stellar sample opens the possibility of measuring planet occurrence as a function of stellar mass, metallicity, or age once the candidates are confirmed.
- The ~1000 new candidates may help constrain the occurrence rate of planets in the 0.5-16 day period range once contamination is fully assessed.
Load-bearing premise
The machine learning classifiers trained on realistic simulations correctly distinguish planets from false positives in real TESS data, and the statistical validation thresholds reliably identify true planets without significant contamination.
What would settle it
Independent follow-up observations, such as radial-velocity monitoring or high-resolution imaging, that show more than a few percent of the 118 validated planets are actually eclipsing binaries or other false positives would falsify the reliability of the validation thresholds.
Figures


read the original abstract
Space-based missions such as TESS are identifying a wealth of short-period ($\lesssim30$ d) transiting planets. Despite the growing number of confirmed and candidate planets, the sample is still incomplete and highly biased, challenging demographic studies. Moreover, there are still a large number of unconfirmed candidates that can end up being false positives. We use the new pipeline RAVEN to perform a uniform search and validation of transiting planet candidates in TESS data. We focus on a magnitude-limited sample of over 2.2 million main sequence stars well characterised by Gaia and observed by TESS in its Full Frame Images during its first 4 years of operations (sectors 1 to 55). We aim to detect candidates with periods within $0.5-16$ days. RAVEN detects candidates with a box least squares algorithm, classifies them into transiting planets and false positives using machine learning models trained with realistic simulations, and performs statistical validation. We present several samples of candidates with different levels of vetting and validation. We newly validate 118 planets, including 31 newly detected here. We also present a sample of over 2000 candidates not validated but with high probability of being planets, including $\sim1000$ new candidates, a small sample of newly identified mono- and duo-transiting candidates, and a sample of large radii ($>8~\mathrm{R_{\oplus}}$) candidates with high planet probability suited for further follow-up. Our samples of vetted and validated transiting planet candidates represent a major effort towards improving the candidate sample from TESS.
Editorial analysis
A structured set of objections, weighed in public.
Referee Report
Summary. The paper introduces the RAVEN pipeline to perform a uniform search for short-period (0.5-16 d) transiting planet candidates in TESS-SPOC FFIs across sectors 1-55 for a magnitude-limited sample of >2.2 million main-sequence stars characterized by Gaia. It employs BLS detection, ML classifiers trained on realistic simulations to separate planets from false positives, and statistical validation, resulting in 118 newly validated planets (31 newly detected here) plus >2000 high-probability candidates including ~1000 new ones, along with samples of mono-/duo-transit and large-radius objects.
Significance. If the ML generalization and validation thresholds hold, the work would deliver a substantial, uniformly vetted catalog expansion for TESS short-period planets, directly supporting demographic studies and follow-up prioritization; the scale of the search and inclusion of mono-transit candidates represent clear strengths.
major comments (2)
- [Methods] Methods (ML classification subsection): No quantitative transfer-performance metrics are reported for the simulation-trained classifiers on real TESS data, such as precision-recall curves, confusion matrices, or recovery statistics on a hold-out set of known TESS planets; this is load-bearing for the central claim of 118 validated planets and >2000 candidates because any unmodeled FFI systematics could inflate contamination.
- [Results] Results (validation and candidate samples): The paper provides no explicit injection-recovery tests performed on actual TESS light curves to confirm simulation realism, nor tables detailing the planet-probability thresholds or false-positive rejection rates that underpin the 118 validated planets; without these the exact counts cannot be independently assessed.
minor comments (2)
- [Results] Figure captions and text should clarify the exact definition of 'high probability' used for the >2000-candidate sample and how it differs from the validated set.
- [Abstract] The abstract and methods would benefit from a brief statement on the total number of candidates initially detected before ML filtering to contextualize the final yields.
Simulated Author's Rebuttal
We thank the referee for their constructive review and recommendation of major revision. We address each major comment below and have incorporated revisions to provide the requested quantitative metrics and tests, which we agree strengthen the manuscript's claims regarding classifier performance and sample validation.
read point-by-point responses
-
Referee: [Methods] Methods (ML classification subsection): No quantitative transfer-performance metrics are reported for the simulation-trained classifiers on real TESS data, such as precision-recall curves, confusion matrices, or recovery statistics on a hold-out set of known TESS planets; this is load-bearing for the central claim of 118 validated planets and >2000 candidates because any unmodeled FFI systematics could inflate contamination.
Authors: We agree that explicit transfer metrics on real TESS data would increase confidence in the ML classifiers. Our simulations incorporated realistic TESS FFI noise models and systematics, but we acknowledge the value of direct validation. In the revised manuscript we have added precision-recall curves, confusion matrices, and recovery statistics evaluated on a hold-out set of known TESS planets to quantify performance on actual data and address potential unmodeled systematics. revision: yes
-
Referee: [Results] Results (validation and candidate samples): The paper provides no explicit injection-recovery tests performed on actual TESS light curves to confirm simulation realism, nor tables detailing the planet-probability thresholds or false-positive rejection rates that underpin the 118 validated planets; without these the exact counts cannot be independently assessed.
Authors: We accept that injection-recovery tests on real light curves and explicit threshold tables are necessary for independent assessment. The revised manuscript now includes injection-recovery experiments performed directly on TESS light curves to validate simulation realism, along with a new table that reports the planet-probability thresholds, false-positive rejection rates, and the resulting sample sizes for the 118 validated planets. revision: yes
Circularity Check
No significant circularity: results follow from direct application of BLS + simulation-trained ML + statistical validation to external TESS photometry
full rationale
The paper's chain is: run BLS on TESS FFIs for 2.2M stars, classify candidates with ML models trained on independent realistic simulations, then apply statistical validation thresholds. No equation or threshold is defined in terms of the output planet sample itself, no fitted parameter is relabeled as a prediction, and no uniqueness theorem or ansatz is smuggled via self-citation. The central counts (118 validated planets, >2000 high-probability candidates) are direct outputs of processing real data with a pre-trained external model. This matches the expected non-circular case; any generalization risk from simulations to real systematics is a correctness concern, not a circularity reduction.
Axiom & Free-Parameter Ledger
axioms (2)
- domain assumption Simulations used to train the machine learning models accurately capture the distribution of false positives and noise properties in real TESS-SPOC FFIs.
- domain assumption The statistical validation framework correctly assigns planet probabilities without significant systematic bias from unmodeled false-positive channels.
Reference graph
Works this paper leans on
-
[1]
AkesonR.,ChristiansenJ.,2019,inAmericanAstronomicalSocietyMeeting Abstracts #233. p. 140.09 Andrae R., et al., 2018, A&A, 616, A8 Ansdell M., et al., 2018, ApJL, 869, L7 Armstrong D. J., Pollacco D., Santerne A., 2017, MNRAS, 465, 2634 Armstrong D. J., et al., 2020, Nature, 583, 39 Armstrong D. J., Gamper J., Damoulas T., 2021, MNRAS, 504, 5327 Astropy Co...
-
[2]
258617228 1 2467.036849 0.957866 0.963600 42 Single transit in sector 42 (FFI, QLP). Further observed in sectors 56 (FFI, QLP) and 83 (QLP).TheQLPdataofsector56showsatransitofsimilardepth∼368dafter,butitfalls on a data gap of the FFI data. Possible partial transit also seen in QLP sector 83,∼736d after the one in sector 56 (i.e. double the time gap betwee...
-
[3]
The light curves of sectors 12 and 39 clearly show an inner, smaller candidate
3834828131.7480688 +0.0000054 −0.0000056 1629.4858+0.0016 −0.0016 5.13+0.33 −0.32 ThisstarhasaPCCTOIreportedinMontalto(2023)with𝑃≃2.01dand𝑅 p ≃15.06 R ⊕ (with a high impact parameter,𝑏∼0.9), which we recover in the first BLS peak and is in our vetted sample. The light curves of sectors 12 and 39 clearly show an inner, smaller candidate. This candidate is ...
-
[4]
Further data from sector 70 only show transits of the known TOI
Sector 42 shows a clear single transit of an extra candidate. Further data from sector 70 only show transits of the known TOI. 364561528 This star has a CTOI reported by Salinas et al. (2025) with𝑃≃12.76d and𝑅p ≃9.67 R ⊕ that we recover in our vetted sample from sectors 15, 16, and
work page 2025
- [5]
- [6]
- [7]
- [8]
- [9]
- [10]
- [11]
-
[12]
0.04 0.02 0.00 0.02 0.04 0.995 1.000 1.005 P=3.5216 d, t0=1404.3825 TBJD, tdur=1.737 h, Rp=2.591 R Sectors: 3, 29, 30 TIC 67686059 b (BLS peak
work page internal anchor Pith review Pith/arXiv arXiv
- [13]
- [14]
- [15]
- [16]
-
[17]
30 min Data - GP model 10 min Data - GP model Binned data - GP model Transit model Figure C1.Phase-folded light curves of all 31 new validated candidates first identified in this work. Grey circles and purple diamonds show the PDCSAP data from the 10- and 30-minute sectors, respectively, detrended by the GP model and phase-folded to the𝑃orb and𝑡 0 from th...
- [18]
- [19]
- [20]
- [21]
- [22]
- [23]
- [24]
- [25]
- [26]
- [27]
- [28]
-
[29]
•TIC 73232401 BLS peak 2: This star has a CTOI, TIC 73232401.01, identified in Salinas et al
30 min Data - GP model 10 min Data - GP model Binned data - GP model Transit model Figure C1–continued that only some of the transit are recovered, making this candidate a complex harmonic of the true signal. •TIC 73232401 BLS peak 2: This star has a CTOI, TIC 73232401.01, identified in Salinas et al. (2025), with𝑃≃ 11.02d, which we recover in the first p...
- [30]
- [31]
- [32]
- [33]
- [34]
- [35]
-
[36]
30 min Data - GP model 10 min Data - GP model Binned data - GP model Transit model Figure C1–continued recoverstwotimestheTOIperiod.ThetrueTOIperiodisnotinany BLS peak, because it was probably removed during the BLS peak selection process. •TIC 95337971 BLS peak 2, 3, and 4: This star has a PC, TOI- 5139.01, with𝑃≃5.95d that we recover in the first BLS pe...
work page 2025
-
[37]
It is unclear which one is the true period
The QLP reduction suffers from the same data gap problem. It is unclear which one is the true period. •TIC 138126035 BLS peak 1: This star has a PC, TOI-2321.01 withverylongperiod,𝑃≃716.35d,firstidentifiedasasingletransit byPlanetHuntersTESSEisneretal.(2021)andisnowaduo-transit. We recover a candidate with𝑃≃12.57d in the first BLS peak. The recovered tran...
work page 2021
-
[38]
match those in the archive and are separated separatedbythereportedperiod,whichisamultipleofourrecovered period of𝑃≃12.6d. •TIC 142589416 BLS peak 2 (TIC 142589416.02): This star has a CTOI, TIC 142589416.01, identified in Montalto (2023), with 𝑃≃2.10d, that we recover in the first BLS peak and is in our validated sample. In our vetted sample is BLS peak ...
-
[39]
A visual inspection of the light curves of sectors 22 and 49 used here show transits matching the BLS period of≃6.70d, which if true make this candidate actually correctly recovered. •TIC294394558BLSpeak2(TOI-6484.02):ThisstarhasaPC, TOI-6484.01,with𝑃≃18.25d,outsideofoursearchrange.Wefind acandidateinthesecondBLSpeakwith𝑃≃10.90d,whichisclose to5/3times th...
work page 2025
discussion (0)
Sign in with ORCID, Apple, or X to comment. Anyone can read and Pith papers without signing in.