Recognition: 1 theorem link
· Lean TheoremThe NANOGrav 15 yr and 20 yr Datasets: Timing Events and Pulse Shape Changes
Pith reviewed 2026-05-10 19:57 UTC · model grok-4.3
The pith
All three timing events in PSR J1713+0747 arise from changes in pulse shape.
A machine-rendered reading of the paper's core claim, the machinery that carries it, and where it could break.
Core claim
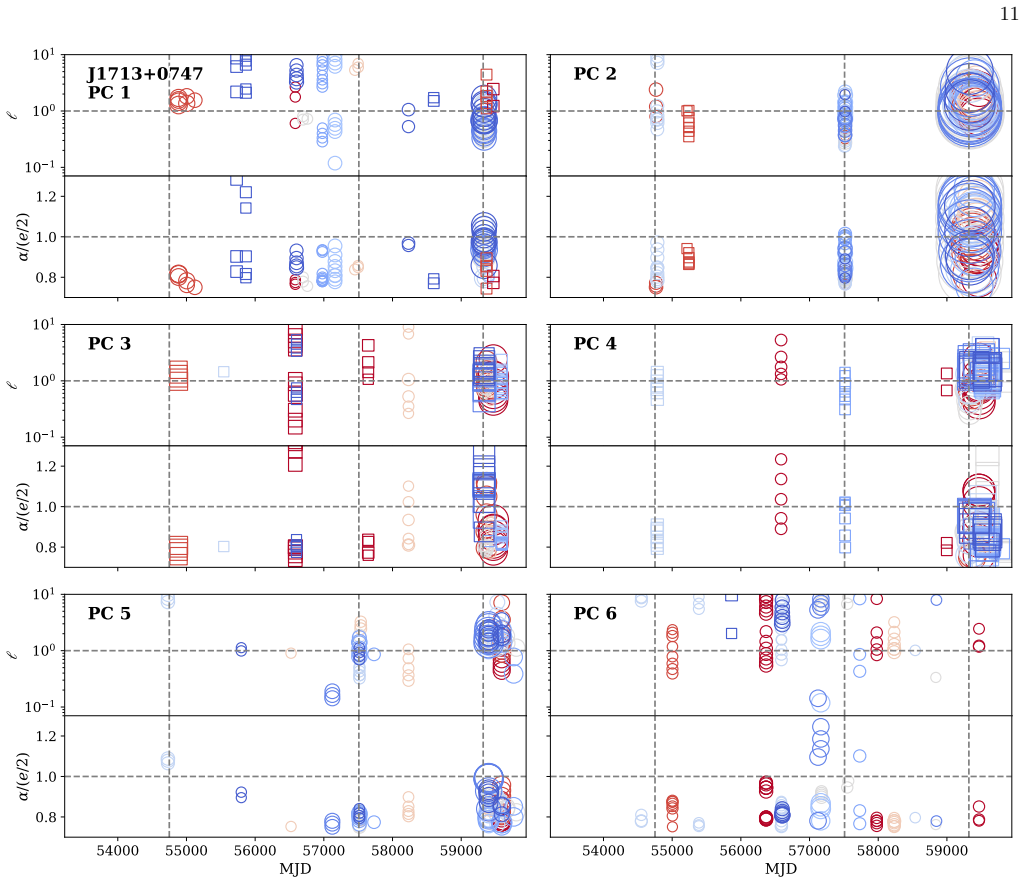
All three discrete timing events in PSR J1713+0747 correspond to morphological changes in pulse shape, recovered via PCA along with known events in other pulsars and four highly ranked candidate events.
What carries the argument
Principal component analysis of pulse profiles to isolate and rank morphological variations tied to timing residuals.
If this is right
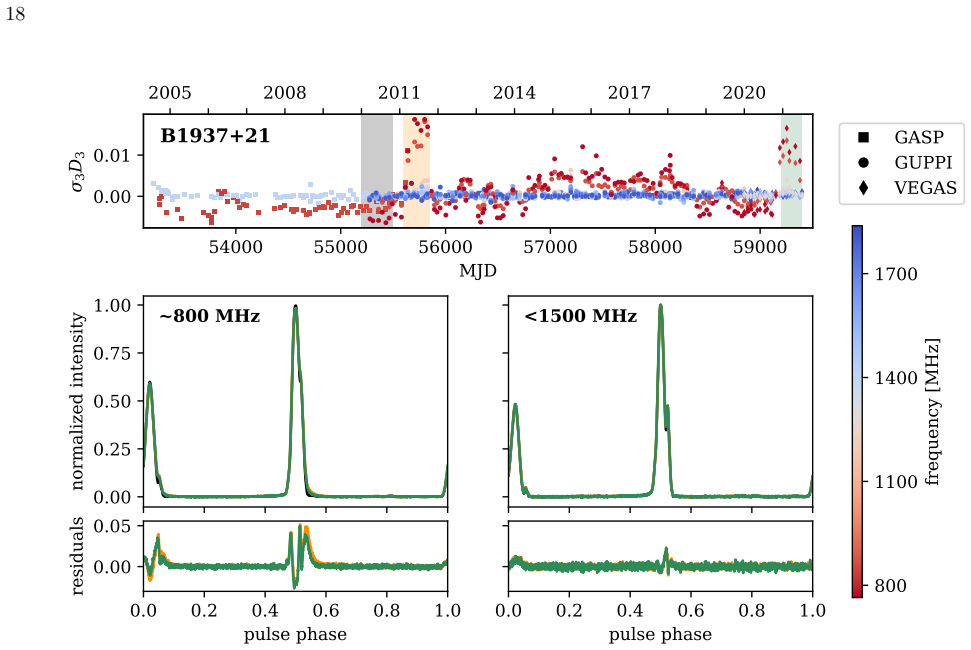
- Slow pulse shape variations are confirmed and tracked in PSR J1643-1224, PSR J1903+0327, and PSR B1937+21.
- An unexpected recurrence of a slow variation occurs after roughly 10 years in PSR B1937+21.
- Four additional highly ranked candidate events are identified for further study in the nine-pulsar sample.
- Accounting for these changes can refine timing models used in pulsar timing arrays.
Where Pith is reading between the lines
- Routine PCA monitoring of pulse profiles could become a standard step in processing pulsar timing data to reduce systematic errors.
- If profile changes prove recurrent, they may follow patterns that allow predictive corrections across multiple pulsars.
- Extending the analysis to the full 20-year dataset for more sources would test whether such events are common enough to affect gravitational-wave searches.
Load-bearing premise
The principal components extracted by PCA capture the actual pulse shape changes responsible for the timing events rather than noise or calibration effects.
What would settle it
Subtracting the timing offsets predicted by the top principal components from the observed residuals for PSR J1713+0747 and checking whether the three discrete events disappear while the overall timing precision improves.
Figures


read the original abstract
The average pulse shape of a pulsar is typically stable over decadal timescales, enabling estimation of pulse times of arrival to better than a small fraction of the pulse width using matched filtering techniques. However, in North American Nanohertz Observatory for Gravitational Waves (NANOGrav) observations of PSR J1713+0747, three discrete timing events that depart from the prevailing timing model have been seen in the last 20 yr. All three correspond to morphological changes in pulse shape. Using principal component analysis, we analyze the pulse profiles of nine NANOGrav pulsars, including seven with profiles from the 15 yr dataset and two with additional profiles from the forthcoming 20 yr dataset. We recover the three known pulse shape change events in PSR J1713+0747 and another previously known event in PSR J1643$-$1224. We implement a ranking metric for candidate events and address four highly ranked candidates in this nine-pulsar sample. We also recover known slow pulse shape variations in PSR J1643$-$1224, PSR J1903+0327, and PSR B1937+21 and report an unexpected recurrence after ~10 yr of one such variation in PSR B1937+21.
Editorial analysis
A structured set of objections, weighed in public.
Referee Report
Summary. This manuscript applies principal component analysis (PCA) to pulse profiles from nine NANOGrav pulsars using the 15 yr and 20 yr datasets. It recovers three previously reported discrete timing events in PSR J1713+0747 (all linked to pulse shape changes) and one known event in PSR J1643-1224, implements a ranking metric to identify four additional candidate events, and reports recovery of known slow profile variations in several pulsars plus an unexpected recurrence after ~10 yr in PSR B1937+21.
Significance. Recovery of multiple known events provides internal validation for the PCA approach on public timing data. If the new candidates and recurrence hold under further scrutiny, the work would strengthen understanding of profile variability as a source of timing noise, with direct relevance to improving pulsar timing array sensitivity for nanohertz gravitational waves. The observational nature and use of standard PCA are strengths.
major comments (3)
- [PCA analysis and ranking metric sections] The central claim that timing events arise from morphological changes recovered as leading principal components requires that PCA isolates astrophysical profile variations rather than epoch-dependent calibration residuals or noise. The manuscript should include explicit null tests (e.g., phase-randomized profiles or calibration-only simulations) to quantify the false-positive rate of the ranking metric, particularly for the four new candidates; without them, alignment between timing residuals and PC amplitudes could reflect shared systematics.
- [Methods and results for candidate ranking] The ranking metric for candidate selection and the number of principal components retained are free parameters. The paper should report sensitivity tests showing how the identification of the four highly ranked candidates and the recurrence in PSR B1937+21 changes with variations in these choices, including quantitative thresholds and error bars on event significance.
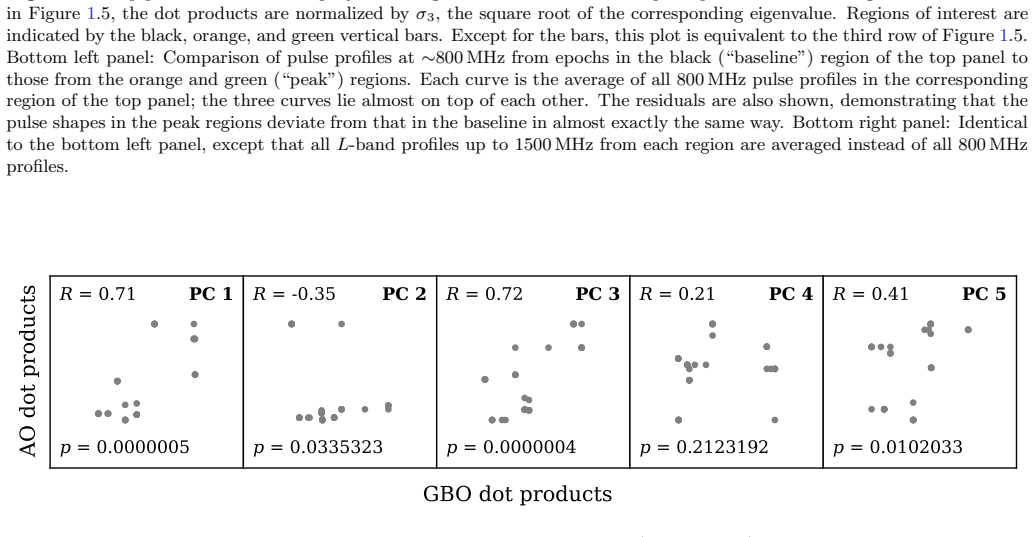
- [Results for J1713+0747 and J1643-1224] For the recovered events in J1713+0747 and J1643-1224, the manuscript should provide explicit statistical measures (e.g., correlation coefficients between PC amplitudes and timing event epochs or p-values) demonstrating that the correspondence exceeds what would be expected from random alignment, beyond the qualitative recovery statement.
minor comments (2)
- [Abstract] The abstract would benefit from brief mention of the statistical thresholds or controls used in the ranking metric to allow readers to assess the strength of the new candidate claims.
- [Figures] Figure captions should clarify the exact definition of the ranking metric and any normalization applied to PC amplitudes for reproducibility.
Simulated Author's Rebuttal
We thank the referee for their careful reading and constructive comments on our manuscript. We address each major comment in turn below and will revise the manuscript to incorporate the suggested improvements.
read point-by-point responses
-
Referee: [PCA analysis and ranking metric sections] The central claim that timing events arise from morphological changes recovered as leading principal components requires that PCA isolates astrophysical profile variations rather than epoch-dependent calibration residuals or noise. The manuscript should include explicit null tests (e.g., phase-randomized profiles or calibration-only simulations) to quantify the false-positive rate of the ranking metric, particularly for the four new candidates; without them, alignment between timing residuals and PC amplitudes could reflect shared systematics.
Authors: We agree that explicit null tests are needed to demonstrate that the leading principal components and the ranking metric primarily capture astrophysical profile variations rather than shared systematics. Although the successful recovery of multiple previously reported events provides supporting evidence for the approach, we will add null tests using phase-randomized profiles and calibration-only simulations. These will be used to estimate the false-positive rate of the ranking metric, with particular attention to the four new candidate events. The revised manuscript will include these results. revision: yes
-
Referee: [Methods and results for candidate ranking] The ranking metric for candidate selection and the number of principal components retained are free parameters. The paper should report sensitivity tests showing how the identification of the four highly ranked candidates and the recurrence in PSR B1937+21 changes with variations in these choices, including quantitative thresholds and error bars on event significance.
Authors: We acknowledge that both the number of retained principal components and the details of the ranking metric are choices that require justification. In the revision we will conduct and report sensitivity tests that vary the number of principal components and the quantitative thresholds used in the ranking metric. These tests will show the stability of the four highly ranked candidates and the reported recurrence in PSR B1937+21, and will include error bars or confidence intervals on the significance of each event. revision: yes
-
Referee: [Results for J1713+0747 and J1643-1224] For the recovered events in J1713+0747 and J1643-1224, the manuscript should provide explicit statistical measures (e.g., correlation coefficients between PC amplitudes and timing event epochs or p-values) demonstrating that the correspondence exceeds what would be expected from random alignment, beyond the qualitative recovery statement.
Authors: The current manuscript presents the recovery of the known events in J1713+0747 and J1643-1224 as qualitative validation of the PCA method. We agree that quantitative statistical measures would make the correspondence more rigorous. In the revised version we will compute and report correlation coefficients between the relevant PC amplitudes and the timing residuals (or event epochs), together with p-values that quantify the probability of obtaining such alignments by chance. revision: yes
Circularity Check
No significant circularity in observational PCA analysis of pulsar profiles
full rationale
The paper applies standard principal component analysis to observational pulse profile data from NANOGrav timing datasets to recover known morphological changes and rank candidate events. No mathematical derivation, first-principles prediction, or parameter fitting is presented that reduces by construction to the input data or self-referential definitions. Known events are recovered empirically, and the ranking metric operates on PCA outputs without equating predictions to fitted inputs. The analysis is self-contained against external benchmarks of documented pulsar events and does not rely on load-bearing self-citations or imported uniqueness theorems.
Axiom & Free-Parameter Ledger
free parameters (2)
- Number of principal components retained
- Ranking metric thresholds for candidate selection
axioms (2)
- domain assumption Pulse profile variations can be adequately represented by linear principal components
- domain assumption Discrete timing events arise from or coincide with pulse shape morphology changes
Reference graph
Works this paper leans on
-
[1]
Agazie, G., Alam, M. F., Anumarlapudi, A., et al. 2023, ApJL, 951, L9, doi: 10.3847/2041-8213/acda9a
-
[2]
Agazie, G., Anumarlapudi, A., Archibald, A. M., et al. 2025, ApJ, 978, 168, doi: 10.3847/1538-4357/ad93aa
-
[3]
Alam, M. F., Arzoumanian, Z., Baker, P. T., et al. 2021, ApJS, 252, 4, doi: 10.3847/1538-4365/abc6a0
-
[4]
Goss, W. M. 1982, Nature, 300, 615, doi: 10.1038/300615a0
-
[5]
Bartel, N., Morris, D., Sieber, W., & Hankins, T. H. 1982, ApJ, 258, 776, doi: 10.1086/160125
-
[6]
R., Karastergiou, A., McLaughlin, M
Brook, P. R., Karastergiou, A., McLaughlin, M. A., et al. 2018, ApJ, 868, 122, doi: 10.3847/1538-4357/aae9e3
-
[7]
2020, in American Astronomical Society Meeting Abstracts, Vol
Bulatek, A., & White, S. 2020, in American Astronomical Society Meeting Abstracts, Vol. 235, American Astronomical Society Meeting Abstracts #235, 175.17
work page 2020
-
[8]
Comaniciu, D., & Meer, P. 2002, IEEE Transactions on Pattern Analysis and Machine Intelligence, 24, 603, doi: 10.1109/34.1000236
-
[9]
Cordes, J. M. 2013, ApJ, 775, 47, doi: 10.1088/0004-637X/775/1/47
-
[10]
Cordes, J. M., & Lazio, T. J. 1991, ApJ, 376, 123, doi: 10.1086/170261
-
[11]
Demorest, P. B. 2007, Phd thesis, Univ. California, Berkeley
work page 2007
-
[12]
Demorest, P. B., Ferdman, R. D., Gonzalez, M. E., et al. 2013, ApJ, 762, 94, doi: 10.1088/0004-637X/762/2/94
-
[13]
1979, ApJ, 234, 1100, doi: 10.1086/157593
Detweiler, S. 1979, ApJ, 234, 1100, doi: 10.1086/157593
-
[14]
Dey, L., McLaughlin, M. A., Wahl, H. M., et al. 2024, ApJ, 977, 114, doi: 10.3847/1538-4357/ad8c24
-
[15]
2008, in Society of Photo-Optical Instrumentation Engineers (SPIE) Conference Series, Vol
DuPlain, R., Ransom, S., Demorest, P., et al. 2008, in Society of Photo-Optical Instrumentation Engineers (SPIE) Conference Series, Vol. 7019, Advanced Software and Control for Astronomy II, ed. A. Bridger & N. M. Radziwill, 70191D, doi: 10.1117/12.790003
-
[16]
Fiore, W., McLaughlin, M. A., Agazie, G., et al. 2025, ApJ, 984, 139, doi: 10.3847/1538-4357/adc255
-
[17]
Geiger, A., Cordes, J. M., Lam, M. T., et al. 2025, ApJ, 986, 191, doi: 10.3847/1538-4357/add0b6
-
[18]
Gentile, P. A., McLaughlin, M. A., Demorest, P. B., et al. 2018, ApJ, 862, 47, doi: 10.3847/1538-4357/aac9c9
-
[19]
Goncharov, B., Reardon, D. J., Shannon, R. M., et al. 2021, MNRAS, 502, 478, doi: 10.1093/mnras/staa3411
-
[20]
2001, PASP, 113, 1274, doi: 10.1086/323289
Heiles, C., Perillat, P., Nolan, M., et al. 2001, PASP, 113, 1274, doi: 10.1086/323289
-
[21]
Hellings, R. W., & Downs, G. S. 1983, ApJL, 265, L39, doi: 10.1086/183954
-
[22]
Jennings, R. J., Cordes, J. M., & Chatterjee, S. 2024a, arXiv e-prints, arXiv:2411.00236, doi: 10.48550/arXiv.2411.00236
-
[23]
Jennings, R. J., Cordes, J. M., Chatterjee, S., et al. 2024b, ApJ, 964, 179, doi: 10.3847/1538-4357/ad2930
-
[24]
Keith, M. J., Spiewak, R., Lyne, A. G., et al. 2025, MNRAS, 540, 2486, doi: 10.1093/mnras/staf886
-
[25]
Lorimer, D. R. 2006, Science, 312, 549, doi: 10.1126/science.1124060
-
[26]
Lam, M. T. 2017,, Astrophysics Source Code Library, record ascl:1706.011
work page 2017
-
[27]
Lam, M. T., Ellis, J. A., Grillo, G., et al. 2018, ApJ, 861, 132, doi: 10.3847/1538-4357/aac770
-
[28]
X., Lin, H.-H., Luo, J., et al
Lin, F. X., Lin, H.-H., Luo, J., et al. 2021, MNRAS, 508, 1115, doi: 10.1093/mnras/stab2529
-
[29]
Lin, H.-H., Masui, K., Pen, U.-L., & Peterson, J. B. 2018, MNRAS, 475, 1323, doi: 10.1093/mnras/stx3239
-
[30]
Lomb, N. R. 1976, Ap&SS, 39, 447, doi: 10.1007/BF00648343
-
[31]
2023, in American Astronomical Society Meeting Abstracts, Vol
Lynch, R., White, S., Simon, B., et al. 2023, in American Astronomical Society Meeting Abstracts, Vol. 241, American Astronomical Society Meeting Abstracts #241, 101.04
work page 2023
-
[32]
2010, Science, 329, 408, doi: 10.1126/science.1186683 27
Lyne, A., Hobbs, G., Kramer, M., Stairs, I., & Stappers, B. 2010, Science, 329, 408, doi: 10.1126/science.1186683 27
-
[33]
2003, ApJ, 582, 972, doi: 10.1086/344816
Maitia, V., Lestrade, J.-F., & Cognard, I. 2003, ApJ, 582, 972, doi: 10.1086/344816
- [34]
-
[35]
2024, ApJ, 974, 10, doi: 10.3847/1538-4357/ad6a51
Ocker, S. K., Anderson, L. D., Lazio, T. J. W., Cordes, J. M., & Ravi, V. 2024, ApJ, 974, 10, doi: 10.3847/1538-4357/ad6a51
-
[36]
2011, Journal of Machine Learning Research, 12, 2825
Pedregosa, F., Varoquaux, G., Gramfort, A., et al. 2011, Journal of Machine Learning Research, 12, 2825
work page 2011
-
[37]
Pennucci, T. T. 2019, ApJ, 871, 34, doi: 10.3847/1538-4357/aaf6ef
-
[38]
Pennucci, T. T., Demorest, P. B., & Ransom, S. M. 2016,, Astrophysics Source Code Library, record ascl:1606.013 http://ascl.net/1606.013
work page 2016
-
[39]
Sazhin, M. V. 1978, Soviet Ast., 22, 36
work page 1978
-
[40]
Scargle, J. D. 1982, ApJ, 263, 835, doi: 10.1086/160554
-
[41]
Shannon, R. M., Cordes, J. M., Metcalfe, T. S., et al. 2013, ApJ, 766, 5, doi: 10.1088/0004-637X/766/1/5
-
[42]
Shannon, R. M., Lentati, L. T., Kerr, M., et al. 2016, ApJL, 828, L1, doi: 10.3847/2041-8205/828/1/L1
-
[43]
Taylor, J. H. 1992, Philosophical Transactions of the Royal Society of London Series A, 341, 117, doi: 10.1098/rsta.1992.0088 The NANOGrav Collaboration. 2025,, 2.1.0 Zenodo, doi: 10.5281/zenodo.16051178 van Straten, W. 2004, ApJS, 152, 129, doi: 10.1086/383187
-
[44]
Wahl, H. M., McLaughlin, M. A., Gentile, P. A., et al. 2022, ApJ, 926, 168, doi: 10.3847/1538-4357/ac4045
-
[45]
Xu, H., Huang, Y. X., Burgay, M., et al. 2021, The Astronomer’s Telegram, 14642, 1
work page 2021
-
[46]
You, X. P., Coles, W. A., Hobbs, G. B., & Manchester, R. N. 2012, MNRAS, 422, 1160, doi: 10.1111/j.1365-2966.2012.20688.x
discussion (0)
Sign in with ORCID, Apple, or X to comment. Anyone can read and Pith papers without signing in.