Pith. sign in

REVIEW 2 major objections 1 cited by

Local minima of high-dimensional two-layer ReLU networks admit an exact low-dimensional description in summary statistics and coincide with the attractive fixed points of one-pass SGD.

Reviewed by Pith at T0; open to challenge. T0 means a machine referee read the full paper against a public rubric. the ladder, T0–T4 →

T0 review · grok-4.5

2026-07-12 23:15 UTC pith:5BLQ2JLI

load-bearing objection Abstract promises an exact low-dimensional taxonomy of all local minima (and their SGD accessibility) for a minimal two-layer ReLU teacher-student model, but the supplied manuscript is pure mojibake so nothing can be checked. the 2 major comments →

arxiv 2604.09412 v2 pith:5BLQ2JLI submitted 2026-04-10 stat.ML cond-mat.dis-nncs.LG

Sharp description of local minima in the loss landscape of high-dimensional two-layer ReLU neural networks

classification stat.ML cond-mat.dis-nncs.LG MSC 68T0762M45
keywords two-layer ReLU networksloss landscapelocal minimasummary statisticsone-pass SGDteacher-student modeloverparameterisationGaussian covariates
verification ladder T0 review T1 audit T2 compute T3 formal T4 reserved

The pith

A machine-rendered reading of the paper's core claim, the machinery that carries it, and where it could break.

This paper maps the population loss landscape of two-layer ReLU networks of the form sum ReLU(w_k transpose x) in a realisable teacher-student model with Gaussian inputs. It shows that every local minimum is completely described by a small set of summary statistics of the weights, giving a sharp, low-dimensional picture of the entire landscape. The same coordinates turn one-pass SGD into an autonomous dynamical system whose attractive fixed points are precisely those minima. The resulting organisation of critical points into discrete hierarchical families changes with width: overparameterisation makes global minima more reachable while rendering many spurious solutions unstable or inaccessible. The analysis therefore exposes structural features of even the simplest neural networks that common simplifying assumptions can miss.

Core claim

In the realisable Gaussian teacher-student setting, the local minima of the population loss of the two-layer ReLU network admit an exact representation by a finite collection of summary statistics of the student and teacher weights. These critical points are identical to the attractive fixed points of the one-pass SGD dynamics written in the same summary-statistic coordinates. Consequently the landscape is organised into discrete hierarchical families of minima whose stability and reachability under gradient-based training are controlled by the degree of overparameterisation.

What carries the argument

The low-dimensional summary statistics of the student and teacher weight vectors. They furnish an exact coordinate chart for every local minimum of the population loss and simultaneously serve as the state space in which one-pass SGD becomes an autonomous dynamical system whose attractive fixed points are those minima.

Load-bearing premise

The analysis is performed on the infinite-data population loss with isotropic Gaussian covariates and a teacher of exactly the same two-layer ReLU form; if any of those idealisations fails, both the location and the stability of the reported families of minima can change.

What would settle it

For moderate dimension (e.g., d around 100 and a handful of neurons) compute population-loss critical points by direct high-precision optimisation and test whether every critical point lies exactly on the predicted summary-statistic manifold; any genuine critical point off that manifold would falsify the exact low-dimensional representation.

Watch this falsifier. Get emailed when new claim-graph text bears on it.

If this is right

  • Overparameterisation systematically alters the stability of discrete families of minima, rendering many spurious solutions unstable or unreachable under gradient dynamics.
  • Global minima become the dominant attractors of one-pass SGD once the student is sufficiently wide, reducing the probability of convergence to suboptimal fixed points.
  • Any landscape analysis that ignores the summary-statistic reduction or the fixed-point link to SGD will miss entire hierarchical families of critical points even in this minimal model.
  • The hierarchical organisation of minima is an intrinsic geometric feature of the ReLU teacher-student landscape rather than a finite-sample artefact.

Where Pith is reading between the lines

These are editorial extensions of the paper, not claims the author makes directly.

  • Analogous summary-statistic reductions may exist for deeper or mildly non-realisable architectures and could explain why overparameterisation helps in practice beyond the two-layer case.
  • Finite-sample noise is likely to split or blur the discrete families, so empirical loss surfaces on moderate data sets may appear smoother or more rugged than the exact population picture predicts.
  • The fixed-point correspondence supplies a concrete design principle for schedules or regularisers that preferentially steer trajectories toward the global rather than the spurious families.

Editorial analysis

A structured set of objections, weighed in public.

Desk editor's note, referee report, simulated authors' rebuttal, and a circularity audit.

Referee Report

2 major / 0 minor

Summary. The paper studies the population loss of two-layer ReLU networks of the form ∑_k ReLU(w_k^ op x) in a realisable Gaussian teacher-student setting. It claims that every local minimum admits an exact finite-dimensional representation in a set of summary statistics independent of ambient dimension, that these critical points coincide with attractive fixed points of the one-pass SGD flow written in the same coordinates, and that the resulting landscape organises into discrete hierarchical families whose stability and reachability change with over-parameterisation, making global minima increasingly accessible. The abstract further asserts that common simplifying assumptions miss essential features of even this minimal model.

Significance. If the exact low-dimensional characterisation and the SGD fixed-point correspondence hold rigorously, the work would supply a rare, fully interpretable description of the non-convex landscape of a minimal neural network and a concrete dynamical explanation of how over-parameterisation improves accessibility of global minima. Such a result would be of clear interest to the theoretical machine-learning community and would serve as a useful benchmark against which more approximate mean-field or landscape analyses could be tested. Because the manuscript text supplied for review is entirely corrupted, however, none of these claims can be verified from definitions, theorems or proofs.

major comments (2)
  1. The entire body of the manuscript (all sections after the abstract) consists solely of mojibake / encoding garbage. No definitions of the summary statistics, no statement of the main theorem, no reduced loss, no Jacobian analysis of the SGD flow, and no treatment of ReLU non-differentiability are recoverable. Consequently the central claims of exact low-dimensional representation and of correspondence with attractive fixed points cannot be checked at all.
  2. Without a readable statement of the precise algebraic form of the reduced loss or of the conditions under which the correspondence is claimed to be exhaustive, it is impossible to assess whether the hierarchical organisation of minima or the over-parameterisation accessibility statements are rigorously established or merely conjectural.

Circularity Check

0 steps flagged

No circularity can be exhibited: readable abstract is a first-principles landscape/SGD analysis; body is mojibake so no derivation steps are quotable.

full rationale

The only recoverable text is the abstract, which states a theoretical programme: population loss of a two-layer ReLU student in a realisable Gaussian teacher-student setting admits an exact low-dimensional description of local minima via summary statistics, and those minima coincide with attractive fixed points of one-pass SGD written in the same coordinates. That claim is framed as a derivation under explicit modelling assumptions (isotropic Gaussians, realisable teacher, infinite-data loss), not as a fit to data or a renaming of an empirical pattern. No fitted constants, no self-definitional identities, and no load-bearing uniqueness theorems imported from the authors appear in the abstract. The supplied full-manuscript body is pure encoding garbage (mojibake) and yields no equations, definitions of the summary statistics, Jacobian analysis, or theorem statements that could be checked for circular reduction. Per the hard rules, circularity may be asserted only when a specific reduction can be quoted; none can. Residual concern that the summary-statistic map might be chosen so the fixed-point correspondence is tautological remains speculative without readable text and does not raise the score. Honest finding: no significant circularity identified.

Axiom & Free-Parameter Ledger

0 free parameters · 4 axioms · 2 invented entities

Central claims rest on a standard high-dimensional teacher-student setup plus the modelling choice that the student is a pure sum of ReLUs (no free output weights). No free parameters are fitted to data; the results are claimed to be exact under the stated generative model. Invented entities are limited to the summary-statistic coordinates that reduce the landscape—standard order-parameter constructions rather than new physical objects.

axioms (4)
  • domain assumption Covariates x are i.i.d. isotropic Gaussian; the population loss is the expectation under this measure.
    Stated in the abstract as the setting; required for the exact low-dimensional reduction.
  • domain assumption The problem is realisable: the teacher is itself a finite sum of ReLUs of the same form, so zero population loss is attainable.
    Abstract: ‘realisable teacher-student setting’; without realisability the global-minima families change.
  • ad hoc to paper Student network is exactly ∑_{k=1}^K ReLU(w_k^⊤ x) (output weights fixed to +1).
    Architectural restriction stated in the abstract; simplifies the loss but excludes the usual free second-layer coefficients.
  • domain assumption One-pass SGD dynamics admit a closed description in the same summary statistics that label the critical points.
    Required for the claimed equivalence between local minima and attractive fixed points; standard in high-dimensional online learning analyses.
invented entities (2)
  • Summary-statistic coordinates that exactly label all local minima no independent evidence
    purpose: Provide the low-dimensional representation of the high-dimensional loss landscape and of the SGD flow.
    Abstract claims an ‘exact low-dimensional representation in terms of summary statistics’; these are the order parameters of the theory. Independent evidence is internal to the derivation; no external measurement is proposed.
  • Discrete hierarchical families of local minima no independent evidence
    purpose: Organise the landscape into classes whose stability and reachability change with overparameterisation.
    Abstract: ‘hierarchical organisation of minima into discrete families’. Classification is derived, not postulated a priori, but the families themselves are new named objects of the paper.

pith-pipeline@v1.1.0-grok45 · 16926 in / 2738 out tokens · 27377 ms · 2026-07-12T23:15:19.566801+00:00 · methodology

0 comments
read the original abstract

We study the population loss landscape of two-layer ReLU networks of the form $\sum_{k=1}^K \mathrm{ReLU}(w_k^\top x)$ in a realisable teacher-student setting with Gaussian covariates. We show that local minima admit an exact low-dimensional representation in terms of summary statistics, yielding a sharp and interpretable characterisation of the landscape. We further establish a direct link with one-pass SGD: local minima correspond to attractive fixed points of the dynamics in summary statistics space. This perspective reveals a hierarchical organisation of minima into discrete families and shows how overparameterisation changes their stability and reachability under gradient-based dynamics. In this overparameterised regime, global minima become increasingly accessible, attracting the dynamics and reducing convergence to spurious solutions. Overall, our results reveal intrinsic limitations of common simplifying assumptions, which may miss essential features of the loss landscape even in minimal neural network models.

Figures
Figures reproduced from arXiv: 2604.09412 by Bruno Loureiro, Jie Huang, Stefano Sarao Mannelli.

Figure 1
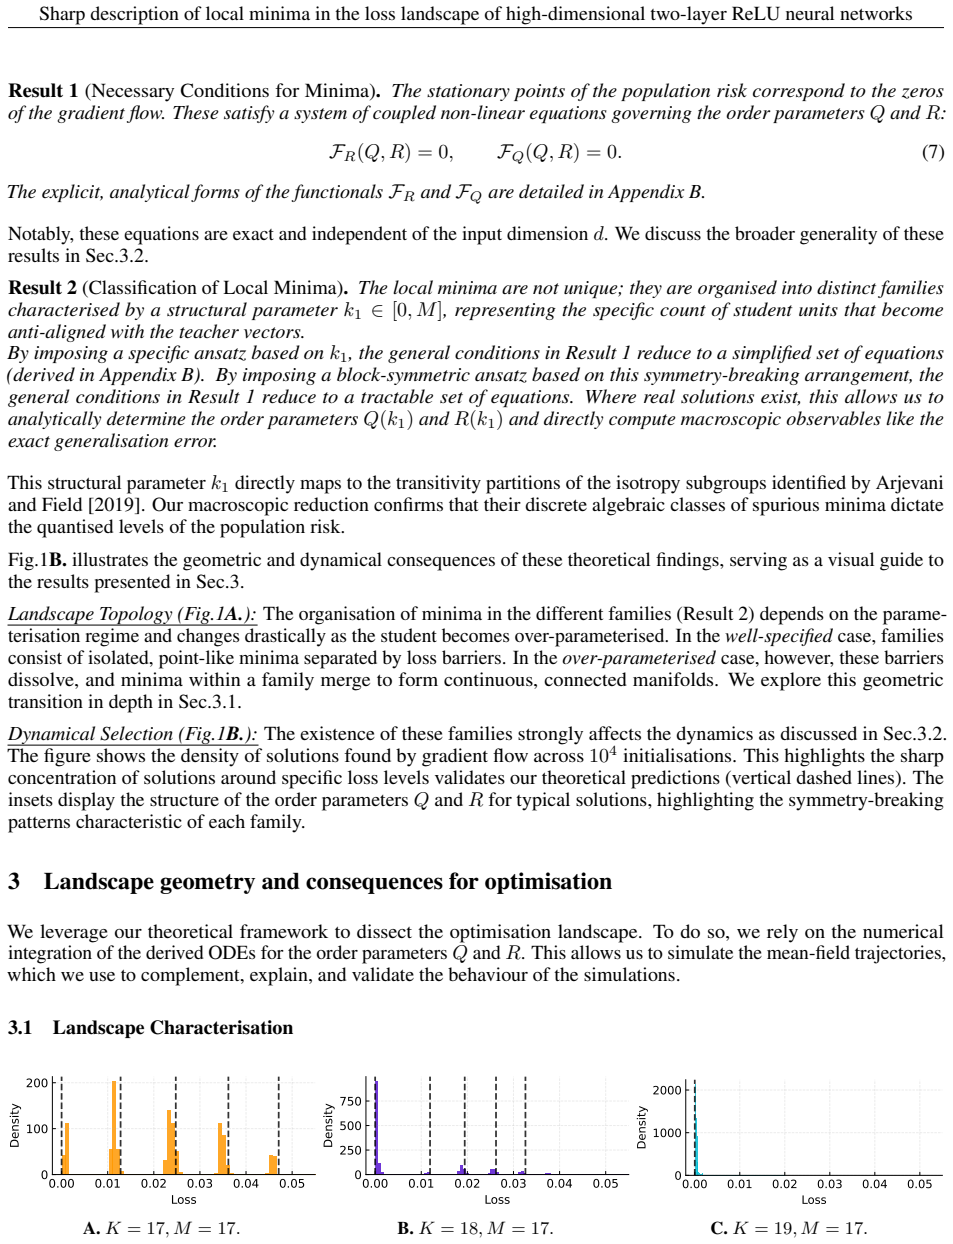
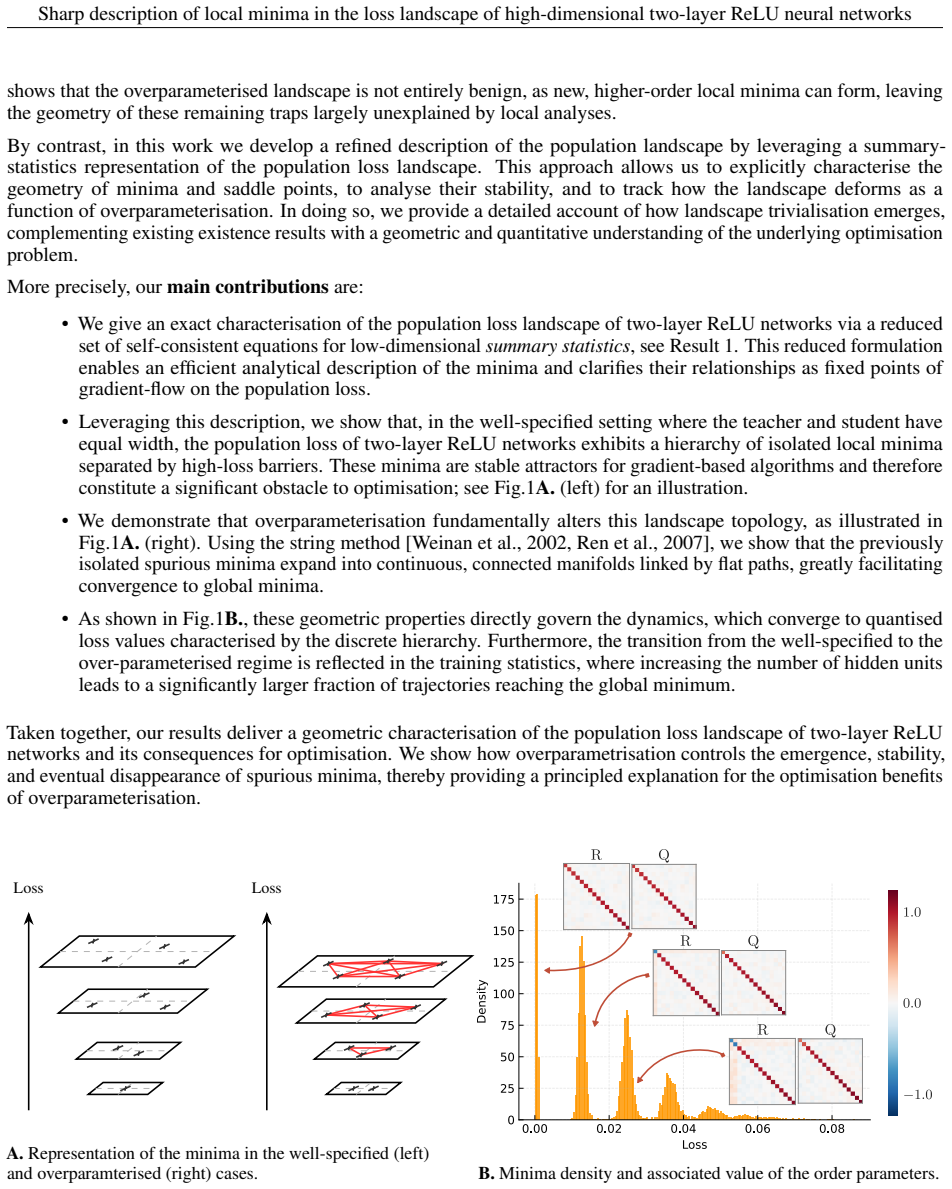
Figure 1. Figure 1: Geometry and statistics of local minima. (a) Schematic comparison of the loss landscape. In the well￾specified regime (left), minima are isolated points (marked ‘x’), whereas in the over-parameterised regime (right), they form continuous connected manifolds (red segments). (b) Validation of the theoretical predictions. The histogram shows the distribution of population risk reached by gradient flow (104 ru… view at source ↗
Figure 2
Figure 2. Figure 2: Loss families and theoretical value. Histogram of final loss values obtained from ODE dynamics at M = 17 for K = M (left), K = M + 1 (center), and K = M + 2 (right) starting from 104 initialisations in orthonormal teacher configuration. Dashed vertical lines indicate the corresponding theoretical loss values obtained from the Result 2 For K = M and K = M + 1, the theoretical values capture the locations of… view at source ↗
Figure 3
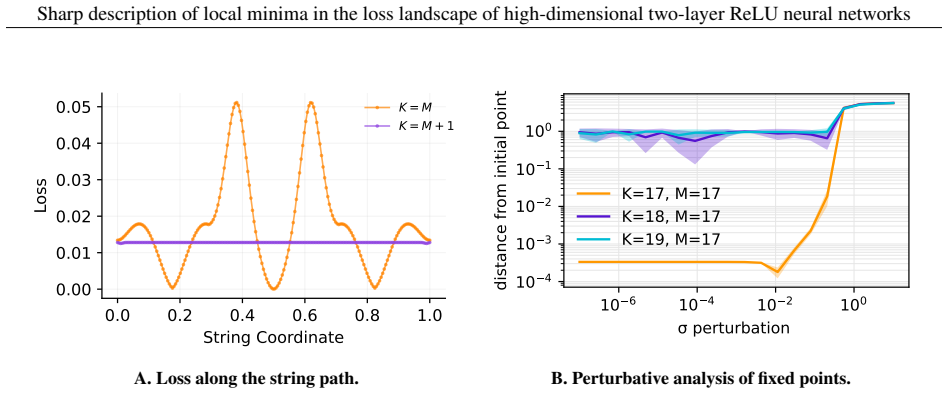
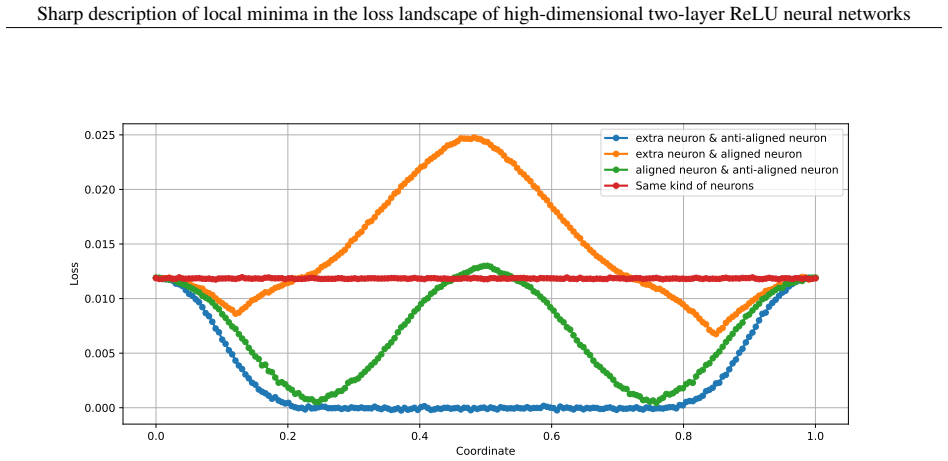
Figure 3. Figure 3: Left: Loss along the string path. We show the loss along the string path connecting two two local minima with different weights in K = M case and K = M + 1 case obtained from the string method in GD. For K = M, the path crosses several different loss barriers, while for K = M + 1 the string remains at constant loss, indicating a flat direction connecting the minima. Right: Perturbative analysis of fixed po… view at source ↗
Figure 4
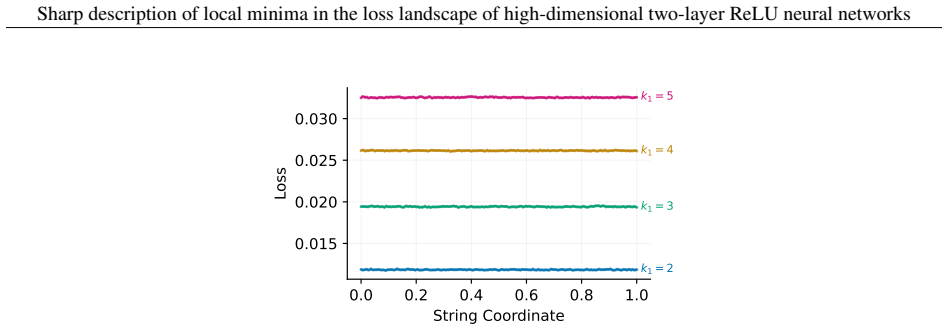
Figure 4. Figure 4: Connectivity of solution manifolds in the over-parameterised regime (K = M + 1). Loss profiles along the minimum loss paths (computed via the string method) connecting two symmetric realisations of the same local minimum. Different colorus correspond to different families indexed by k1 (the number of anti-aligned units). The paths are perfectly flat, indicating that the isolated fixed points of the well-sp… view at source ↗
Figure 5
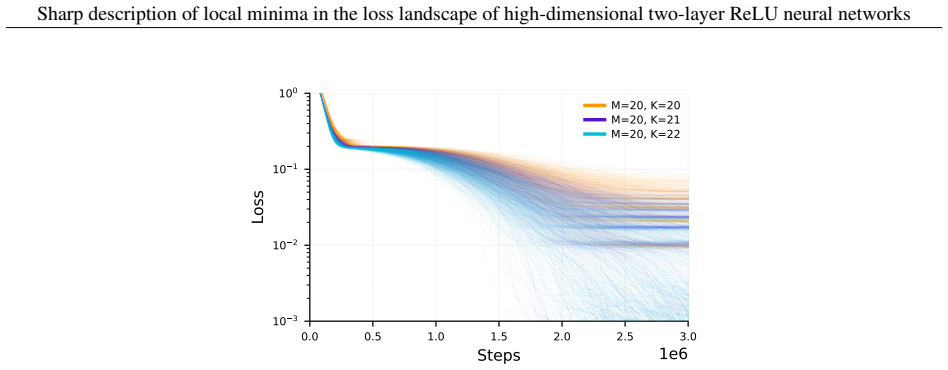
Figure 5. Figure 5: Training dynamics and loss quantisation across parameterisation regimes. Evolution of population risk under gradient flow for M = 20 teacher units (1,000 random initialisations per condition, learning rate η = 0.1 , orthonormal teacher configuration). All regimes exhibit entrapment in discrete high-loss plateaux. However, while the well-specified case (K=20, orange) is dominated by these suboptimal attract… view at source ↗
Figure 6
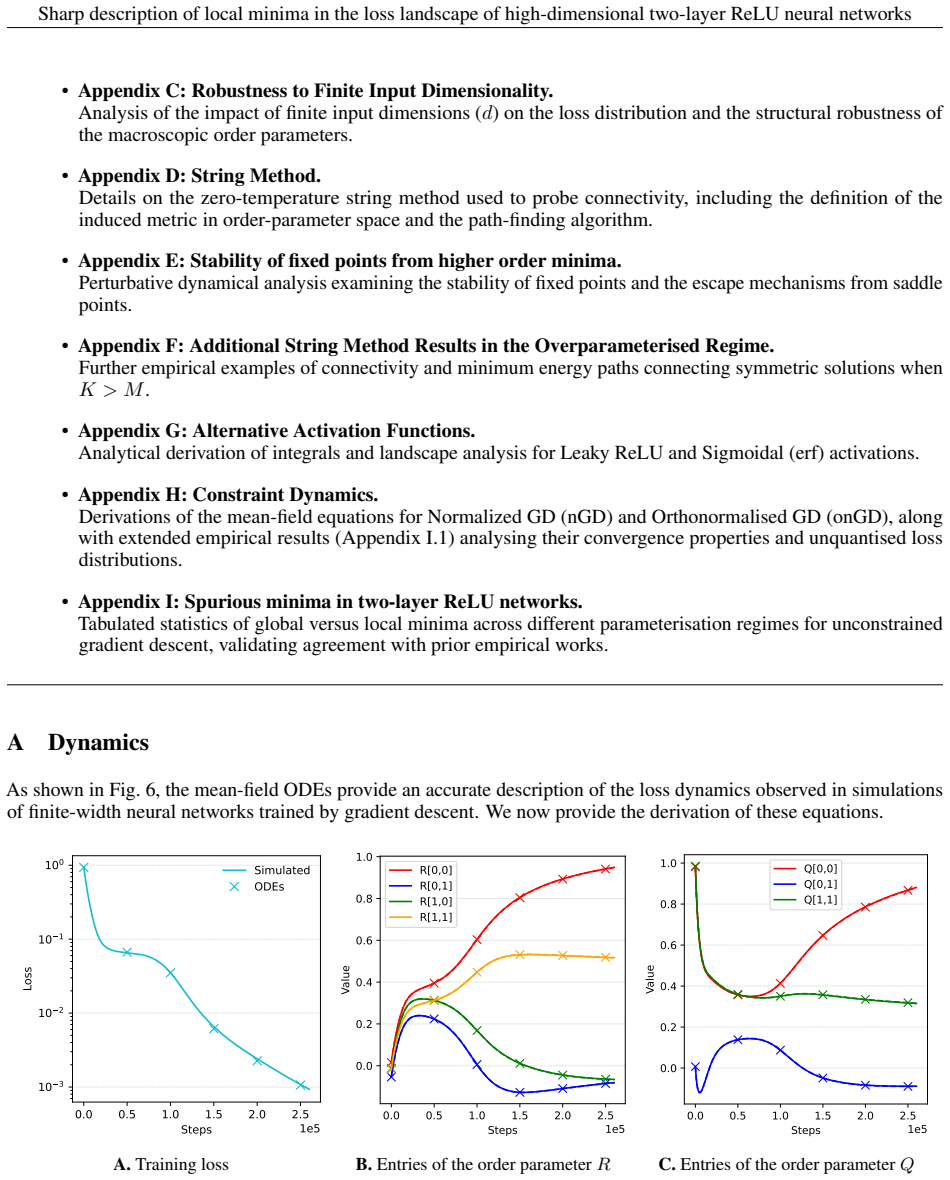
Figure 6. Figure 6: Comparison between mean-field ODE predictions and network simulations. Panel (a) shows the training loss, while panels (b) and (c) display representative entries of the order parameters R and Q as functions of training steps. Solid lines denote simulation results and markers indicate ODE predictions. A.1 Population Gradient We provide additional details on the ODEs for our learning problems. The network is… view at source ↗
Figure 7
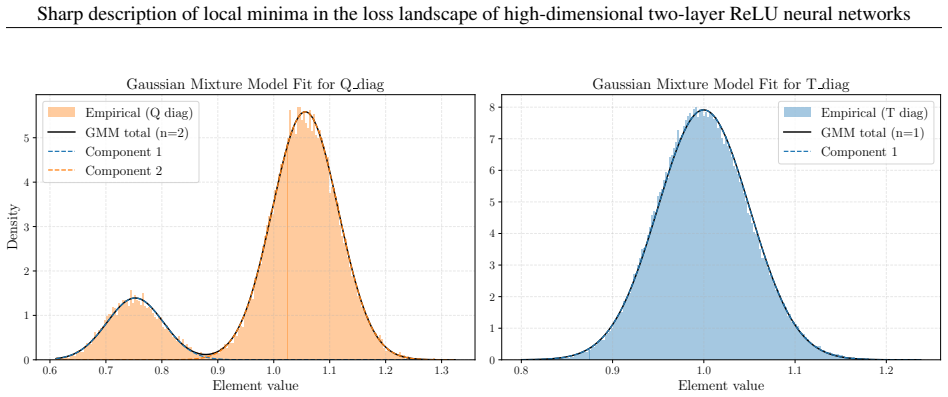
Figure 7. Figure 7: Gaussian mixture analysis of diagonal order parameters.The left panel shows the distribution of diagonal elements of the matrix Q, which is well described by a two-component Gaussian mixture model. The right panel shows the distribution of diagonal elements of the matrix T, which follows a single Gaussian distribution centred at 1. The data are obtained by grouping order parameters within the same minima f… view at source ↗
Figure 8
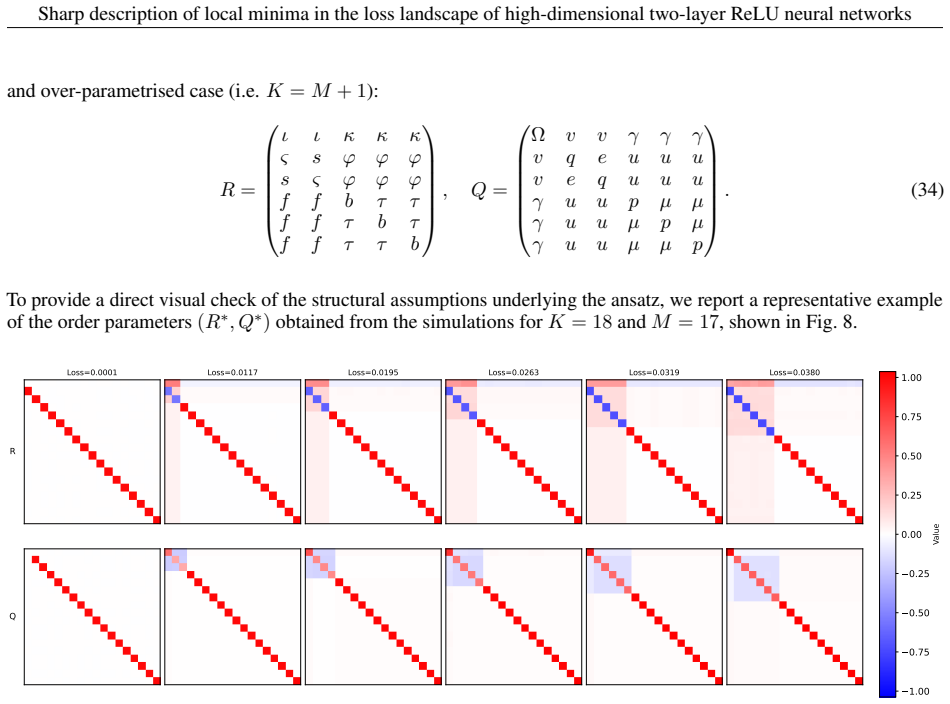
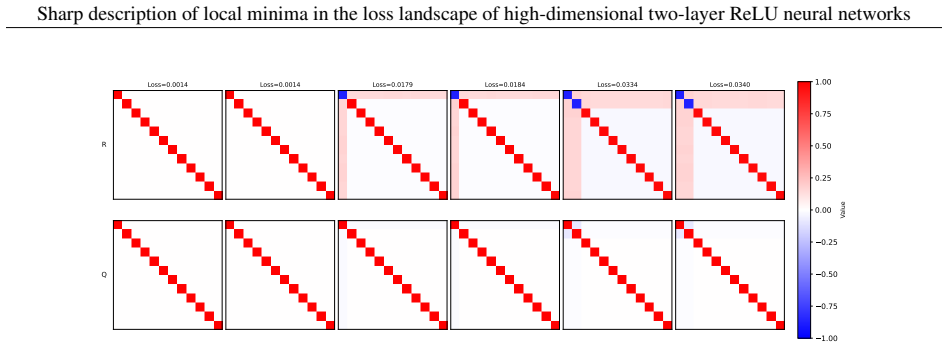
Figure 8. Figure 8: Different order parameters at K = 18 and M = 17. The plots show the values of R (first row) and Q (second row) for minima representative of the different families. From left to right, we see results for k1 = 0, 2, 3, 4, 5, 6. B.2 Solution of the Fixed Point Equation Under the Ansatz The fixed point equations of dQik/dt, dRin/dt (Eqs. 22 and Eqs. 21) simplify after substituting the ansatz defined in Eqs. 8.… view at source ↗
Figure 9
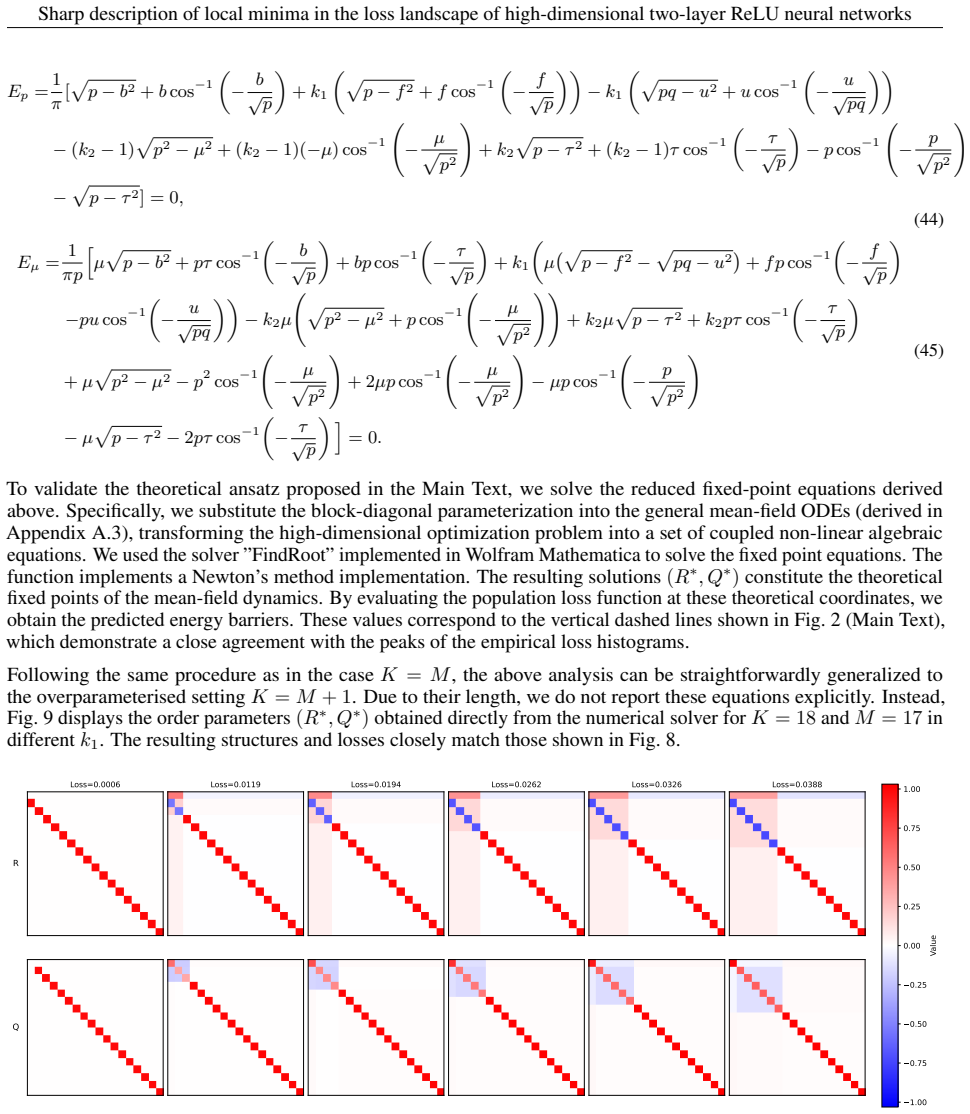
Figure 9. Figure 9: displays the order parameters (R∗ , Q∗ ) obtained directly from the numerical solver for K = 18 and M = 17 in different k1. The resulting structures and losses closely match those shown in [PITH_FULL_IMAGE:figures/full_fig_p021_9.png] view at source ↗
Figure 10
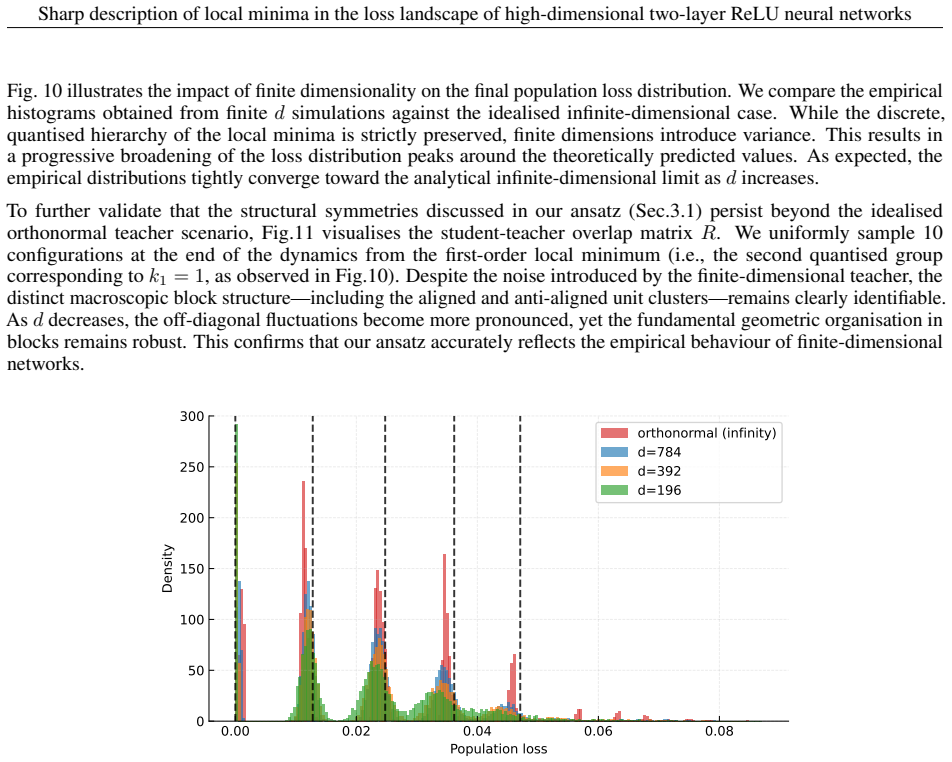
Figure 10. Figure 10: illustrates the impact of finite dimensionality on the final population loss distribution. We compare the empirical histograms obtained from finite d simulations against the idealised infinite-dimensional case. While the discrete, quantised hierarchy of the local minima is strictly preserved, finite dimensions introduce variance. This results in a progressive broadening of the loss distribution peaks arou… view at source ↗
Figure 11
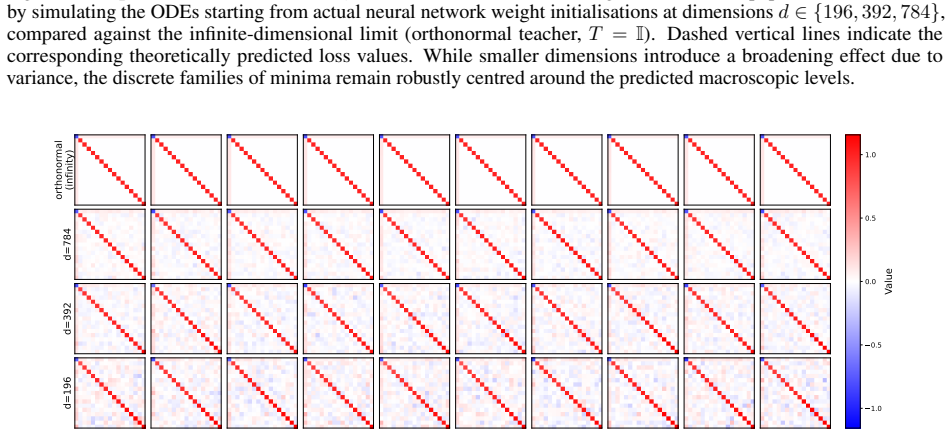
Figure 11. Figure 11: Student-teacher overlap matrix (R) across different dimensions. Heatmaps of the R matrix for 10 randomly sampled configurations converging to the first-order local minimum (k1 = 1). The top row represents the idealised d → ∞ limit, while subsequent rows correspond to finite dimensions d = 784, 392, and 196. The block￾symmetric structure predicted by our theoretical ansatz clearly emerges across all regime… view at source ↗
Figure 12
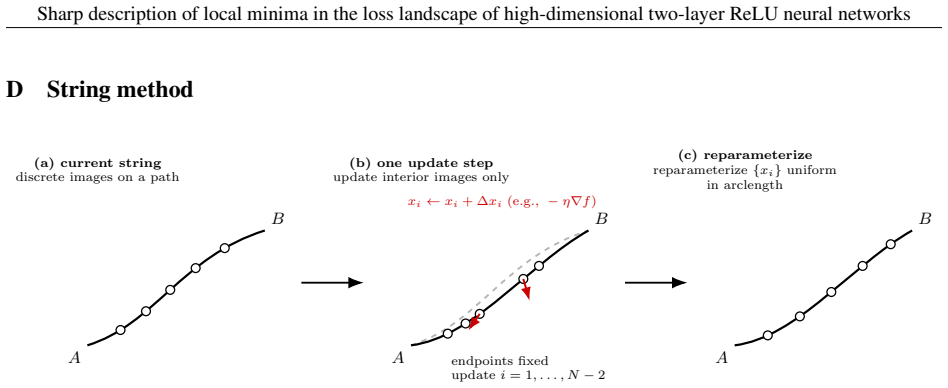
Figure 12. Figure 12: Illustration of the string method. In this section, we briefly introduce the string method [Weinan et al., 2002, Ren et al., 2007, Samanta and Weinan, 2013], which is used to investigate whether distinct minima are separated by energy barriers or connected by flat valleys. This algorithm seeks the Minimum Energy Path (MEP) connecting two fixed configurations in the order parameter space. Conceptually simi… view at source ↗
Figure 13
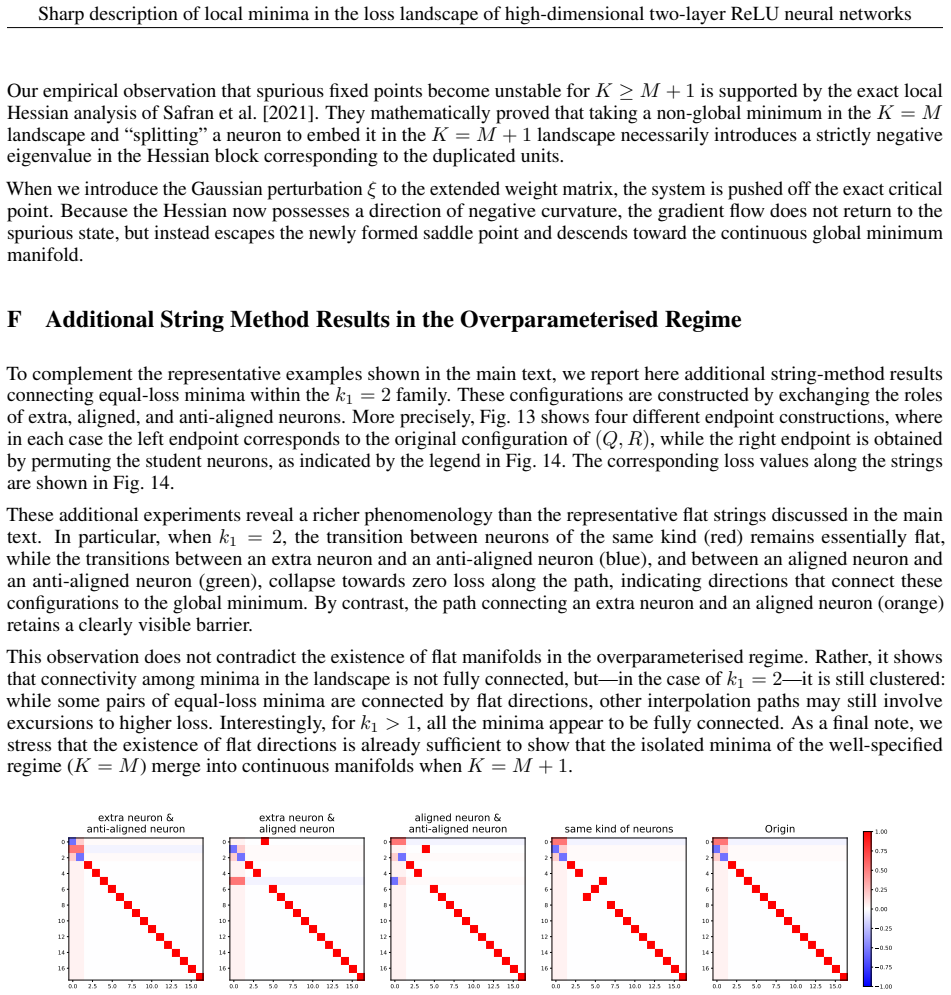
Figure 13. Figure 13: R of different settings. Examples of endpoint configurations within the k1 = 2 family in the overpa￾rameterised regime, shown here through the corresponding R matrices. For the strings in [PITH_FULL_IMAGE:figures/full_fig_p025_13.png] view at source ↗
Figure 14
Figure 14. Figure 14: Strings of different settings. Loss values along strings connecting the endpoint configurations shown in [PITH_FULL_IMAGE:figures/full_fig_p026_14.png] view at source ↗
Figure 15
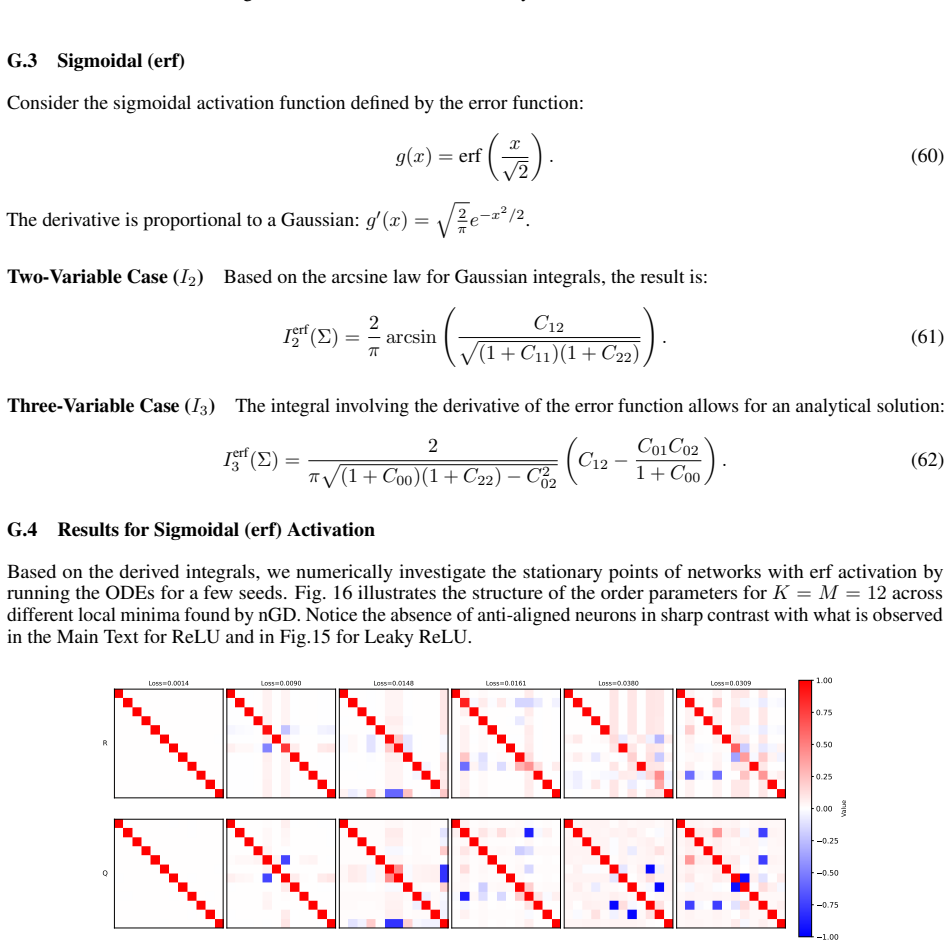
Figure 15. Figure 15: Order Parameters of Leaky ReLU in K = M = 12 G.3 Sigmoidal (erf) Consider the sigmoidal activation function defined by the error function: g(x) = erf  x √ 2  . (60) The derivative is proportional to a Gaussian: g ′ (x) = q 2 π e −x 2/2 . Two-Variable Case (I2) Based on the arcsine law for Gaussian integrals, the result is: I erf 2 (Σ) = 2 π arcsin p C12 (1 + C11)(1 + C22) ! . (61) Three-Variable Case (I… view at source ↗
Figure 16
Figure 16. Figure 16: Order Parameters of erf in K = M = 12 27 [PITH_FULL_IMAGE:figures/full_fig_p027_16.png] view at source ↗
Figure 17
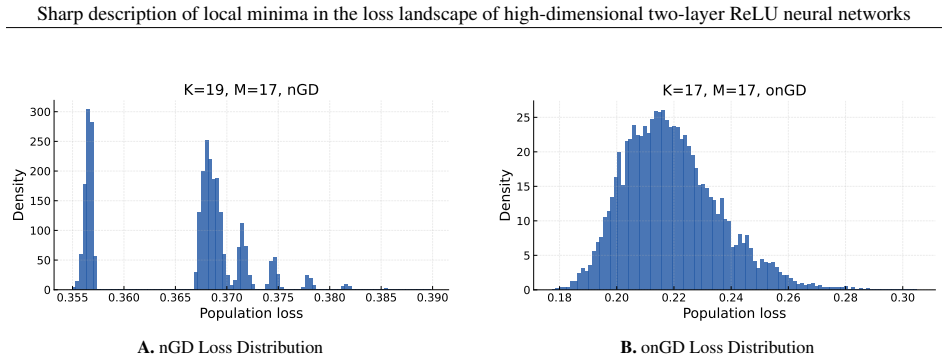
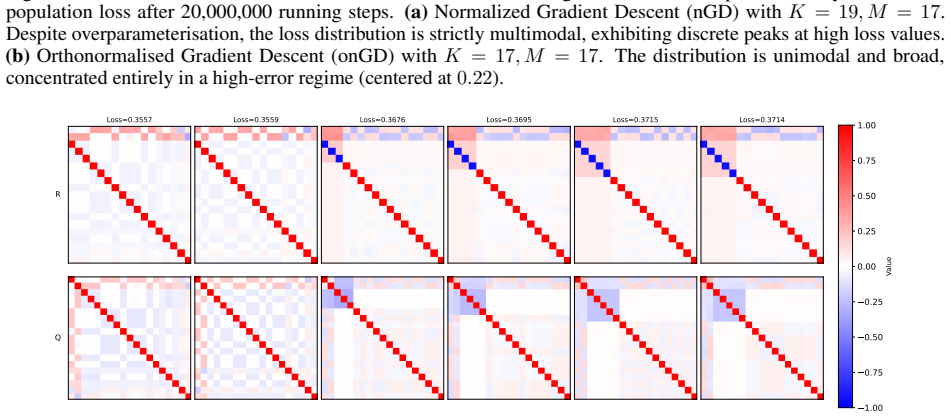
Figure 17. Figure 17: Loss distribution in different constraints These histograms show the empirical density of the final population loss after 20,000,000 running steps. (a) Normalized Gradient Descent (nGD) with K = 19, M = 17. Despite overparameterisation, the loss distribution is strictly multimodal, exhibiting discrete peaks at high loss values. (b) Orthonormalised Gradient Descent (onGD) with K = 17, M = 17. The distribut… view at source ↗
Figure 18
Figure 18. Figure 18: Order parameters of local minima in nGD (K = 19, M = 17). The columns correspond to different final losses. Left Two Columns (Best Minima): The R matrices exhibit a near-perfect diagonal structure, indicating successful retrieval of the 17 teacher features. However, the irreducible error persists because the 2 excess students (constrained to Qii = 1) cannot decay to zero. Right Four Columns (Suboptimal Mi… view at source ↗
Figure 19
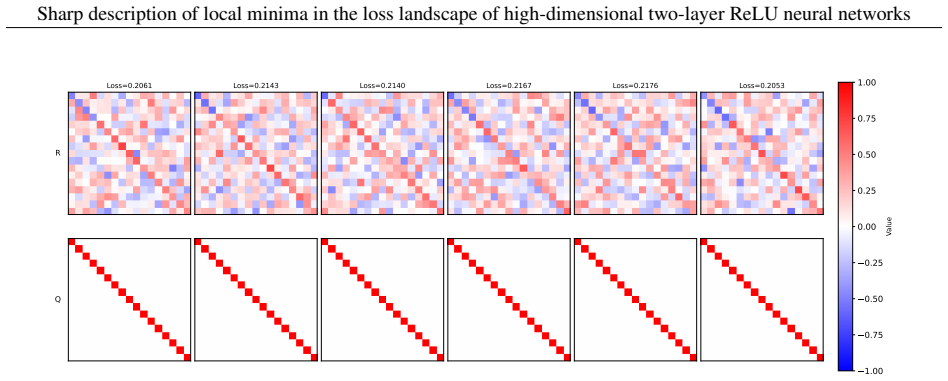
Figure 19. Figure 19: Final order parameters for onGD (K = M = 17). The columns correspond to different final losses. Bottom Row: The student-student overlap matrices Q retain a strict identity structure (Q = I), satisfying the orthogonality constraint. Top Row: The student-teacher overlap matrices R exhibit a disordered, noise-like pattern. Unlike successful learning scenarios shown in [PITH_FULL_IMAGE:figures/full_fig_p030_… view at source ↗
Figure 20
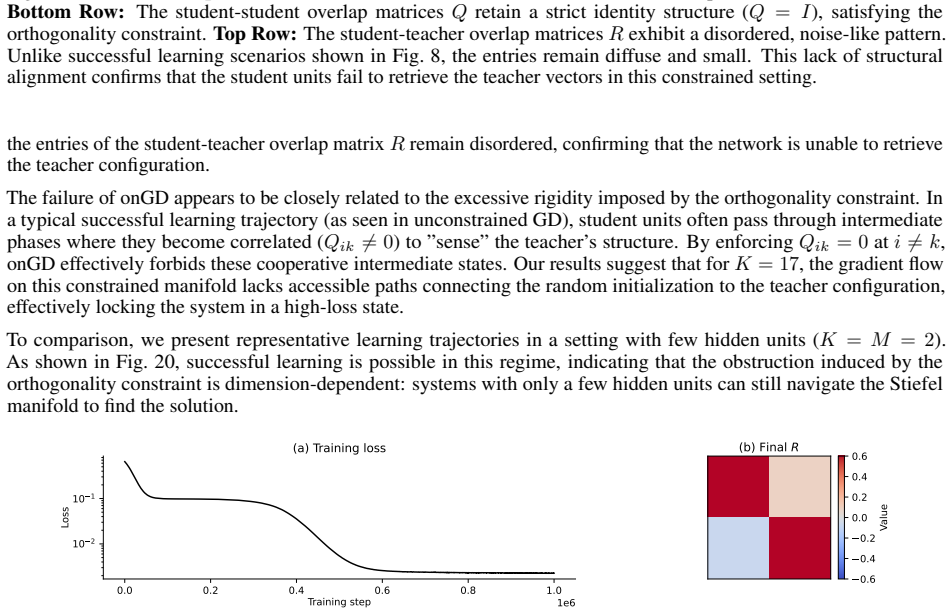
Figure 20. Figure 20: Dynamics of onGD in a setting with small hidden layers (K = M = 2). (a) The training loss (log scale) decreases monotonically and converges to a near-zero value (∼ 10−3 ), indicating successful optimisation. (b) The final student-teacher overlap matrix R exhibits a clear diagonal structure (red blocks indicate high positive correlation). This confirms that, unlike the case with larger hidden layers (K = M… view at source ↗
Figure 21
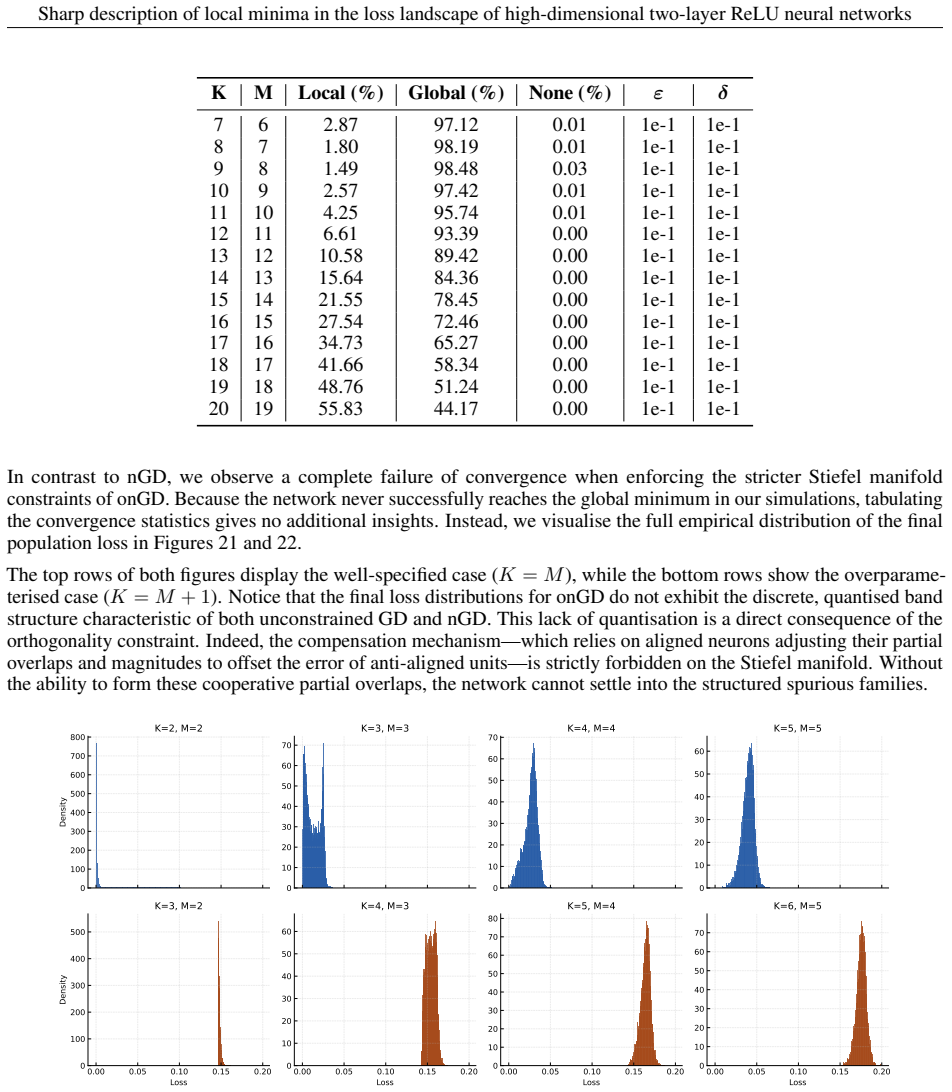
Figure 21. Figure 21: Distribution of loss for small networks in onGD under mean-field dynamic. Histograms of the final population loss obtained after long-time integration of the mean-field ODEs under Orthonormalised GD over 10,000 random initialisations. Each panel corresponds to a small student-teacher size configuration (K, M). The top row shows the equal case K = M and the bottom row shows the overparameterised case K = M… view at source ↗
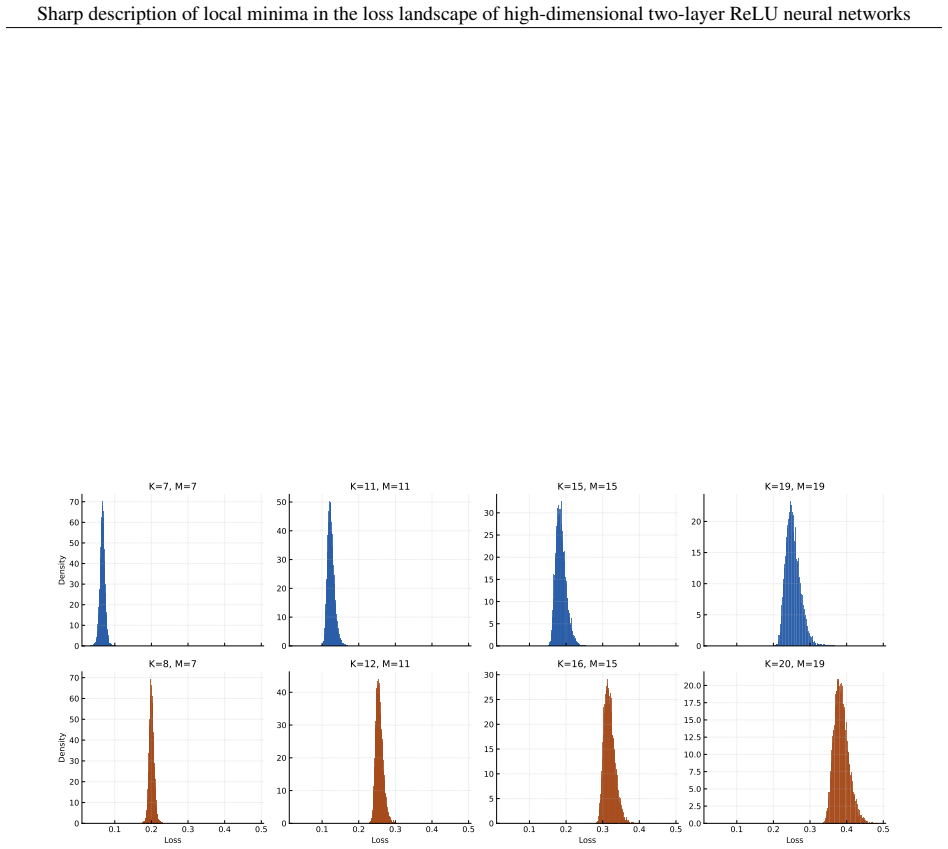
Figure 22
Figure 22. Figure 22: Distribution of loss for wider networks in onGD under mean-field dynamic. Histograms of the final population loss obtained after long-time integration of the mean-field ODEs under Orthonormalised GD over 10,000 random initialisations. Each panel corresponds to a student-teacher size configuration (K, M) with larger widths than those shown in [PITH_FULL_IMAGE:figures/full_fig_p034_22.png] view at source ↗

discussion (0)

Sign in with ORCID, Apple, or X to comment. Anyone can read and Pith papers without signing in.

Forward citations

Cited by 1 Pith paper

Reviewed papers in the Pith corpus that reference this work. Sorted by Pith novelty score.

  1. Spectral phase transitions and trainability in neural network learning dynamics

    cond-mat.dis-nn 2026-06 unverdicted novelty 6.0

    SGD on neural network weights induces a BBP phase transition that detaches signal eigenvalues from the random bulk, yielding an analytically solvable phase diagram for trainability in a linear teacher-student model.