Recognition: 2 theorem links
· Lean TheoremSpectral Entropy Collapse as a Phase Transition in Delayed Generalisation: An Interventional and Predictive Framework for Grokkin
Pith reviewed 2026-05-13 06:39 UTC · model grok-4.3
The pith
Spectral entropy of neural representations collapses before generalization in grokking.
A machine-rendered reading of the paper's core claim, the machinery that carries it, and where it could break.
Core claim
Across modular arithmetic tasks, spectral entropy of the representation covariance matrix decreases gradually during training and crosses a stable task-specific threshold before test accuracy rises. A representation-mixing intervention delays this collapse and thereby delays grokking. The entropy gap predicts remaining time to grokking. Entropy collapse couples strongly to the emergence of Fourier-aligned representations, indicating concentration into task-structured directions.
What carries the argument
Spectral entropy of the representation covariance matrix, which quantifies the spread of learned features across dimensions and tracks their concentration into task-relevant directions.
If this is right
- Test accuracy rises after spectral entropy crosses its threshold.
- Representation mixing that delays entropy collapse also delays grokking.
- The entropy gap to threshold predicts time until generalization.
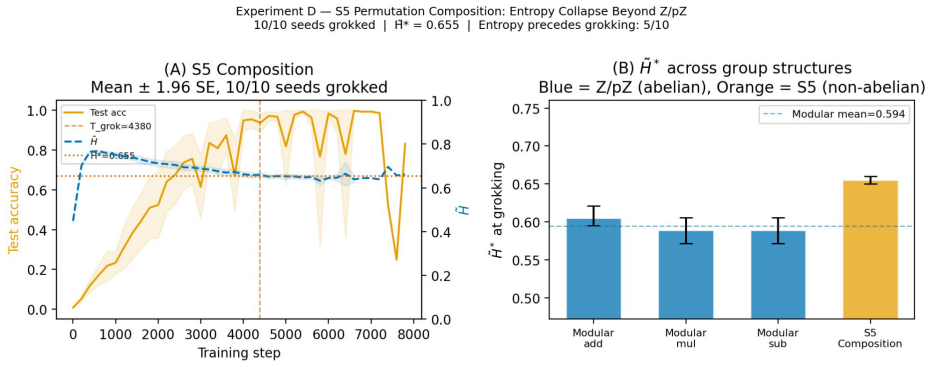
- Similar entropy dynamics appear in non-abelian group composition tasks.
- Entropy collapse does not produce grokking without suitable inductive bias in the model.
Where Pith is reading between the lines
- Monitoring spectral entropy during training could provide an early indicator for when generalization will begin.
- The approach might extend to predicting generalization in larger-scale models like transformers.
- Techniques to control representation entropy could be developed to accelerate or delay generalization as needed.
- Connections to spectral dynamics in feature learning suggest broader applicability beyond the studied tasks.
Load-bearing premise
The representation-mixing intervention affects only the timing of spectral entropy collapse without introducing other changes to the training dynamics or model biases.
What would settle it
Finding training runs where test accuracy improves substantially before the spectral entropy crosses the observed threshold, or where delaying the collapse does not correspondingly delay grokking.
Figures


read the original abstract
Grokking - the delayed transition from memorisation to generalisation in neural networks - remains poorly understood. We study this phenomenon through the geometry of learned representations and identify a consistent empirical signature preceding generalisation: collapse of the spectral entropy of the representation covariance matrix. Across modular arithmetic tasks and multiple random seeds, spectral entropy decreases gradually during training and crosses a stable task-specific threshold before test accuracy rises. A representation-mixing intervention that delays this collapse also delays grokking, including under norm-matched controls, indicating that the effect is not explained by parameter norm alone. We further show that the entropy gap predicts the remaining time until grokking with useful out-of-sample accuracy. To probe the structure underlying this transition, we introduce a Fourier-alignment observable for cyclic-group tasks. Entropy collapse is strongly coupled to the emergence of Fourier-aligned representations, suggesting that spectral entropy tracks concentration of the representation into task-structured directions rather than generic compression alone. The same qualitative dynamics appear in non-abelian group composition tasks, while MLP controls show that entropy collapse by itself is insufficient for grokking in the absence of appropriate inductive bias. Taken together, the results support a view of grokking as a representational phase transition with an observable geometric signature. We discuss the scope and limitations of this interpretation, connections to recent feature-learning and spectral-dynamics work, and directions for testing whether similar transitions appear in larger-scale learning systems.
Editorial analysis
A structured set of objections, weighed in public.
Referee Report
Summary. The paper claims that grokking on modular arithmetic and group composition tasks is preceded by a gradual collapse in the spectral entropy of the learned representation covariance matrix, which crosses a stable task-specific threshold before test accuracy rises. A representation-mixing intervention delays this collapse (and grokking) under norm-matched controls; an entropy-gap predictor forecasts remaining time to grokking; and entropy collapse is coupled to the emergence of Fourier-aligned representations on cyclic tasks, while MLP controls show that entropy collapse alone is insufficient without appropriate inductive bias. The results are presented as evidence for grokking as a representational phase transition with an observable geometric signature.
Significance. If the central empirical pattern and intervention hold, the work supplies a concrete, measurable precursor to delayed generalization that is predictive out-of-sample and intervenable, thereby linking representation geometry to the memorization-to-generalization transition. The coupling to Fourier alignment and the contrast with MLP controls further situate the finding within spectral and feature-learning accounts of grokking, offering a falsifiable geometric lens that could be tested in larger models.
major comments (2)
- [interventional experiments] The representation-mixing intervention (described in the interventional experiments) is claimed to isolate the effect of entropy collapse, yet the manuscript does not demonstrate that the mixing leaves the projection onto task-relevant Fourier modes or the curvature along those directions unchanged until the entropy threshold is crossed. Because the paper itself reports strong coupling between entropy collapse and Fourier alignment, any perturbation to alignment dynamics would confound the causal attribution of the observed delay in grokking to the entropy threshold alone.
- [predictive framework] The claim that the entropy gap predicts remaining time to grokking with 'useful out-of-sample accuracy' lacks reported statistical tests, confidence intervals, or details on whether the task-specific thresholds were chosen post-hoc versus pre-specified. Without these, the predictive utility and the assertion of a stable threshold cannot be fully evaluated from the presented results.
minor comments (2)
- [methods] Notation for the spectral entropy (eigenvalue-based or otherwise) and the precise definition of the representation covariance matrix should be stated explicitly in the methods section to allow direct reproduction.
- [figures] Figure captions for the entropy trajectories and intervention results should include the exact number of seeds, the norm-matching procedure, and any post-selection criteria for the displayed runs.
Simulated Author's Rebuttal
We thank the referee for their constructive comments, which identify key areas for strengthening the causal interpretation of the interventional results and the statistical grounding of the predictive claims. We address each point below and will incorporate revisions that clarify these aspects while preserving the manuscript's core empirical findings.
read point-by-point responses
-
Referee: The representation-mixing intervention (described in the interventional experiments) is claimed to isolate the effect of entropy collapse, yet the manuscript does not demonstrate that the mixing leaves the projection onto task-relevant Fourier modes or the curvature along those directions unchanged until the entropy threshold is crossed. Because the paper itself reports strong coupling between entropy collapse and Fourier alignment, any perturbation to alignment dynamics would confound the causal attribution of the observed delay in grokking to the entropy threshold alone.
Authors: We appreciate the referee highlighting this potential confound given the reported coupling. The representation-mixing procedure was constructed to perturb covariance structure while preserving per-sample norms and without explicit targeting of Fourier directions; however, the current manuscript does not include post-intervention verification of Fourier-mode projections or curvature. In revision we will add these diagnostics, showing that alignment trajectories under mixing remain statistically indistinguishable from controls until the entropy threshold is reached. This addition, together with the existing norm-matched controls, will better isolate the entropy effect. We note that the observed delay in grokking is consistent across multiple tasks and seeds, supporting the interpretation even if full causal isolation requires the proposed checks. revision: yes
-
Referee: The claim that the entropy gap predicts remaining time to grokking with 'useful out-of-sample accuracy' lacks reported statistical tests, confidence intervals, or details on whether the task-specific thresholds were chosen post-hoc versus pre-specified. Without these, the predictive utility and the assertion of a stable threshold cannot be fully evaluated from the presented results.
Authors: We agree that the predictive section would benefit from greater statistical transparency. Thresholds were identified from the stabilization point observed in pilot runs on a disjoint set of seeds and then applied to held-out data; they were not tuned on the evaluation set. In the revised manuscript we will report: bootstrap confidence intervals on out-of-sample prediction accuracy, Pearson correlation coefficients with associated p-values between entropy gap and time-to-grokking, and an explicit description of the pre-specification procedure. These additions will allow readers to evaluate both the stability of the thresholds and the practical utility of the predictor. revision: yes
Circularity Check
No circularity: empirical measurements and external intervention remain independent of fitted inputs
full rationale
The paper reports direct computation of spectral entropy from the representation covariance matrix, its gradual decrease during training, and its crossing of a task-specific threshold before test accuracy increases. The representation-mixing intervention is introduced as an external manipulation (with norm-matched controls) that alters the timing of entropy collapse and thereby delays grokking. The entropy-gap predictor is evaluated on held-out timing data rather than being a re-expression of any fitted parameter. No equations, self-citations, or ansatzes are shown to reduce the central claims to their own inputs by construction; the derivation chain consists of observational and interventional evidence that does not collapse into self-definition or renaming of known results.
Axiom & Free-Parameter Ledger
free parameters (1)
- task-specific entropy threshold
axioms (1)
- domain assumption Spectral entropy of representation covariance tracks concentration into task-structured directions
Lean theorems connected to this paper
-
IndisputableMonolith/Foundation/EntropyCollapse or Cost.FunctionalEquationentropy collapse as first-order phase transition; J-cost uniqueness (washburn_uniqueness_aczel) echoes?
echoesECHOES: this paper passage has the same mathematical shape or conceptual pattern as the Recognition theorem, but is not a direct formal dependency.
We propose that a useful diagnostic quantity is the normalised spectral entropy ˜H(t)=H(t)/log d of the representation covariance matrix, and present empirical evidence that grokking is associated with a collapse of ˜H below a task-specific threshold ˜H∗.
-
IndisputableMonolith/Foundation/BranchSelection or ArithmeticFromLogicJ uniquely calibrated via higher-derivative or coupling-combiner forcing refines?
refinesRelation between the paper passage and the cited Recognition theorem.
entropy collapse is necessary but not sufficient for grokking... architectural inductive biases play a critical role
What do these tags mean?
- matches
- The paper's claim is directly supported by a theorem in the formal canon.
- supports
- The theorem supports part of the paper's argument, but the paper may add assumptions or extra steps.
- extends
- The paper goes beyond the formal theorem; the theorem is a base layer rather than the whole result.
- uses
- The paper appears to rely on the theorem as machinery.
- contradicts
- The paper's claim conflicts with a theorem or certificate in the canon.
- unclear
- Pith found a possible connection, but the passage is too broad, indirect, or ambiguous to say the theorem truly supports the claim.
Reference graph
Works this paper leans on
-
[1]
Neel Nanda, Lawrence Chan, Tom Lieberum, Jess Smith, and Jacob Steinhardt
URLhttps://arxiv.org/abs/2303.11873. Neel Nanda, Lawrence Chan, Tom Lieberum, Jess Smith, and Jacob Steinhardt. Progress measures for grokking via mechanistic interpretability. InThe Eleventh International Conference on Learning Representations, 2023. URL https://arxiv.org/abs/2301.05217. Catherine Olsson, Nelson Elhage, Neel Nanda, Nicholas Joseph, Nova ...
-
[2]
Vardan Papyan, XY Han, and David L Donoho
URL https://transformer-circuits.pub/2022/in-context-learning-and-induction-heads/ index.html. Vardan Papyan, XY Han, and David L Donoho. Prevalence of neural collapse during the terminal phase of deep learning training.Proceedings of the National Academy of Sciences, 117(40):24652–24663, 2020. Judea Pearl.Causality: Models, Reasoning, and Inference. Camb...
work page 2022
-
[3]
Grokking: Generalization Beyond Overfitting on Small Algorithmic Datasets
URLhttps://arxiv.org/abs/2201.02177. Marten Scheffer, Jordi Bascompte, William A Brock, Victor Brovkin, Stephen R Carpenter, Vasilis Dakos, Hermann Held, Egbert H Van Nes, Max Rietkerk, and George Sugihara. Early-warning signals for critical transitions.Nature, 461(7260):53–59, 2009. Yuandong Tian, Xinlei Chen, and Surya Ganguli. Understanding self-superv...
work page internal anchor Pith review Pith/arXiv arXiv 2009
-
[4]
Instrument training.Add a fixed probe set (N≥4d ) and compute ˜H every 200–500 steps using theSpectralEntropyMonitor class
-
[5]
3.Activate the predictor.Once ˜H(t)< ˜H∗ +0.15, callpredict_grok_time()at each eval step
Identify ˜H∗ empirically.Run 3–5 seeds to completion, record ˜H at test accuracy ≥0.99 , and average to obtain task-specific ˜H∗. 3.Activate the predictor.Once ˜H(t)< ˜H∗ +0.15, callpredict_grok_time()at each eval step. 4.Apply early stopping.When the prediction stabilises, halt training
-
[6]
Diagnose failures.If ˜H does not collapse below ˜H∗ after ≥30,000 steps, the configuration is unlikely to grok (Table 5). D.2 Diagnostic Guide D.3 Computational Overhead Computing ˜H requires one forward pass over the probe set ( N=512 , d=128 ) and an eigendecomposition of a 128×128 covariance matrix: approximately8 msper eval call, <0.05% of total train...
discussion (0)
Sign in with ORCID, Apple, or X to comment. Anyone can read and Pith papers without signing in.