Recognition: unknown
Machine learning approaches to uncover the neural mechanisms of motivated behaviour: from ADHD to individual differences in effort and reward sensitivity
Pith reviewed 2026-05-10 15:05 UTC · model grok-4.3
The pith
Machine learning identifies fronto-parietal circuits as central to effort and reward processing in ADHD.
A machine-rendered reading of the paper's core claim, the machinery that carries it, and where it could break.
Core claim
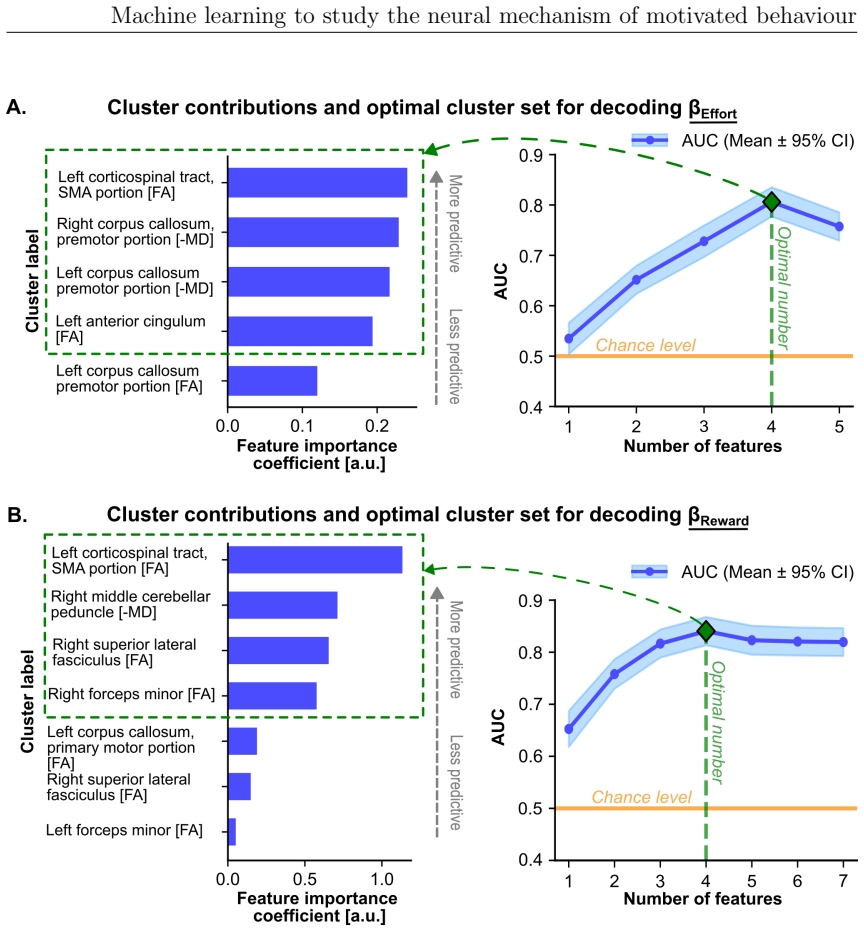
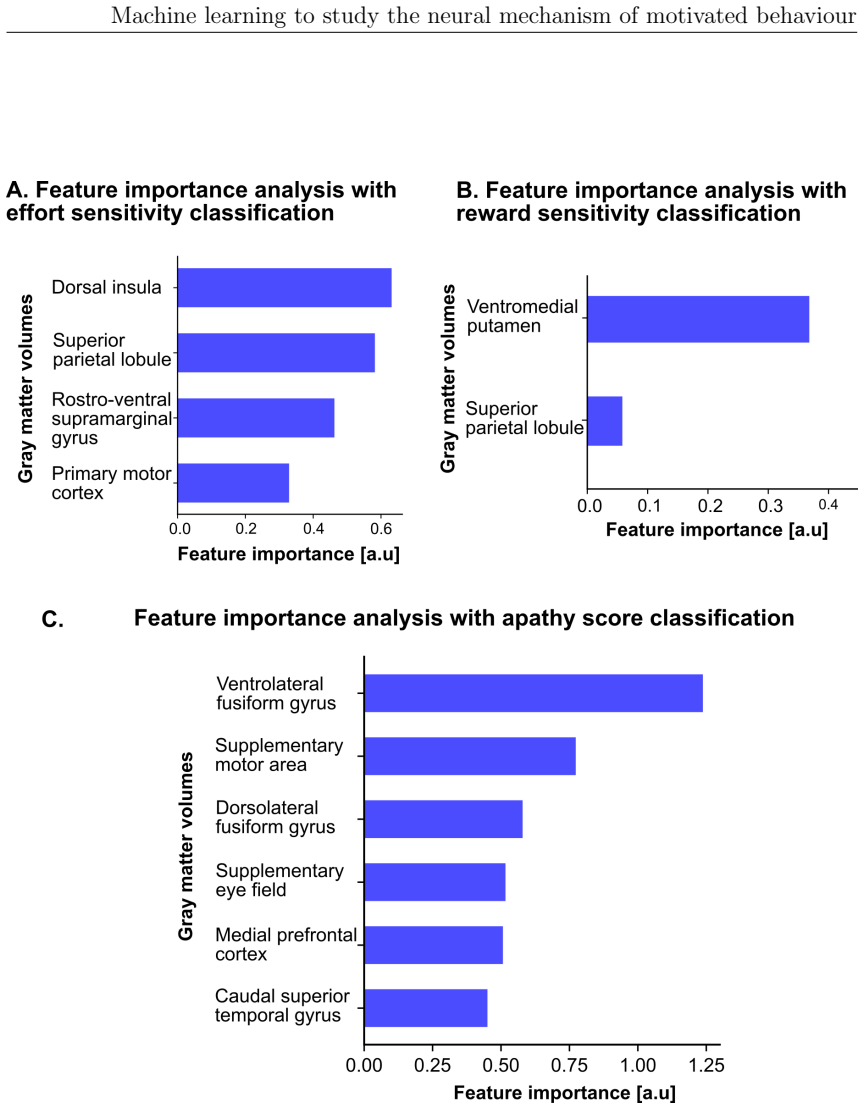
The paper claims that fronto-parietal circuits are central to effort valuation and reward processing, as demonstrated by machine learning models applied across EEG, diffusion MRI, and structural MRI in studies of ADHD and individual differences. Task-based EEG gamma power over fronto-central and parietal areas best classified ADHD versus controls. SMA-connected white matter tracts associated with effort and reward parameters, and grey matter volumes robustly predicted reward sensitivity and subclinical apathy. These results suggest the circuits may serve as biomarkers for improving diagnostic accuracy in ADHD and motivational impairments and for directing neurotechnological interventions.
What carries the argument
Machine learning models applied to task-based and resting-state EEG, diffusion MRI white matter integrity, and structural MRI grey matter volumes to classify ADHD and predict effort and reward sensitivities, converging on fronto-parietal circuits.
Load-bearing premise
The identified machine learning features and brain associations will generalise beyond the particular tasks, scanners, and participant groups studied here without significant overfitting or confounding variables.
What would settle it
An independent study with new participants, different scanners, or varied tasks fails to replicate the superior performance of task-based EEG classifiers for ADHD or the specific associations between SMA white matter tracts and effort/reward parameters.
Figures


read the original abstract
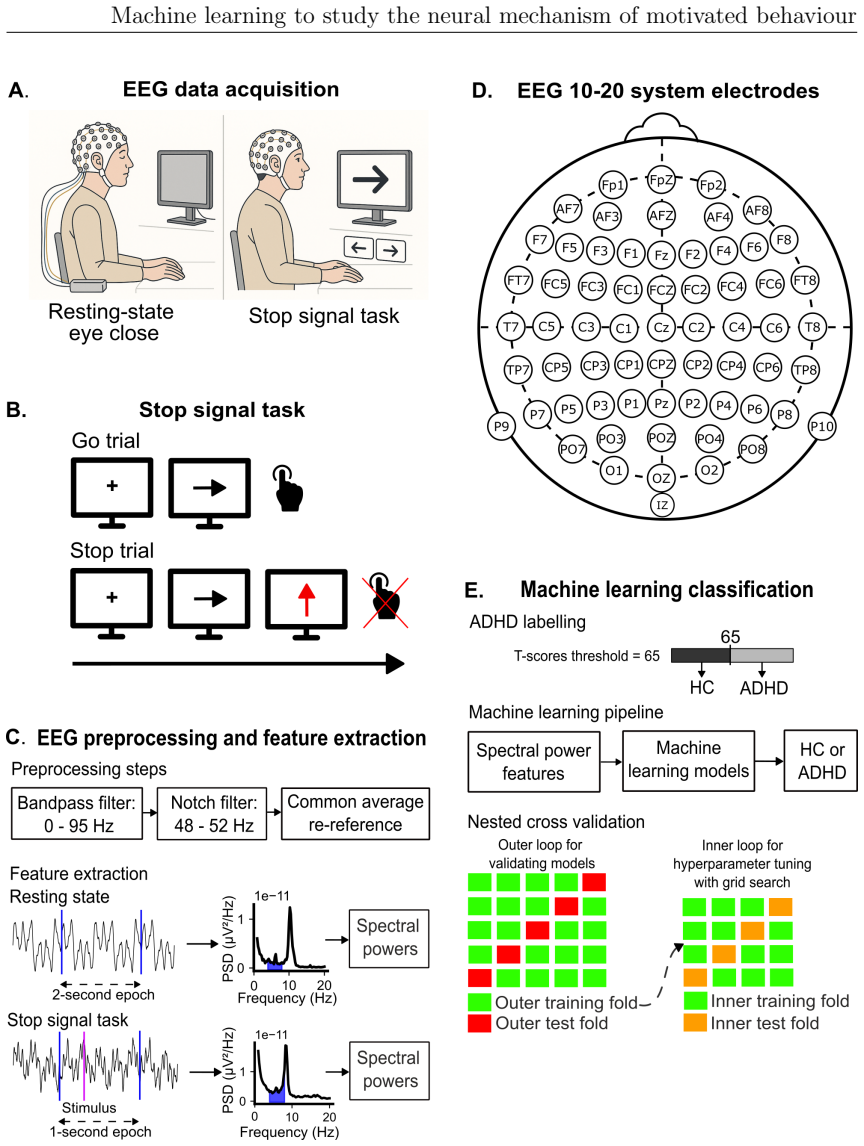
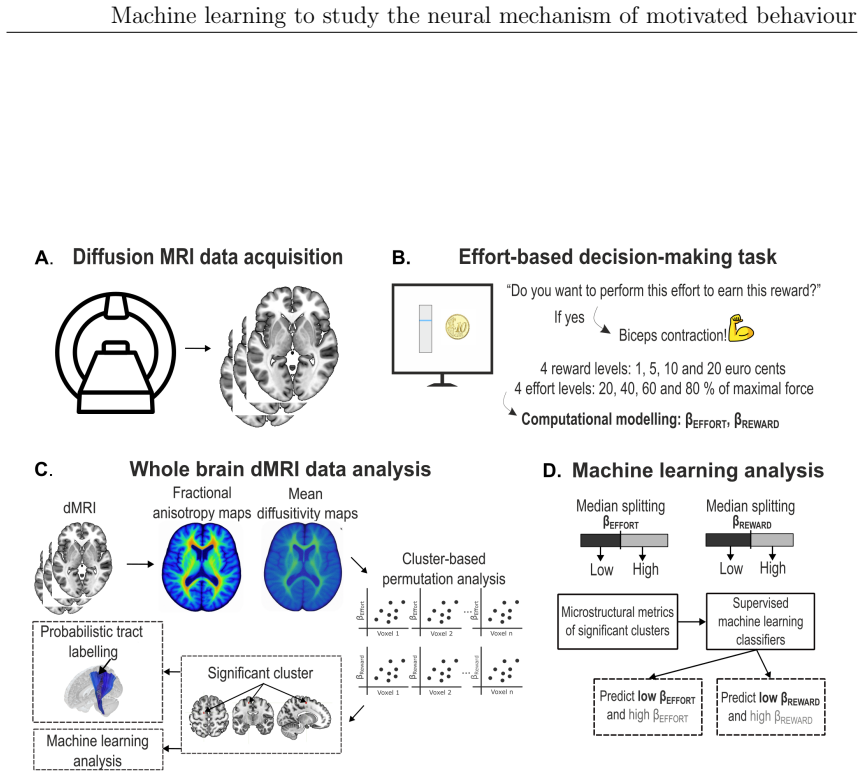
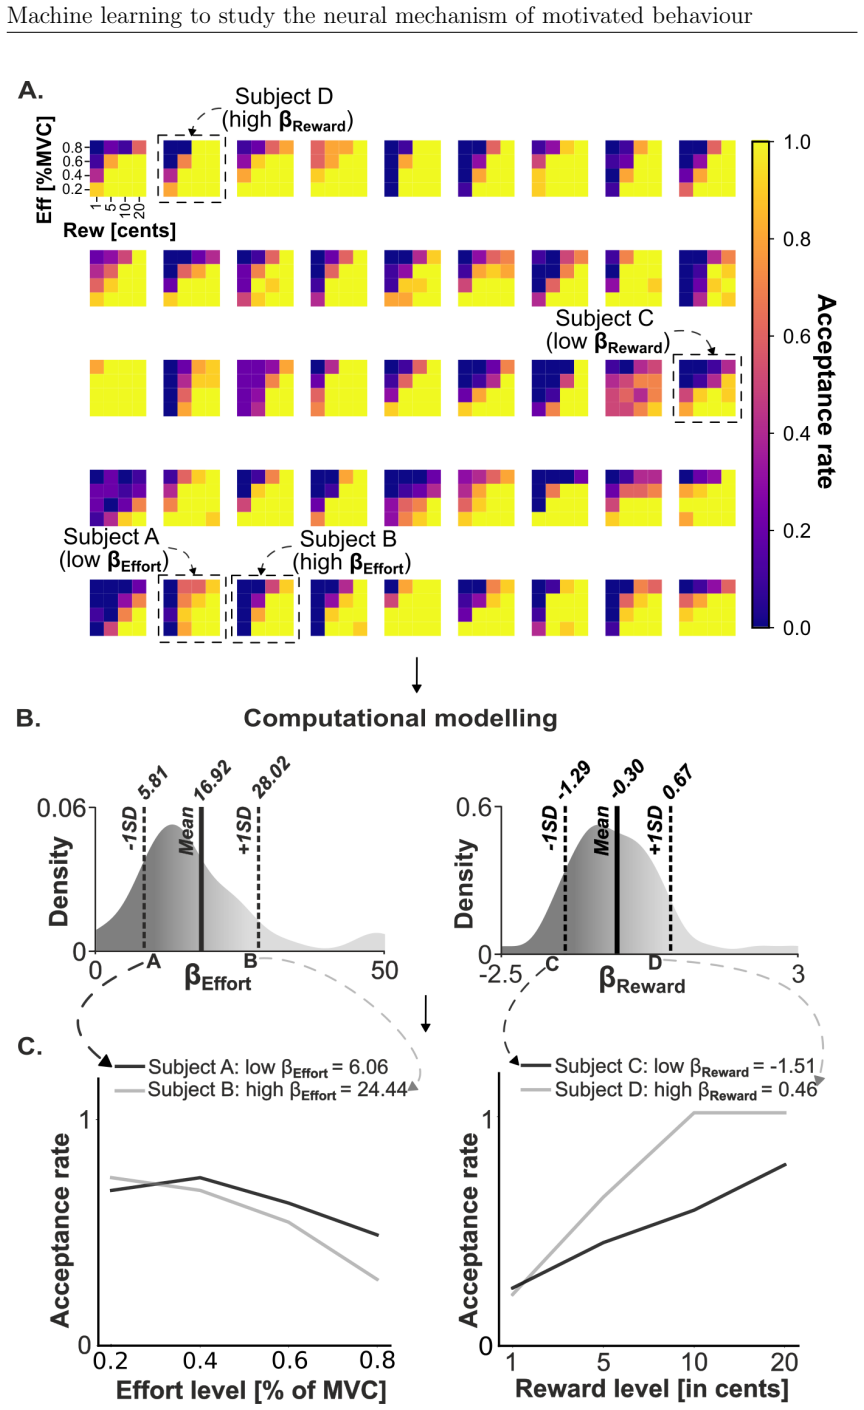
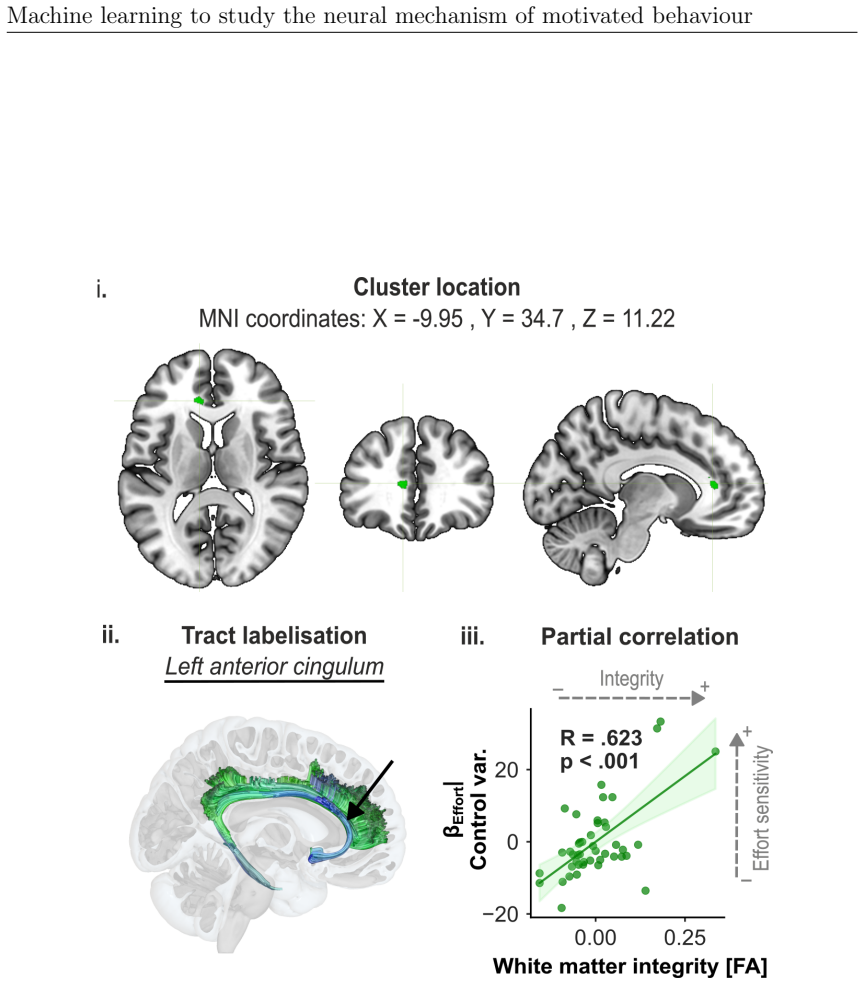
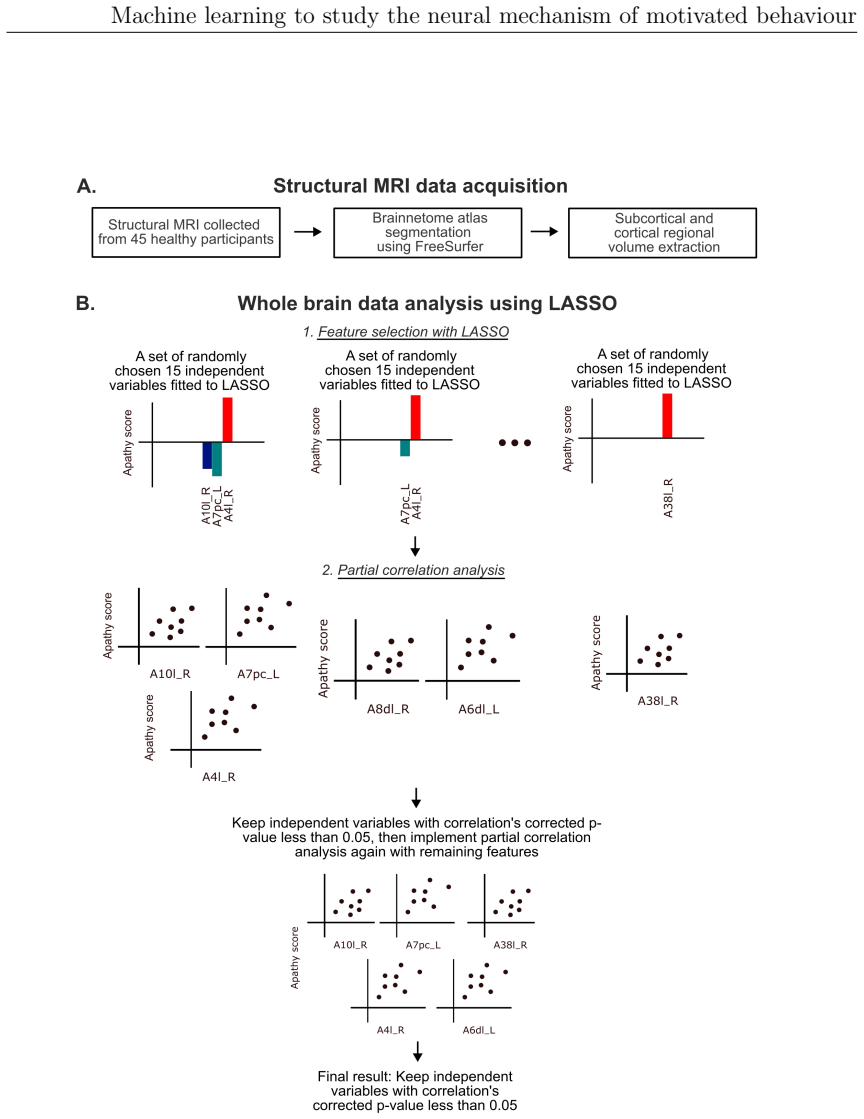
Motivated behaviour relies on the brain's capacity to evaluate effort and reward. Dysregulation within these processes contributes to a spectrum of conditions, from hyperactivity in attention-deficit/hyperactivity disorder (ADHD) to diminished goal-directed behaviour in apathy. This thesis investigates the neural mechanisms underlying ADHD using electroencephalography (EEG) and examines individual differences in effort and reward sensitivity using neuroimaging, applying machine learning approaches through three main studies. In Study 1, task-based and resting-state EEG were employed with machine learning models to classify adult individuals with ADHD and healthy controls. Machine learning classifiers trained on task-based EEG during a stop signal task outperformed those trained on resting-state EEG, with the strongest predictive features arising from gamma-band spectral power over fronto-central and parietal regions. In Study 2, diffusion MRI and whole-brain permutation-based analyses identified associations between white matter integrity and computationally modelled parameters reflecting effort and reward sensitivity, with SMA-connected tracts emerging as a central hub. In Study 3, grey matter volumes from structural T1-weighted MRI were used to examine correlates of effort sensitivity, reward sensitivity, and subclinical apathy, with machine learning confirming robust decoding of reward sensitivity and apathy levels. Across studies, fronto-parietal circuits emerged as central to effort valuation and reward processing. These findings may serve as neural biomarkers for improving diagnostic accuracy in ADHD and motivational impairments, and for guiding personalised neurotechnological interventions.
Editorial analysis
A structured set of objections, weighed in public.
Referee Report
Summary. This manuscript reports three studies applying machine learning to EEG and neuroimaging data to investigate neural mechanisms of motivated behavior, focusing on ADHD classification and individual differences in effort/reward sensitivity. Study 1 shows task-based EEG (stop-signal task) classifiers outperform resting-state EEG for ADHD vs. control classification, with key features in gamma-band spectral power over fronto-central and parietal regions. Study 2 uses diffusion MRI and whole-brain permutation analyses to link white-matter integrity (especially SMA-connected tracts) to computationally modeled effort and reward parameters. Study 3 applies structural MRI grey-matter volumes and ML to decode reward sensitivity and subclinical apathy. The work concludes that fronto-parietal circuits are central to effort valuation and reward processing and may serve as biomarkers for ADHD diagnosis and motivational impairments.
Significance. If the reported associations and classification advantages prove robust after proper validation, the work could contribute neural biomarkers for ADHD and apathy, bridging computational modeling of effort/reward with multi-modal imaging and ML. The multi-study design linking task-based EEG, white-matter tracts, and grey-matter correlates is a strength, as is the focus on fronto-parietal hubs. These elements could inform personalized interventions if generalizability is demonstrated. Current impact is constrained by missing validation details.
major comments (3)
- [Abstract] Abstract: The claim that task-based EEG classifiers outperformed resting-state ones, with strongest features from gamma-band power over fronto-central/parietal regions, supplies no cross-validation details, sample sizes, performance metrics with effect sizes, or multiple-comparison corrections. These omissions are load-bearing for the central classification-performance claim and prevent assessment of whether results exceed chance or overfitting.
- [Abstract] Abstract: The biomarker interpretation—that fronto-parietal circuits can improve diagnostic accuracy in ADHD and motivational impairments—requires evidence of generalizability beyond the three specific cohorts, tasks, and scanners. No out-of-sample testing, external validation, or confound controls (e.g., medication status, head motion, IQ) are mentioned, which is essential for the claim that identified features reflect general mechanisms rather than sample-specific effects.
- [Study 2] Study 2 (permutation-based analyses): The reported associations between SMA-connected white-matter tracts and effort/reward parameters need explicit confirmation of whole-brain multiple-comparison correction and confound regression; without these, the central-hub interpretation risks being driven by unmeasured variables or uncorrected tests.
minor comments (2)
- [Abstract] Abstract: Specify the exact ML algorithms (e.g., SVM, random forest) and the computational modeling framework used to derive effort/reward parameters; this would improve reproducibility and clarity.
- [Discussion] The manuscript should include a dedicated limitations paragraph addressing generalizability across scanners, tasks, and populations, as well as the absence of longitudinal or interventional validation.
Simulated Author's Rebuttal
We thank the referee for their constructive and detailed feedback on our manuscript. We have addressed each major comment below and will revise the manuscript accordingly to improve clarity, rigor, and transparency.
read point-by-point responses
-
Referee: [Abstract] Abstract: The claim that task-based EEG classifiers outperformed resting-state ones, with strongest features from gamma-band power over fronto-central/parietal regions, supplies no cross-validation details, sample sizes, performance metrics with effect sizes, or multiple-comparison corrections. These omissions are load-bearing for the central classification-performance claim and prevent assessment of whether results exceed chance or overfitting.
Authors: We agree that the abstract must be self-contained and include sufficient methodological and statistical details to evaluate the classification results. Although these elements (cross-validation procedure, sample sizes, performance metrics with effect sizes, and multiple-comparison corrections via permutation testing and FDR) are reported in the full text of Study 1, we will revise the abstract to concisely summarize them. This will allow readers to assess whether the task-based EEG advantage exceeds chance levels and overfitting risks. revision: yes
-
Referee: [Abstract] Abstract: The biomarker interpretation—that fronto-parietal circuits can improve diagnostic accuracy in ADHD and motivational impairments—requires evidence of generalizability beyond the three specific cohorts, tasks, and scanners. No out-of-sample testing, external validation, or confound controls (e.g., medication status, head motion, IQ) are mentioned, which is essential for the claim that identified features reflect general mechanisms rather than sample-specific effects.
Authors: We acknowledge that the biomarker interpretation must be presented with appropriate caution regarding generalizability. The current studies are limited to the described cohorts and acquisition protocols, and we do not provide external validation or out-of-sample testing. In the revised manuscript, we will temper the language in the abstract and discussion, explicitly note the absence of external validation, detail any confound controls already implemented (e.g., medication status, head motion, IQ where available), and add a dedicated limitations section highlighting the need for future multi-site replication to establish broader applicability. revision: partial
-
Referee: [Study 2] Study 2 (permutation-based analyses): The reported associations between SMA-connected white-matter tracts and effort/reward parameters need explicit confirmation of whole-brain multiple-comparison correction and confound regression; without these, the central-hub interpretation risks being driven by unmeasured variables or uncorrected tests.
Authors: We agree that explicit confirmation of the statistical controls is essential. In Study 2, whole-brain permutation testing with threshold-free cluster enhancement was used to correct for multiple comparisons across the brain, and linear regression was applied to remove variance associated with confounds including age, sex, and head motion before assessing associations with effort and reward parameters. We will revise the methods and results sections to state these procedures explicitly and confirm that the SMA-connected tract findings survived correction, thereby strengthening the central-hub interpretation. revision: yes
Circularity Check
No circularity: empirical ML associations on independent cohorts with no derivations or self-referential predictions
full rationale
The manuscript reports three separate empirical studies applying standard ML classifiers and permutation tests to EEG, dMRI, and sMRI data. No equations, first-principles derivations, or model-based predictions appear; all reported features, accuracies, and tract associations are direct outputs of data-driven fitting on the described cohorts. No self-citation chain, ansatz smuggling, or renaming of known results is invoked to justify the central claims. The work is therefore self-contained against external benchmarks and receives the default non-circularity finding.
Axiom & Free-Parameter Ledger
Reference graph
Works this paper leans on
-
[1]
Amini and S
M. Amini and S. Chang. A review of machine learning approaches for high di- mensional process monitoring. InProceedings of the 2018 Industrial and Systems Engineering Research Conference,
2018
-
[2]
ISSN 1388-2457. doi: https://doi. org/10.1016/S1388-2457(01)00488-6. URLhttps://www.sciencedirect.com/ science/article/pii/S1388245701004886. M. Colom, I. Kraev, A. K. Stramek, I. B. Loza, C. L. Rostron, C. J. Heath, E. J. Dommett, and B. F. Singer. Conditioning-and reward-related dendritic and presy- naptic plasticity of nucleus accumbens neurons in male...
-
[3]
S. B. Floresco, D. R. Montes, M. Maric, and M. van Holstein. Differential con- tributions of nucleus accumbens subregions to cue-guided risk/reward decision making and implementation of conditional rules.Journal of Neuroscience, 38(8): 1901–1914,
1901
-
[4]
T. Hai, R. Swansburg, C. K. Kahl, H. Frank, K. Stone, J.-F. Lemay, and F. P. MacMaster. Right superior frontal gyrus cortical thickness in pediatric adhd. Journal of Attention Disorders, 26(14):1895–1906,
1906
-
[5]
L. M. Jenkins, L. Wang, H. Rosen, and S. Weintraub. A transdiagnostic review of neuroimaging studies of apathy and disinhibition in dementia.Brain, 145(6): 1886–1905,
1905
-
[6]
Kiiski, M
H. Kiiski, M. Bennett, L. M. Rueda-Delgado, F. R. Farina, R. Knight, R. Boyle, D. Roddy, K. Grogan, J. Bramham, C. Kelly, et al. Eeg spectral power, but not theta/beta ratio, is a neuromarker for adult adhd.European Journal of Neuro- science, 51(10):2095–2109,
2095
-
[7]
doi: 10.1037/0894-4105.13.3.424. A. Morin, J. Bernard, G. Carle, A. Ponchel, C. Azuar, G. Uggocioni, T. Mauras, D. Bendetowicz, M. Camus, A. Delcul, et al. Chronic apathy following a major depressive episode: what is it?Cortex,
-
[8]
doi: https: //doi.org/10.1016/j.parkreldis.2008.07.006
ISSN 1353-8020. doi: https: //doi.org/10.1016/j.parkreldis.2008.07.006. URLhttps://www.sciencedirect. com/science/article/pii/S1353802008002319. F. Pedregosa, G. Varoquaux, A. Gramfort, V. Michel, B. Thirion, O. Grisel, M. Blon- del, P. Prettenhofer, R. Weiss, V. Dubourg, et al. Scikit-learn: Machine learning in python.the Journal of machine Learning rese...
-
[9]
Peretzke, P
R. Peretzke, P. F. Neher, G. A. Brandt, S. Fritze, S. Volkmer, J. Daub, G. Northoff, J. Bohn, Y. Kirchhoff, S. Roy, et al. Deciphering white matter microstructural alterations in catatonia according to icd-11: replication and machine learning analysis.Molecular psychiatry, 30(5):2095–2107,
2095
-
[10]
Sheelakumari, C
R. Sheelakumari, C. Bineesh, T. Varghese, C. Kesavadas, J. Verghese, and P. S. Mathuranath. Neuroanatomical correlates of apathy and disinhibition in be- havioural variant frontotemporal dementia.Brain imaging and behavior, 14(5): 2004–2011,
2004
-
[11]
Pingouin: statistics in Python , volume =
doi: 10.21105/joss.01026. URLhttps://doi.org/10.21105/joss. 01026. M. A. Van Der Meer and A. D. Redish. Covert expectation-of-reward in rat ventral striatum at decision points.Frontiers in integrative neuroscience, 3:458,
-
[12]
Performance was quantified using AUC, and statistical comparisons were corrected for multiple comparisons using the false discovery rate (FDR)
Pre-examination copy - 021225 194 Appendices .1 Appendix materials for chapter 3 Ablation study method:In addition to the main analysis, we examined the impact of targeted feature removal on classification performance for resting-state and task-related EEG data (see Figure .1.1). Performance was quantified using AUC, and statistical comparisons were corre...
2011
discussion (0)
Sign in with ORCID, Apple, or X to comment. Anyone can read and Pith papers without signing in.