Multi-Level Temporal Graph Networks with Local-Global Fusion for Industrial Fault Diagnosis
Pith reviewed 2026-05-10 05:37 UTC · model grok-4.3
The pith
The multi-level temporal graph network with local-global fusion captures dynamic sensor relations to improve industrial fault diagnosis.
A machine-rendered reading of the paper's core claim, the machinery that carries it, and where it could break.
Core claim
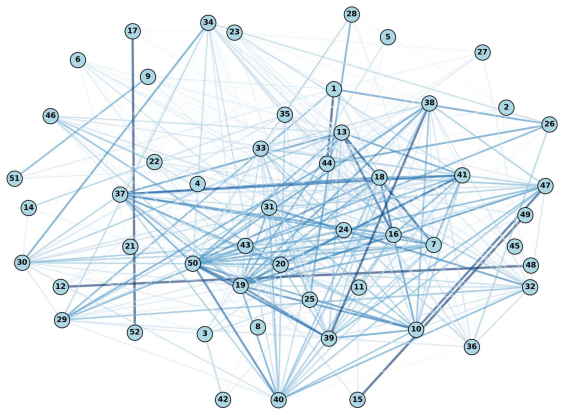
The central contribution is a structure-aware multi-level temporal graph network that first constructs a correlation graph dynamically using Pearson correlation coefficients to model relationships among process variables. Temporal features are then extracted using an LSTM-based encoder, spatial dependencies are learned via graph convolution layers, and a multi-level pooling mechanism coarsens the graph to capture higher-level patterns while retaining key details. A fusion step combines local and global features for the final fault prediction.
What carries the argument
The multi-level temporal graph network with local-global feature fusion, which uses dynamic Pearson correlation graphs combined with LSTM encoding, graph convolutions, progressive pooling, and feature fusion to handle local, global, and dynamic relations.
If this is right
- Outperforms various baseline methods on the Tennessee Eastman process, especially for complex fault scenarios.
- Effectively captures local, global, and dynamic relations among sensors that traditional GNNs overlook.
- Enables better fault diagnosis leading to optimal and safe operation of industrial processes.
- Preserves important fault-related details through multi-level coarsening and fusion.
Where Pith is reading between the lines
- The approach might generalize to other industrial monitoring tasks involving high-dimensional sensor streams.
- Real-time implementation could allow for proactive fault prevention rather than reactive diagnosis.
- Alternative graph construction methods, such as using mutual information, could be compared to assess robustness of the Pearson-based dynamic graph.
Load-bearing premise
That constructing the correlation graph dynamically with Pearson coefficients and combining it with LSTM, graph convolutions, and multi-level pooling will capture all necessary relations without losing critical fault information or adding noise.
What would settle it
A test on a different industrial process dataset showing that the model does not achieve higher diagnosis accuracy than simpler LSTM-only or static GNN baselines for complex faults.
Figures




read the original abstract
Fault detection and diagnosis are critical for the optimal and safe operation of industrial processes. The correlations among sensors often display non-Euclidean structures where graph neural networks (GNNs) are widely used therein. However, for large-scale systems, local, global, and dynamic relations extensively exist among sensors, and traditional GNNs often overlook such complex and multi-level structures for various problems including the fault diagnosis. To address this issue, we propose a structure-aware multi-level temporal graph network with local-global feature fusion for industrial fault diagnosis. First, a correlation graph is dynamically constructed using Pearson correlation coefficients to capture relationships among process variables. Then, temporal features are extracted through long short-term memory (LSTM)-based encoder, whereas the spatial dependencies among sensors are learned by graph convolution layers. A multi-level pooling mechanism is used to gradually coarsen and learn meaningful graph structures, to capture higher-level patterns while keeping important fault related details. Finally, a fusion step is applied to combine both detailed local features and overall global patterns before the final prediction. Experimental evaluations on the Tennessee Eastman process (TEP) demonstrate that the proposed model achieves superior fault diagnosis performance, particularly for complex fault scenarios, outperforming various baseline methods.
Editorial analysis
A structured set of objections, weighed in public.
Referee Report
Summary. The manuscript proposes a multi-level temporal graph network with local-global fusion for industrial fault diagnosis. It dynamically constructs a sensor correlation graph via Pearson coefficients, extracts temporal features using an LSTM encoder, models spatial dependencies with graph convolution layers, applies multi-level pooling to coarsen the graph while retaining fault details, and fuses local and global patterns for final prediction. Experimental evaluations on the Tennessee Eastman process (TEP) are stated to demonstrate superior fault diagnosis performance, especially on complex faults, relative to various baseline methods.
Significance. If the performance claims are supported by rigorous experiments, the work could usefully extend GNN-based methods for process monitoring by explicitly handling multi-scale sensor relations through pooling and fusion. The pipeline combines established components (Pearson graphs, LSTM, GCN) in a structured way that may help preserve critical details in large-scale industrial systems.
major comments (2)
- [§3.1 (Correlation Graph Construction)] §3.1 (Correlation Graph Construction): The claim that the graph is 'dynamically constructed' using Pearson correlation coefficients requires explicit specification of the computation procedure. If the adjacency matrix is computed once over the full training set (standard practice for Pearson-based time-series graphs), the graph is static rather than adaptive per time step or sample. This would reduce the model to a static-graph temporal GNN, undermining the motivation for local-global fusion to capture time-varying fault relations and weakening the explanation for gains on complex TEP faults.
- [§4 (Experiments)] §4 (Experiments): The central claim of superior performance on complex TEP faults rests on unverified assertions in the absence of detailed quantitative evidence. The experimental section must include per-fault metrics (e.g., accuracy/F1 tables), explicit baseline descriptions, ablation results isolating the multi-level pooling and fusion steps, and error analysis comparing simple vs. complex faults. Without these, it is impossible to confirm that outperformance stems from the proposed architecture rather than implementation details or data characteristics.
minor comments (2)
- [Abstract] Abstract: A single key quantitative result (e.g., overall accuracy improvement or F1 on complex faults) should be added to substantiate the superiority claim and allow readers to gauge effect size immediately.
- [Notation and Equations] Notation: The local-global fusion operation should be expressed with a clear equation (including input/output dimensions) to improve reproducibility and allow precise comparison with related fusion techniques.
Simulated Author's Rebuttal
We thank the referee for the constructive and detailed feedback on our manuscript. We have carefully reviewed the major comments and provide point-by-point responses below. We will make the necessary revisions to the manuscript to address the concerns.
read point-by-point responses
-
Referee: [§3.1 (Correlation Graph Construction)] §3.1 (Correlation Graph Construction): The claim that the graph is 'dynamically constructed' using Pearson correlation coefficients requires explicit specification of the computation procedure. If the adjacency matrix is computed once over the full training set (standard practice for Pearson-based time-series graphs), the graph is static rather than adaptive per time step or sample. This would reduce the model to a static-graph temporal GNN, undermining the motivation for local-global fusion to capture time-varying fault relations and weakening the explanation for gains on complex TEP faults.
Authors: We thank the referee for highlighting this important clarification point. In the current implementation, the Pearson correlation coefficients are computed once over the full training set to construct the adjacency matrix, which is then held fixed for all samples. We will revise Section 3.1 to explicitly describe this computation procedure in detail, including the exact formula and data used. While this makes the graph topology static, the model still captures time-varying aspects through the LSTM temporal encoder (which processes sequential features adaptively), the multi-level pooling that learns hierarchical representations, and the local-global fusion that integrates multi-scale patterns. We will update the abstract, introduction, and motivation sections to more precisely reflect this design choice and explain how these components enable superior performance on complex faults without requiring a per-sample dynamic graph. This revision will strengthen rather than undermine the contribution. revision: yes
-
Referee: [§4 (Experiments)] §4 (Experiments): The central claim of superior performance on complex TEP faults rests on unverified assertions in the absence of detailed quantitative evidence. The experimental section must include per-fault metrics (e.g., accuracy/F1 tables), explicit baseline descriptions, ablation results isolating the multi-level pooling and fusion steps, and error analysis comparing simple vs. complex faults. Without these, it is impossible to confirm that outperformance stems from the proposed architecture rather than implementation details or data characteristics.
Authors: We fully agree that the experimental section requires more rigorous quantitative support to substantiate the claims. In the revised manuscript, we will expand Section 4 as follows: (1) add a detailed table reporting accuracy and F1-score for each of the 21 individual faults in the TEP dataset, with explicit grouping of simple versus complex faults; (2) provide complete descriptions of all baseline methods, including their architectures, hyperparameters, and implementation details; (3) include ablation studies that systematically remove or isolate the multi-level pooling mechanism and the local-global fusion module to quantify their individual contributions; and (4) add an error analysis subsection with comparisons of misclassification rates, confusion patterns, and performance differences between simple and complex faults. These additions will allow readers to verify that the reported gains arise from the proposed architecture. revision: yes
Circularity Check
No circularity: empirical model evaluation independent of inputs
full rationale
The paper describes an architecture that combines Pearson correlation for graph construction, LSTM temporal encoding, graph convolutions, multi-level pooling, and local-global fusion. These are standard externally defined components whose outputs are not mathematically forced to equal the reported fault diagnosis accuracy. The central claim of superior performance on TEP faults is an empirical result measured against held-out data and baselines, not a derivation that reduces to the model definition by construction. No equations, self-citations, or fitted-input-as-prediction steps are present that would trigger any of the enumerated circularity patterns. The skeptic concern about static vs. dynamic Pearson graphs pertains to implementation details and assumption validity, not to circular reduction of the result to its inputs.
Axiom & Free-Parameter Ledger
axioms (1)
- domain assumption Pearson correlation coefficients capture meaningful dynamic relationships among process variables
Reference graph
Works this paper leans on
-
[1]
Graph neural network-based fault diagnosis: a review,
Zhiwen Chen, Jiamin Xu, Cesare Alippi, Steven X Ding, Yuri Shardt, Tao Peng, and Chunhua Yang. Graph neural network-based fault diagnosis: A review.arXiv preprint arXiv:2111.08185, 2021
-
[2]
Aleksandr Kovalenko, Vitaliy Pozdnyakov, and Ilya Makarov. Graph neural networks with trainable adjacency matrices for fault diagnosis on multivariate sensor data.IEEE Access, 2024
work page 2024
-
[3]
Review on chemical process fault detection and diagnosis
Liang Ming and Jinsong Zhao. Review on chemical process fault detection and diagnosis. In 2017 6th International Symposium on Advanced Control of Industrial Processes (AdCONIP), pages 457–462, 2017
work page 2017
-
[4]
S Joe Qin. Data-driven fault detection and diagnosis for complex industrial processes.IFAC Proceedings Volumes, 42(8):1115–1125, 2009
work page 2009
-
[5]
Andreas Lundgren and Daniel Jung. Data-driven fault diagnosis analysis and open-set clas- sification of time-series data.Control Engineering Practice, 121:105006, 2022
work page 2022
-
[6]
Rolf Isermann. Model-based fault-detection and diagnosis–status and applications.Annual Reviews in Control, 29(1):71–85, 2005
work page 2005
-
[7]
Nelly Olivier-Maget, Gilles Hetreux, Jean Marc Le Lann, and Marie Veronique Le Lann. Model-based fault diagnosis for hybrid systems: Application on chemical processes.Com- puters & Chemical Engineering, 33(10):1617–1630, 2009
work page 2009
-
[8]
Yuanfang Chi, Yanjie Dong, Z Jane Wang, F Richard Yu, and Victor CM Leung. Knowledge- based fault diagnosis in industrial internet of things: a survey.IEEE Internet of Things Journal, 9(15):12886–12900, 2022
work page 2022
-
[9]
Qingchao Jiang, Xuefeng Yan, and Weixiang Zhao. Fault detection and diagnosis in chemical processes using sensitive principal component analysis.Industrial & Engineering Chemistry Research, 52(4):1635–1644, 2013. 17
work page 2013
-
[10]
Xiaohui Yang, Songhong Rui, Xiaolong Zhang, Shaoping Xu, Chunsheng Yang, and Peter X Liu. Fault diagnosis in chemical processes based on class-incremental fda and pca.IEEE Access, 7:18164–18171, 2019
work page 2019
-
[11]
Saif SS Al-Wahaibi, Samuel Abiola, Myisha A Chowdhury, and Qiugang Lu. Improving convolutional neural networks for fault diagnosis in chemical processes by incorporating global correlations.Computers & Chemical Engineering, 176:108289, 2023
work page 2023
-
[12]
Zuyu Yin and Jian Hou. Recent advances on SVM based fault diagnosis and process moni- toring in complicated industrial processes.Neurocomputing, 174:643–650, 2016
work page 2016
-
[13]
Knn based fault diagnosis system for induction motor
S Samanta, JN Bera, and G Sarkar. Knn based fault diagnosis system for induction motor. In 2016 2nd International Conference on Control, Instrumentation, Energy & Communication (CIEC), pages 304–308. IEEE, 2016
work page 2016
-
[14]
Heng-Chao Yan, Jun-Hong Zhou, and Chee Khiang Pang. Gaussian mixture model using semisupervised learning for probabilistic fault diagnosis under new data categories.IEEE Transactions on Instrumentation and Measurement, 66(4):723–733, 2017
work page 2017
-
[15]
S Saeid Moosavi, Abdesslem Djerdir, Youcef Ait-Amirat, and Davod Arab Khaburi. ANN based fault diagnosis of permanent magnet synchronous motor under stator winding shorted turn.Electric Power Systems Research, 125:67–82, 2015
work page 2015
-
[16]
Hao Wu and Jinsong Zhao. Deep convolutional neural network model based chemical pro- cess fault diagnosis.Computers & chemical engineering, 115:185–197, 2018
work page 2018
-
[17]
Qiusheng Song and Peng Jiang. A multi-scale convolutional neural network based fault di- agnosis model for complex chemical processes.Process Safety and Environmental Protection, 159:575–584, 2022
work page 2022
-
[18]
Olivier Janssens, Viktor Slavkovikj, Bram Vervisch, Kurt Stockman, Mia Loccufier, Steven Verstockt, Rik Van de Walle, and Sofie Van Hoecke. Convolutional neural network based fault detection for rotating machinery.Journal of Sound and Vibration, 377:331–345, 2016
work page 2016
-
[19]
A graph neural network-based bearing fault detection method.Scientific Reports, 13(1):5286, 2023
Lu Xiao, Xiaoxin Yang, and Xiaodong Yang. A graph neural network-based bearing fault detection method.Scientific Reports, 13(1):5286, 2023
work page 2023
-
[20]
Jianbo Yu and Yue Zhang. Challenges and opportunities of deep learning-based process fault detection and diagnosis: A review.Neural Computing and Applications, 35(1):211–252, 2023
work page 2023
-
[21]
Yalin Wang, Zhuofu Pan, Xiaofeng Yuan, Chunhua Yang, and Weihua Gui. A novel deep learning based fault diagnosis approach for chemical process with extended deep belief net- work.ISA Transactions, 96:457–467, 2020. 18
work page 2020
-
[22]
Junjun Zhu, Quansheng Jiang, Yehu Shen, Chenhui Qian, Fengyu Xu, and Qixin Zhu. Ap- plication of recurrent neural network to mechanical fault diagnosis: A review.Journal of Mechanical Science and Technology, 36(2):527–542, 2022
work page 2022
-
[23]
Long Wen, Xinyu Li, and Liang Gao. A transfer convolutional neural network for fault diag- nosis based on resnet-50.Neural Computing and Applications, 32(10):6111–6124, 2020
work page 2020
-
[24]
Micha ¨el Defferrard, Xavier Bresson, and Pierre Vandergheynst. Convolutional neural net- works on graphs with fast localized spectral filtering.Advances in Neural Information Process- ing Systems, 29, 2016
work page 2016
-
[25]
Jie Liu, Zihan He, and Yonghao Miao. Causality-based adversarial attacks for robust gnn modelling with application in fault detection.Reliability Engineering & System Safety, 252:110464, 2024
work page 2024
-
[26]
Multivariate time-series anomaly detection via graph attention network
Hang Zhao, Yujing Wang, Juanyong Duan, Congrui Huang, Defu Cao, Yunhai Tong, Bixiong Xu, Jing Bai, Jie Tong, and Qi Zhang. Multivariate time-series anomaly detection via graph attention network. In2020 IEEE International Conference on Data Mining (ICDM), pages 841–
-
[27]
Zhitao Ying, Jiaxuan You, Christopher Morris, Xiang Ren, Will Hamilton, and Jure Leskovec. Hierarchical graph representation learning with differentiable pooling.Advances in Neural Information Processing Systems, 31, 2018
work page 2018
-
[28]
Zhen Zhang, Jiajun Bu, Martin Ester, Jianfeng Zhang, Zhao Li, Chengwei Yao, Huifen Dai, Zhi Yu, and Can Wang. Hierarchical multi-view graph pooling with structure learning.IEEE Transactions on Knowledge and Data Engineering, 35(1):545–559, 2021
work page 2021
-
[29]
Dongyue Chen, Zongxia Xie, Ruonan Liu, Wenlong Yu, Qinghua Hu, Xianling Li, and Steven X Ding. Bayesian hierarchical graph neural networks with uncertainty feedback for trustworthy fault diagnosis of industrial processes.IEEE Transactions on Neural Networks and Learning Systems, 2023
work page 2023
-
[30]
Kai Zhong, Bing Han, Min Han, and Hongtian Chen. Hierarchical graph convolutional net- works with latent structure learning for mechanical fault diagnosis.IEEE/ASME Transactions on Mechatronics, 28(6):3076–3086, 2023
work page 2023
-
[31]
Guoqian Jiang, Kaili Shen, Xiufeng Liu, Xu Cheng, and Ping Xie. Hierarchical spatio- temporal graph network for fault diagnosis of industrial processes.IEEE Internet of Things Journal, 2024
work page 2024
-
[32]
E Jiawei, Yinglong Zhang, Shangying Yang, Hong Wang, Xuewen Xia, and Xing Xu. Graph- sage++: Weighted multi-scale gnn for graph representation learning.Neural Processing Letters, 56(1):24, 2024. 19
work page 2024
-
[33]
Cory A Rieth, Ben D Amsel, Randy Tran, and Maia B Cook. Additional tennessee eastman process simulation data for anomaly detection evaluation.Harvard Dataverse, 1:2017, 2017
work page 2017
-
[34]
James J Downs and Ernest F Vogel. A plant-wide industrial process control problem.Com- puters & Chemical Engineering, 17(3):245–255, 1993
work page 1993
-
[35]
Qiugang Lu and Saif SS Al-Wahaibi. Enhanced cnn with global features for fault diagnosis of complex chemical processes.arXiv preprint arXiv:2210.01727, 2022
-
[36]
Ting Huang, Qiang Zhang, Xiaoan Tang, Shuangyao Zhao, and Xiaonong Lu. A novel fault diagnosis method based on cnn and lstm and its application in fault diagnosis for complex systems.Artificial Intelligence Review, 55(2):1289–1315, 2022
work page 2022
-
[37]
Spatio-temporal graph convolutional networks: A deep learning framework for traffic forecasting
Bing Yu, Haotian Yin, and Zhanxing Zhu. Spatio-temporal graph convolutional networks: A deep learning framework for traffic forecasting. InInternational Joint Conference on Artificial Intelligence (IJCAI), 2018
work page 2018
-
[38]
Petar Veli ˇckovi´c, Guillem Cucurull, Arantxa Casanova, Adriana Romero, Pietro Lio, and Yoshua Bengio. Graph attention networks. InInternational Conference on Learning Representa- tions (ICLR), 2018. 20
work page 2018
discussion (0)
Sign in with ORCID, Apple, or X to comment. Anyone can read and Pith papers without signing in.