Recognition: unknown
Complexity of Linear Regions in Self-supervised Deep ReLU Networks
Pith reviewed 2026-05-08 04:13 UTC · model grok-4.3
The pith
Self-supervised ReLU networks achieve comparable accuracy with substantially fewer linear regions than supervised models.
A machine-rendered reading of the paper's core claim, the machinery that carries it, and where it could break.
Core claim
The central claim is that the local distribution of linear regions in self-supervised ReLU networks correlates with representation quality. On MNIST and FashionMNIST, self-supervised models create substantially fewer regions while matching supervised accuracy. Contrastive methods expand the number of regions over training time, whereas self-distillation methods consolidate complexity by merging adjacent regions. Representation collapse can be detected early through changes in the geometric properties of these regions, and the analysis indicates that polytopal metrics reliably signal representation quality and downstream performance.
What carries the argument
SplineCam-extracted two-dimensional polytopes near the data distribution, used to count and characterize linear regions by number, area, eccentricity, and boundaries throughout training.
If this is right
- Self-supervised models can match supervised accuracy while maintaining lower linear region complexity.
- Contrastive self-supervised training produces rapid growth in region count over epochs.
- Self-distillation training reduces region count by merging neighboring polytopes.
- Changes in region geometry allow early detection of representation collapse before accuracy drops.
- Polytopal metrics such as count and eccentricity can serve as proxies for representation quality across tasks.
Where Pith is reading between the lines
- Training objectives could be designed to explicitly encourage or limit region merging for more efficient representations.
- The observed patterns might be tested on other architectures such as transformers with ReLU-like activations to check generality.
- Monitoring region dynamics could become a lightweight diagnostic for deciding when to stop pretraining or adjust loss weights.
- This geometric view connects to questions about how representation learning simplifies the effective decision surface in high dimensions.
Load-bearing premise
That the local two-dimensional polytopes sampled near the data distribution are representative of the full high-dimensional linear region complexity and directly reflect representation quality.
What would settle it
If the same SplineCam analysis on a higher-dimensional dataset such as CIFAR-10 shows no correlation between the number or shape of linear regions and downstream accuracy, the claimed link between local polytopal metrics and representation quality would be refuted.
Figures


read the original abstract
There has been growing interest in studying the complexity of Rectified Linear Unit (ReLU) based activation networks. Recent work investigates the evolution of the number of piecewise-linear partitions (linear regions) that are formed during training. However, current research is limited to examining the complexity of models trained in a supervised way. Self-Supervised Learning (SSL) differs in that it directly optimises the representation space using a loss function to enhance the model's performance across multiple downstream tasks. This study investigates the local distribution of linear regions produced by SSL models. We demonstrate that the evolution of linear regions correlates with the representation quality by utilising SplineCam to extract two-dimensional polytopes near the data distribution. We track the number, area, eccentricity, and boundaries of regions throughout training. The study compares supervised, contrastive, and self-distillation methods over two standard benchmark datasets, MNIST and FashionMNIST. The analysis of the experimental results shows that self-supervised methods create substantially fewer regions to achieve comparable accuracy to supervised models. Contrastive methods rapidly expand regions over time, whereas self-distillation methods tend to consolidate by merging neighbouring regions. Lastly, we can detect representation collapse early within the geometric space of linear regions. Our analysis suggests that polytopal metrics can serve as reliable indicators of representation quality and model performance.
Editorial analysis
A structured set of objections, weighed in public.
Referee Report
Summary. The paper examines the evolution of linear regions in ReLU networks trained via self-supervised learning (SSL) on MNIST and FashionMNIST, using SplineCam to extract local 2D polytopes near the data distribution. It claims that SSL models achieve comparable accuracy to supervised models using substantially fewer regions; contrastive SSL methods rapidly expand regions during training while self-distillation methods consolidate regions via merging; and representation collapse can be detected early from geometric metrics such as region count, area, eccentricity, and boundary changes. These observations are positioned as evidence that polytopal metrics reliably indicate representation quality.
Significance. If the 2D local measurements prove representative of global high-dimensional linear-region complexity and its link to representation quality, the work would provide a novel geometric diagnostic for SSL training dynamics and early collapse detection, extending prior supervised-focused analyses of ReLU partitions. The explicit comparison of contrastive versus self-distillation paradigms on standard benchmarks is a useful empirical contribution, though its impact hinges on validation of the 2D proxy.
major comments (3)
- [Abstract] Abstract and experimental results: The central claims—that SSL yields substantially fewer regions at comparable accuracy, that contrastive methods expand while self-distillation consolidates regions, and that collapse is detectable early—rest entirely on counts and properties of 2D polytopes extracted by SplineCam near the data distribution. Linear regions are defined by hyperplane arrangements in the full input dimension (784 for MNIST); no argument or additional experiment is supplied showing why local 2D slices capture global trends in region number, merging, or correlation with representation quality.
- [Results] Experimental claims (throughout results): No error bars, statistical significance tests, or controls for confounding factors such as model architecture size, optimization hyperparameters, or random seeds are reported. This makes it impossible to assess whether the observed differences in region expansion/consolidation or early collapse signals are robust or could be artifacts of particular training runs.
- [Discussion] Section on representation quality: The assertion that polytopal metrics serve as reliable indicators of representation quality is supported only by correlation with downstream accuracy in the reported experiments. No ablation or causal test is provided to rule out that the geometric changes are incidental rather than mechanistically linked to the learned representations.
minor comments (2)
- [Abstract] The abstract states that 'self-supervised methods create substantially fewer regions' without specifying the exact quantitative comparison (e.g., average region count at convergence) or the precise accuracy threshold used for 'comparable accuracy.'
- [Methods] Notation for the extracted polytopal features (area, eccentricity, boundary count) should be defined explicitly when first introduced, and any dependence on the choice of 2D slicing plane should be stated.
Simulated Author's Rebuttal
We thank the referee for the thoughtful and constructive report. We address each major comment point by point below, providing the strongest honest defense of the manuscript while acknowledging its limitations. Revisions have been made where feasible without misrepresenting the work.
read point-by-point responses
-
Referee: [Abstract] Abstract and experimental results: The central claims—that SSL yields substantially fewer regions at comparable accuracy, that contrastive methods expand while self-distillation consolidates regions, and that collapse is detectable early—rest entirely on counts and properties of 2D polytopes extracted by SplineCam near the data distribution. Linear regions are defined by hyperplane arrangements in the full input dimension (784 for MNIST); no argument or additional experiment is supplied showing why local 2D slices capture global trends in region number, merging, or correlation with representation quality.
Authors: We acknowledge that exact enumeration of linear regions in 784-dimensional space is intractable due to exponential growth with network depth. SplineCam enables tractable local 2D sampling near the data manifold, which prior supervised ReLU analyses have also employed as a proxy. Our results demonstrate consistent correlations between these local metrics and accuracy/collapse across datasets and methods. In revision, we have expanded the methods and discussion sections to explicitly justify the local 2D choice, reference its use in related literature, and state its limitations as a proxy rather than a global characterization. Additional consistency checks across multiple 2D planes were added. revision: partial
-
Referee: [Results] Experimental claims (throughout results): No error bars, statistical significance tests, or controls for confounding factors such as model architecture size, optimization hyperparameters, or random seeds are reported. This makes it impossible to assess whether the observed differences in region expansion/consolidation or early collapse signals are robust or could be artifacts of particular training runs.
Authors: The original submission indeed omitted variability measures and controls. We have rerun the primary experiments using five random seeds per configuration, added error bars to all figures, and included paired t-tests to establish statistical significance of differences between supervised, contrastive, and self-distillation methods. An ablation varying network depth and width while holding other factors fixed has also been incorporated to address architecture confounds. These changes appear in the revised results section. revision: yes
-
Referee: [Discussion] Section on representation quality: The assertion that polytopal metrics serve as reliable indicators of representation quality is supported only by correlation with downstream accuracy in the reported experiments. No ablation or causal test is provided to rule out that the geometric changes are incidental rather than mechanistically linked to the learned representations.
Authors: The manuscript originally presented observed correlations between polytopal metrics and accuracy/collapse. To strengthen the link, we added an ablation that deliberately modulates the SSL loss to induce early collapse and shows that region count and area metrics shift predictably prior to accuracy degradation. The discussion has been revised to describe the metrics as reliable indicators supported by these correlations and ablations, while explicitly noting that full mechanistic causality would require further interventional experiments outside the paper's scope. revision: partial
- Direct computation or validation of linear-region statistics in the full 784-dimensional input space remains computationally infeasible with current methods.
- Establishing definitive causal mechanisms between geometric changes and representation quality would require extensive interventional studies beyond the scope of the current empirical analysis.
Circularity Check
No circularity: purely empirical observations from training runs
full rationale
The paper contains no derivation chain, mathematical predictions, or first-principles results. All central claims (SSL models produce fewer linear regions than supervised at comparable accuracy; contrastive methods expand regions while self-distillation consolidates them; collapse detectable early via polytopal metrics) are direct outputs of experimental measurements: training models on MNIST/FashionMNIST, extracting 2D polytopes with SplineCam near the data, and tracking counts, areas, eccentricities, and boundaries over epochs. No parameters are fitted then renamed as predictions, no self-citations serve as load-bearing uniqueness theorems, and no ansatz or renaming of known results occurs. The work is self-contained against its own experimental data.
Axiom & Free-Parameter Ledger
Reference graph
Works this paper leans on
-
[1]
Lightly: A computer vision framework for self- supervised learning, 2025
Lightly AI. Lightly: A computer vision framework for self- supervised learning, 2025. 5
2025
-
[2]
Unsupervised learning of visual features by contrasting cluster assignments.Ad- vances in neural information processing systems, 33:9912– 9924, 2020
Mathilde Caron, Ishan Misra, Julien Mairal, Priya Goyal, Pi- otr Bojanowski, and Armand Joulin. Unsupervised learning of visual features by contrasting cluster assignments.Ad- vances in neural information processing systems, 33:9912– 9924, 2020. 2
2020
-
[3]
Emerg- ing properties in self-supervised vision transformers
Mathilde Caron, Hugo Touvron, Ishan Misra, Herv ´e J´egou, Julien Mairal, Piotr Bojanowski, and Armand Joulin. Emerg- ing properties in self-supervised vision transformers. InPro- ceedings of the IEEE/CVF international conference on com- puter vision, pages 9650–9660, 2021. 2
2021
-
[4]
Visualizing linear rnns through unrolling
Josue Casco-Rodriguez, Tyler Burley, CJ Barberan, Ahmed Imtiaz Humayun, Randall Balestriero, and Richard Baraniuk. Visualizing linear rnns through unrolling. InLat- inx in AI@ NeurIPS 2024, 2024. 2
2024
-
[5]
A simple framework for contrastive learning of visual representations
Ting Chen, Simon Kornblith, Mohammad Norouzi, and Ge- offrey Hinton. A simple framework for contrastive learning of visual representations. InInternational conference on ma- chine learning, pages 1597–1607. PmLR, 2020. 2, 5
2020
-
[6]
Exploring simple siamese rep- resentation learning
Xinlei Chen and Kaiming He. Exploring simple siamese rep- resentation learning. InProceedings of the IEEE/CVF con- ference on computer vision and pattern recognition, pages 15750–15758, 2021. 2, 5
2021
-
[7]
Provable robustness of relu networks via maximiza- tion of linear regions
Francesco Croce, Maksym Andriushchenko, and Matthias Hein. Provable robustness of relu networks via maximiza- tion of linear regions. Inthe 22nd International Conference on Artificial Intelligence and Statistics, pages 2057–2066. PMLR, 2019. 6
2057
-
[8]
Self-supervised features improve open-world learning.arXiv preprint arXiv:2102.07848, 2021
Akshay Raj Dhamija, Touqeer Ahmad, Jonathan Schwan, Mohsen Jafarzadeh, Chunchun Li, and Terrance E Boult. Self-supervised features improve open-world learning.arXiv preprint arXiv:2102.07848, 2021. 2
-
[9]
How well do self-supervised models transfer? InProceed- ings of the IEEE/CVF conference on computer vision and pattern recognition, pages 5414–5423, 2021
Linus Ericsson, Henry Gouk, and Timothy M Hospedales. How well do self-supervised models transfer? InProceed- ings of the IEEE/CVF conference on computer vision and pattern recognition, pages 5414–5423, 2021. 2
2021
-
[10]
Are all linear regions created equal? InInternational Conference on Artificial Intelligence and Statistics, pages 6573–6590
Matteo Gamba, Adrian Chmielewski-Anders, Josephine Sul- livan, Hossein Azizpour, and Marten Bjorkman. Are all linear regions created equal? InInternational Conference on Artificial Intelligence and Statistics, pages 6573–6590. PMLR, 2022. 2
2022
-
[11]
Rankme: Assessing the downstream perfor- mance of pretrained self-supervised representations by their rank
Quentin Garrido, Randall Balestriero, Laurent Najman, and Yann Lecun. Rankme: Assessing the downstream perfor- mance of pretrained self-supervised representations by their rank. InInternational conference on machine learning, pages 10929–10974. PMLR, 2023. 2
2023
-
[12]
Deep sparse rectifier neural networks
Xavier Glorot, Antoine Bordes, and Yoshua Bengio. Deep sparse rectifier neural networks. InProceedings of the four- teenth international conference on artificial intelligence and 8 Accepted to CVPR Findings 2026 statistics, pages 315–323. JMLR Workshop and Conference Proceedings, 2011. 2, 3
2026
-
[13]
Bootstrap your own latent-a new approach to self-supervised learning.Advances in neural information processing systems, 33:21271–21284, 2020
Jean-Bastien Grill, Florian Strub, Florent Altch ´e, Corentin Tallec, Pierre Richemond, Elena Buchatskaya, Carl Doersch, Bernardo Avila Pires, Zhaohan Guo, Mohammad Ghesh- laghi Azar, et al. Bootstrap your own latent-a new approach to self-supervised learning.Advances in neural information processing systems, 33:21271–21284, 2020. 2, 5
2020
-
[14]
A survey on self-supervised learning: Algorithms, applications, and future trends.IEEE Transactions on Pattern Analysis and Machine Intelligence, 46(12):9052–9071, 2024
Jie Gui, Tuo Chen, Jing Zhang, Qiong Cao, Zhenan Sun, Hao Luo, and Dacheng Tao. A survey on self-supervised learning: Algorithms, applications, and future trends.IEEE Transactions on Pattern Analysis and Machine Intelligence, 46(12):9052–9071, 2024. 2
2024
-
[15]
Complexity of linear re- gions in deep networks
Boris Hanin and David Rolnick. Complexity of linear re- gions in deep networks. InInternational Conference on Ma- chine Learning, pages 2596–2604. PMLR, 2019. 1, 2, 3, 5
2019
-
[16]
Deep relu networks have surprisingly few activation patterns.Advances in neural in- formation processing systems, 32, 2019
Boris Hanin and David Rolnick. Deep relu networks have surprisingly few activation patterns.Advances in neural in- formation processing systems, 32, 2019. 5
2019
-
[17]
Momentum contrast for unsupervised visual rep- resentation learning
Kaiming He, Haoqi Fan, Yuxin Wu, Saining Xie, and Ross Girshick. Momentum contrast for unsupervised visual rep- resentation learning. InProceedings of the IEEE/CVF con- ference on computer vision and pattern recognition, pages 9729–9738, 2020. 2, 5
2020
-
[18]
In de- fense of the triplet loss for person re-identification.arXiv preprint arXiv:1703.07737, 2017
Alexander Hermans, Lucas Beyer, and Bastian Leibe. In de- fense of the triplet loss for person re-identification.arXiv preprint arXiv:1703.07737, 2017. 5
-
[19]
Polarity sampling: Quality and diversity control of pre-trained generative networks via singular values
Ahmed Imtiaz Humayun, Randall Balestriero, and Richard Baraniuk. Polarity sampling: Quality and diversity control of pre-trained generative networks via singular values. In Proceedings of the IEEE/CVF Conference on Computer Vi- sion and Pattern Recognition, pages 10641–10650, 2022. 1, 2
2022
-
[20]
Splinecam: Exact visual- ization and characterization of deep network geometry and decision boundaries
Ahmed Imtiaz Humayun, Randall Balestriero, Guha Balakr- ishnan, and Richard G Baraniuk. Splinecam: Exact visual- ization and characterization of deep network geometry and decision boundaries. InProceedings of the IEEE/CVF Con- ference on Computer Vision and Pattern Recognition, pages 3789–3798, 2023. 1, 2, 3, 5
2023
-
[21]
Ahmed Imtiaz Humayun, Ibtihel Amara, Cristina Vascon- celos, Deepak Ramachandran, Candice Schumann, Jun- feng He, Katherine Heller, Golnoosh Farnadi, Negar Ros- tamzadeh, and Mohammad Havaei. What secrets do your manifolds hold? understanding the local geometry of gener- ative models.arXiv preprint arXiv:2408.08307, 2024. 1
-
[22]
Deep networks always grok and here is why.arXiv preprint arXiv:2402.15555, 2024
Ahmed Imtiaz Humayun, Randall Balestriero, and Richard Baraniuk. Deep networks always grok and here is why.arXiv preprint arXiv:2402.15555, 2024. 1, 2, 6
-
[23]
Abhishek Jha, Matthew B Blaschko, Yuki M Asano, and Tinne Tuytelaars. The common stability mechanism behind most self-supervised learning approaches.arXiv preprint arXiv:2402.14957, 2024. 2
-
[24]
Test sample accuracy scales with training sample density in neural networks
Xu Ji, Razvan Pascanu, R Devon Hjelm, Balaji Lakshmi- narayanan, and Andrea Vedaldi. Test sample accuracy scales with training sample density in neural networks. InConfer- ence on Lifelong Learning Agents, pages 629–646. PMLR,
-
[25]
Supervised contrastive learning.Advances in neural information processing systems, 33:18661–18673,
Prannay Khosla, Piotr Teterwak, Chen Wang, Aaron Sarna, Yonglong Tian, Phillip Isola, Aaron Maschinot, Ce Liu, and Dilip Krishnan. Supervised contrastive learning.Advances in neural information processing systems, 33:18661–18673,
-
[26]
Gradient-based learning applied to document recog- nition.Proceedings of the IEEE, 86(11):2278–2324, 2002
Yann LeCun, L ´eon Bottou, Yoshua Bengio, and Patrick Haffner. Gradient-based learning applied to document recog- nition.Proceedings of the IEEE, 86(11):2278–2324, 2002. 5
2002
-
[27]
On the number of linear regions of deep neural networks.Advances in neural information processing systems, 27, 2014
Guido Mont ´ufar, Razvan Pascanu, Kyunghyun Cho, and Yoshua Bengio. On the number of linear regions of deep neural networks.Advances in neural information processing systems, 27, 2014. 1, 2
2014
-
[28]
Py- torch metric learning.arXiv preprint arXiv:2008.09164,
Kevin Musgrave, Serge Belongie, and Ser-Nam Lim. Py- torch metric learning.arXiv preprint arXiv:2008.09164,
-
[29]
Duc Anh Nguyen, Ernesto Araya, Adalbert Fono, and Gitta Kutyniok. Time to spike? understanding the representational power of spiking neural networks in discrete time.arXiv preprint arXiv:2505.18023, 2025. 1, 2
-
[30]
Sensitivity and gen- eralization in neural networks: an empirical study,
Roman Novak, Yasaman Bahri, Daniel A Abolafia, Jeffrey Pennington, and Jascha Sohl-Dickstein. Sensitivity and gen- eralization in neural networks: an empirical study.arXiv preprint arXiv:1802.08760, 2018. 2, 5, 1
-
[31]
On the number of response regions of deep feedforward networks with piecewise linear activa- tions,
Razvan Pascanu, Guido Montufar, and Yoshua Bengio. On the number of response regions of deep feed forward net- works with piece-wise linear activations.arXiv preprint arXiv:1312.6098, 2013. 5
-
[32]
On the expressive power of deep neural networks
Maithra Raghu, Ben Poole, Jon Kleinberg, Surya Ganguli, and Jascha Sohl-Dickstein. On the expressive power of deep neural networks. Ininternational conference on machine learning, pages 2847–2854. PMLR, 2017. 2
2017
-
[33]
The power of deeper networks for expressing natural functions
David Rolnick and Max Tegmark. The power of deeper networks for expressing natural functions.arXiv preprint arXiv:1705.05502, 2017. 1
work page Pith review arXiv 2017
-
[34]
Bounding and counting linear regions of deep neural networks
Thiago Serra, Christian Tjandraatmadja, and Srikumar Ra- malingam. Bounding and counting linear regions of deep neural networks. InInternational conference on machine learning, pages 4558–4566. PMLR, 2018. 1, 2
2018
-
[35]
Oriane Sim ´eoni, Huy V V o, Maximilian Seitzer, Federico Baldassarre, Maxime Oquab, Cijo Jose, Vasil Khalidov, Marc Szafraniec, Seungeun Yi, Micha ¨el Ramamonjisoa, et al. Dinov3.arXiv preprint arXiv:2508.10104, 2025. 2
work page internal anchor Pith review arXiv 2025
-
[36]
Un- derstanding self-supervised learning dynamics without con- trastive pairs
Yuandong Tian, Xinlei Chen, and Surya Ganguli. Un- derstanding self-supervised learning dynamics without con- trastive pairs. InInternational Conference on Machine Learning, pages 10268–10278. PMLR, 2021. 2
2021
-
[37]
Unsupervised feature learning via non-parametric instance discrimination
Zhirong Wu, Yuanjun Xiong, Stella X Yu, and Dahua Lin. Unsupervised feature learning via non-parametric instance discrimination. InProceedings of the IEEE conference on computer vision and pattern recognition, pages 3733–3742,
-
[38]
Fashion-MNIST: a Novel Image Dataset for Benchmarking Machine Learning Algorithms
Han Xiao, Kashif Rasul, and Roland V ollgraf. Fashion- mnist: a novel image dataset for benchmarking machine learning algorithms.arXiv preprint arXiv:1708.07747, 2017. 5
work page internal anchor Pith review arXiv 2017
-
[39]
Barlow twins: Self-supervised learning via 9 Accepted to CVPR Findings 2026 redundancy reduction
Jure Zbontar, Li Jing, Ishan Misra, Yann LeCun, and St´ephane Deny. Barlow twins: Self-supervised learning via 9 Accepted to CVPR Findings 2026 redundancy reduction. InInternational conference on ma- chine learning, pages 12310–12320. PMLR, 2021. 2
2026
-
[40]
Chaoning Zhang, Kang Zhang, Chenshuang Zhang, Trung X Pham, Chang D Yoo, and In So Kweon. How does sim- siam avoid collapse without negative samples? a unified un- derstanding with self-supervised contrastive learning.arXiv preprint arXiv:2203.16262, 2022. 2 10 Accepted to CVPR Findings 2026 Complexity of Linear Regions in Self-supervised Deep ReLU Networ...
-
[41]
the circumcenter of the triangle produced by the three points,
-
[42]
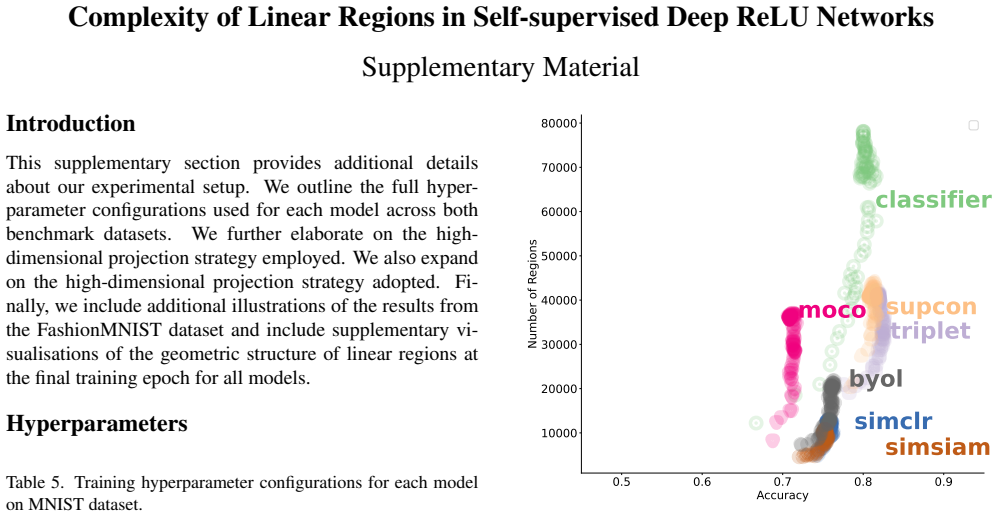
Number of regions and accuracy achieved by super- vised and self-supervised methods on FashionMNIST dataset
the orthonormal basis vector of the plane, 0.5 0.6 0.7 0.8 0.9 Accuracy 10000 20000 30000 40000 50000 60000 70000 80000Number of Regions classifier triplet supcon simclr moco simsiam byol Figure 9. Number of regions and accuracy achieved by super- vised and self-supervised methods on FashionMNIST dataset. The opacity reflects the progression of training o...
-
[43]
Letv 1 =x 1 −x 0 andv 2 =x 2 −x 0
an affine mapping that transforms high-dimensional co- ordinates into the two-dimensional input space. Letv 1 =x 1 −x 0 andv 2 =x 2 −x 0. The circumcenter Cof the triangle formed byx 0, x1 andx 2 can be expressed as: C=x 0 +β 0v1 +β 1v2 (9) whereβ 0, β1 ∈Rare the coefficients that satisfy the linear system M a b = 1 2 b(10) such that M= vT 1 v1 vT 1 v2 vT...
2026
discussion (0)
Sign in with ORCID, Apple, or X to comment. Anyone can read and Pith papers without signing in.