REVIEW 2 major objections 2 minor 1 cited by
Exploring the Impact of Tilted Magnetic Dipoles on the Atmospheric Dynamics of Hot Jupiters: Towards an Improved Magnetohydrodynamic Framework
T0 review · 2 major / 2 minor · reviewed 2026-05-07 · grok-4.3
Pith's one-line read Tilted magnetic dipoles in hot Jupiter atmosphere models produce north-south temperature asymmetries and latitudinally shifted hotspots.
desk verdict Tilted dipoles add north-south asymmetries and shift phase-curve signals in hot Jupiter GCMs, but the results sit on an untested extension of the aligned-dipole prescription with no validation numbers shown. read the letter →
The pith
A machine-rendered reading of the paper's core claim, the machinery that carries it, and where it could break.
The reading
What carries the argument
Extension of the aligned-dipole magnetic prescription inside 3D GCMs to a tilted deep-seated internal dipole, which couples local atmospheric conductivity and velocity to a non-axisymmetric Lorentz force.
What would settle it
A JWST phase curve of a hot Jupiter that shows no north-south asymmetry and no change in hotspot offset when independent evidence indicates a strong, tilted magnetic field would falsify the model's central prediction.
Extended reading notes
Core claim
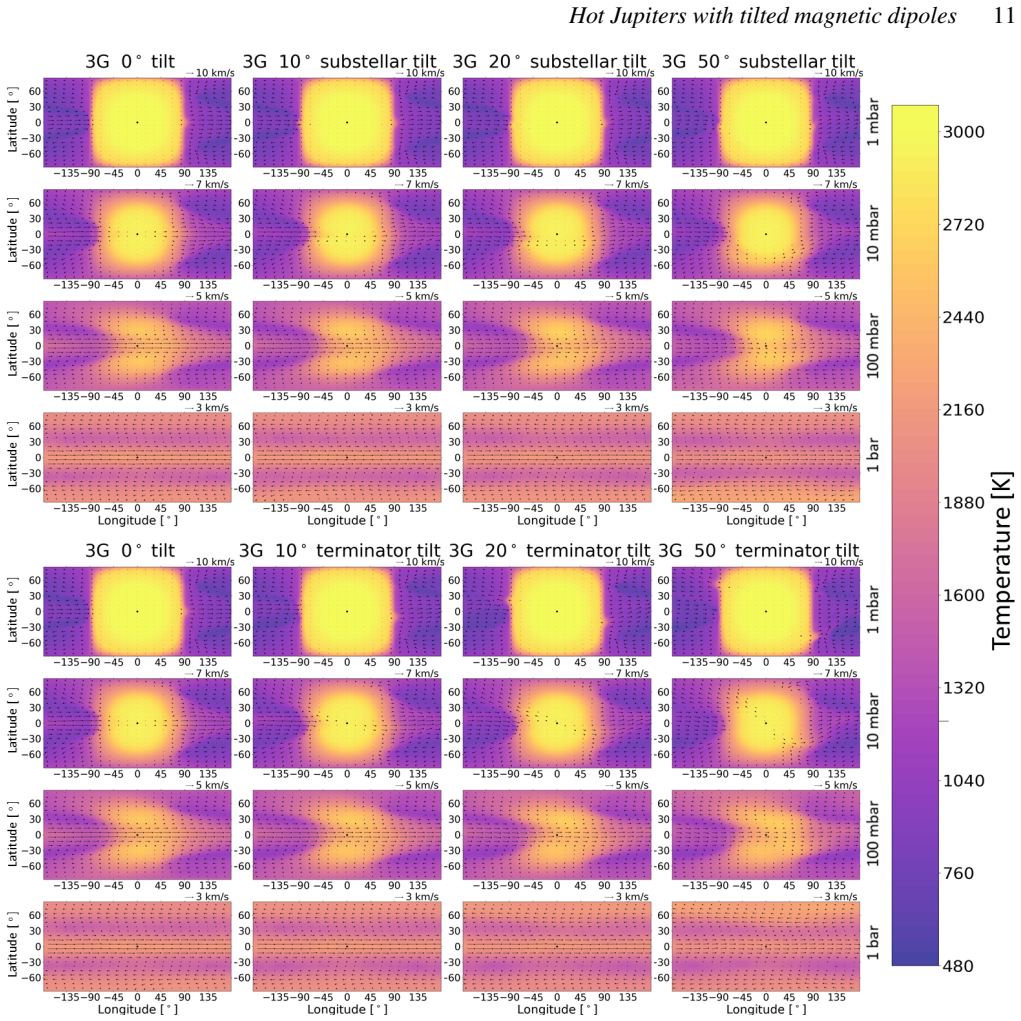
Inclusion of a tilted dipole introduces pronounced north-south asymmetries into the temperature profile leading to latitudinally shifted hotspots and deflection of winds that would otherwise be axially symmetric. The strength of the magnetic field has the most significant effect on the simulated phase curves, with stronger magnetic fields increasing the amplitude of the phase curve and reducing the hot spot offset.
Load-bearing premise
The magnetic prescription remains valid when the deep-seated internal dipole is tilted relative to the rotation axis, with no additional coupling or feedback from the atmosphere altering the field geometry at depth.
Editorial analysis
A structured set of objections, weighed in public.
Referee Report
Summary. The paper uses 3D GCMs to extend a standard aligned-dipole magnetic prescription to tilted deep-seated dipoles in hot Jupiter atmospheres. It reports that tilted dipoles produce north-south temperature asymmetries, latitudinally shifted hotspots, and deflected winds, while magnetic field strength dominates simulated JWST/NIRSpec phase curves by increasing amplitude and reducing hotspot offset.
Significance. If the central results hold, the work supplies qualitative guidance on how dipole tilt and strength can break axial symmetry and alter observable phase curves, building on prior MHD-GCM frameworks. The extension to tilted geometries is a natural next step, though the absence of quantitative validation or convergence metrics limits immediate applicability to data interpretation.
major comments (2)
- [Abstract and magnetic model description] The central claims (north-south asymmetries, shifted hotspots, wind deflections, and B-strength dominance in phase curves) rest on the assumption that the fixed deep-dipole magnetic prescription remains valid when axial symmetry is broken. No re-derivation, consistency test, or estimate of atmospheric current-induced perturbations is provided, even though the model operates in the thermally ionized, high-conductivity regime where Lorentz forces could alter the deep field geometry.
- [Results and phase-curve section] No quantitative validation, error bars, convergence tests, resolution studies, or direct comparison to observations is reported for the simulated temperature profiles, wind patterns, or phase curves. This leaves the reported effects on hotspot offset and phase-curve amplitude without demonstrated numerical robustness.
minor comments (2)
- [Abstract] The abstract claims the model is 'one of the most sophisticated' without specifying the precise advances relative to cited prior aligned-dipole studies.
- [Methods] Notation for the magnetic field components and tilt angle should be defined explicitly at first use to aid reproducibility.
Simulated Author's Rebuttal
We thank the referee for their constructive review of our paper on the impact of tilted magnetic dipoles in hot Jupiter GCMs. We address each of the major comments in detail below and indicate the changes made to the manuscript.
read point-by-point responses
-
Referee: [Abstract and magnetic model description] The central claims (north-south asymmetries, shifted hotspots, wind deflections, and B-strength dominance in phase curves) rest on the assumption that the fixed deep-dipole magnetic prescription remains valid when axial symmetry is broken. No re-derivation, consistency test, or estimate of atmospheric current-induced perturbations is provided, even though the model operates in the thermally ionized, high-conductivity regime where Lorentz forces could alter the deep field geometry.
Authors: Our approach extends the fixed deep-dipole prescription from aligned cases, which has been widely used in previous MHD-GCM studies. The assumption is that the internal field sets the geometry, and atmospheric interactions are captured through the Lorentz force term without back-reacting on the field itself. We recognize the potential for current-induced perturbations in the high-conductivity regime. In the revised manuscript, we have expanded the model description to include a consistency discussion and a simple estimate showing that such perturbations are likely small compared to the imposed field for the parameters considered. This maintains the qualitative nature of our results while acknowledging the approximation. revision: yes
-
Referee: [Results and phase-curve section] No quantitative validation, error bars, convergence tests, resolution studies, or direct comparison to observations is reported for the simulated temperature profiles, wind patterns, or phase curves. This leaves the reported effects on hotspot offset and phase-curve amplitude without demonstrated numerical robustness.
Authors: We have taken this feedback seriously and added quantitative elements to the revised manuscript. Specifically, we now include time-averaged profiles with associated standard deviations to provide error estimates, and we report results from additional simulations at varying horizontal resolutions to demonstrate convergence of the key features such as hotspot shifts and phase curve amplitudes. While a comprehensive resolution study for all cases is computationally intensive, the reported effects are robust across the tested configurations. Direct comparisons to observations are not performed here, as the study aims to provide theoretical guidance rather than data fitting; this scope is now more explicitly stated in the introduction and conclusions. revision: partial
Circularity Check
No circularity: results are direct outputs of extended GCM simulations
full rationale
The paper reports numerical experiments in 3D GCMs that incorporate an extended magnetic dipole prescription allowing tilt relative to the rotation axis. The reported north-south temperature asymmetries, shifted hotspots, wind deflections, and phase-curve dependencies on field strength are direct simulation outputs under the stated assumptions, not quantities that reduce by construction to fitted parameters, self-definitions, or prior self-citations. No equations are presented that equate a derived result to its own inputs, and the magnetic model extension is treated as an implemented change rather than a tautological renaming or ansatz smuggled via citation. The derivation chain remains self-contained through standard MHD and atmospheric modeling.
Assumptions & free parameters
free parameters (2)
- magnetic dipole tilt angle
- magnetic field strength
assumptions (2)
- domain assumption Deep-seated internal magnetic dipole remains fixed in orientation and strength independent of atmospheric feedback
- domain assumption Ideal MHD applies to the thermally ionized dayside atmosphere
Cite this review
Pith. "Pith review of Exploring the Impact of Tilted Magnetic Dipoles on the Atmospheric Dynamics of Hot Jupiters: Towards an Improved Magnetohydrodynamic Framework." pith.science (2026). https://pith.science/paper/2604.25043
@misc{pith2026260425043,
  author       = {Pith},
  title        = {Pith review of: Exploring the Impact of Tilted Magnetic Dipoles on the Atmospheric Dynamics of Hot Jupiters: Towards an Improved Magnetohydrodynamic Framework},
  year         = {2026},
  howpublished = {\url{https://pith.science/paper/2604.25043}},
  note         = {Machine review of arXiv:2604.25043}
}
read the original abstract
The atmospheres of hot Jupiters lie in a dynamical regime without a solar system analogue. The strongly irradiated daysides reach temperatures sufficiently hot for substantial thermal ionization of atmospheric species, resulting in flows that can interact with the planetary magnetic field. These magnetic effects can significantly impact wind speeds, atmospheric temperatures, and large-scale circulation patterns. Previous work combining 3D atmospheric models and magnetic prescriptions has shown the impact of magnetic effects on temperature and velocity profiles are dependent on local atmospheric properties as well as the set of assumptions employed by the magnetic prescription. In this work, we examine a commonly employed magnetic model--a perfectly aligned dipole--in 3D General Circulation Models (GCMs) and extend this framework to allow for tilting of the deep-seated internal magnetic dipole field relative to the axis of rotation. We find that the inclusion of a tilted dipole introduces pronounced north-south asymmetries into the temperature profile leading to latitudinally shifted hotpots and deflection of winds that would otherwise be axially symmetric. We additionally simulate JWST/NIRSpec phase curves. We find that the strength of the magnetic field has the most significant effect on the simulated phase curves, with stronger magnetic fields increasing the amplitude of the phase curve and reducing the hot spot offset. Our model can provide qualitative insight into how the magnetic dipole strength or orientation may influence the large scale atmospheric dynamics and represents one of the most sophisticated incorporations of magnetic effects in GCMs for hot Jupiter atmospheres to date.
Figures


Figures from the paper (17 more)



Forward citations
Cited by 1 Pith paper
-
A Physically Driven Parameterisation of Multidimensional Atmospheres: Application to the JWST Phase Curve of WASP-121b
A 3D temperature parameterization derived from energy-balance timescales, fit to JWST phase-curve spectra of WASP-121b, recovers a day–night asymmetric atmosphere with a nightside methane enhancement and hints of magn...
Reference graph
Works this paper leans on
-
[1]
J., 2010, The Astrophysical Journal Letters, 714, L238 Batygin K., Stevenson D
Adcroft A., Hill C., Campin J.-M., Marshall J., Heimbach P., 2004, Pro- ceedingsoftheECMWFSeminarSeriesonNumericalMethods,Recent Developments in Numerical Methods for Atmosphere and Ocean Mod- eling Arcangeli J., et al., 2019, A&A, 625, A136 BagheriF.,LopezR.E.,PhamK.,2024,AFreshLookintotheInteractionof Exoplanets Magnetosphere with Stellar Winds using MH...
-
[2]
Helling, Ch. Worters, M. Samra, D. Molaverdikhani, K. Iro, N. 2021, A&A, 648, A80 Heng K., 2012, The Astrophysical Journal, 748, L17 Hindle A. W., Bushby P. J., Rogers T. M., 2021, The Astrophysical Journal, 922, 176 Kataria T., Sing D. K., Lewis N. K., Visscher C., Showman A. P., Fortney J. J., Marley M. S., 2016, The Astrophysical Journal, 821, 9 Keatin...
Reviewed May 7, 2026 · model on record in the stance chip above.
Discussion (0). Continue with ORCID to comment.