Recognition: 1 theorem link
· Lean TheoremEpiCastBench: Datasets and Benchmarks for Multivariate Epidemic Forecasting
Pith reviewed 2026-05-13 01:35 UTC · model grok-4.3
The pith
EpiCastBench supplies 40 multivariate epidemic datasets with standardized settings to evaluate 15 forecasting models.
A machine-rendered reading of the paper's core claim, the machinery that carries it, and where it could break.
Core claim
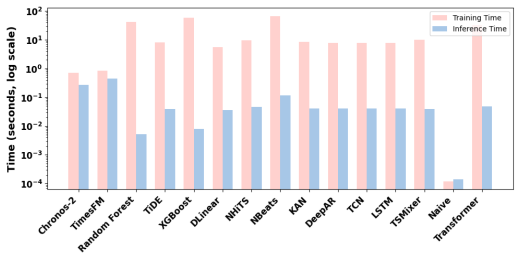
The central discovery is the creation of EpiCastBench, a large-scale framework with 40 curated multivariate epidemic datasets that exhibit varied characteristics in granularity, length, and sparsity. These datasets are analyzed for global features and structural patterns. The framework includes fixed forecasting horizons, preprocessing steps, multiple metrics, and statistical tests to enable unbiased evaluations, which are then applied to assess 15 different multivariate forecasting models.
What carries the argument
EpiCastBench, the benchmarking framework that curates correlated multivariate datasets and enforces standardized evaluation conditions for epidemic forecasting models.
If this is right
- Researchers can now perform fair comparisons across a wide range of models without custom data preparation.
- The diversity of datasets helps identify model performance under different epidemic conditions.
- Identification of dataset patterns can guide future data collection efforts in epidemiology.
- Comprehensive evaluation reveals relative strengths of statistical versus deep learning approaches in this domain.
Where Pith is reading between the lines
- The benchmark might reveal that certain foundation models outperform others in handling sparse epidemic data.
- Extending the framework to include causal inference or intervention modeling could further enhance its utility for policy decisions.
- If widely adopted, it could standardize practices similar to how benchmarks in other fields have driven progress.
Load-bearing premise
The 40 chosen datasets represent typical epidemic behaviors and the testing rules do not secretly favor some models over others.
What would settle it
If a re-evaluation using independently sourced epidemic datasets produces different top-performing models than those identified in the benchmark.
Figures


read the original abstract
The increasing adoption of data-driven decision-making in public health has established epidemic forecasting as a critical area of research. Recent advances in multivariate forecasting models better capture complex temporal dependencies than conventional univariate approaches, which model individual series independently. Despite this potential, the development of robust epidemic forecasting methods is constrained by the lack of high-quality benchmarks comprising diverse multivariate datasets across infectious diseases and geographical regions. To address this gap, we present EpiCastBench, a large-scale benchmarking framework featuring 40 curated (correlated) multivariate epidemic datasets. These publicly available datasets span a wide range of infectious diseases and exhibit diverse characteristics in terms of temporal granularity, series length, and sparsity. We analyze these datasets to identify their global features and structural patterns. To ensure reproducibility and fair comparison, we establish standardized evaluation settings, including a unified forecasting horizon, consistent preprocessing pipelines, diverse performance metrics, and statistical significance testing. By leveraging this framework, we conduct a comprehensive evaluation of 15 multivariate forecasting models spanning statistical baselines to state-of-the-art deep learning and foundation models. All datasets and code are publicly available on Kaggle (https://www.kaggle.com/datasets/aimltsf/epicastbench) and GitHub (https://github.com/aimltsf/EpiCastBench).
Editorial analysis
A structured set of objections, weighed in public.
Referee Report
Summary. The manuscript introduces EpiCastBench, a large-scale benchmarking framework consisting of 40 curated multivariate epidemic datasets spanning multiple infectious diseases, geographical regions, temporal granularities, series lengths, and sparsity levels. It provides standardized evaluation protocols (unified forecasting horizon, preprocessing pipelines, performance metrics, and statistical significance testing) and evaluates 15 multivariate forecasting models ranging from statistical baselines to state-of-the-art deep learning and foundation models. All datasets and code are released publicly on Kaggle and GitHub.
Significance. If the curation process proves representative and free of systematic biases, EpiCastBench could become a useful public resource for the epidemic forecasting community by enabling reproducible, fair comparisons of multivariate models that capture inter-series dependencies. The public data and code release supports reproducibility, which is a clear strength.
major comments (2)
- [Dataset curation and analysis sections (referenced in abstract and § on datasets)] The central claim that the 40 datasets enable 'fair comparison' rests on the curation process being unbiased and representative. However, the manuscript does not provide an explicit, reproducible selection protocol (e.g., precise inclusion/exclusion rules for sparsity thresholds, minimum series length, geographic/disease coverage, or how 'correlated' multivariate structure was ensured). This makes it impossible to rule out hidden selection effects that could favor particular model families (e.g., deep learning models benefiting from longer, denser series).
- [Evaluation settings and experimental results sections] No sensitivity analyses or robustness checks are reported against alternative dataset pools, preprocessing variants, or horizon choices. Without these, it is unclear whether reported model rankings and statistical significance results are stable or artifacts of the specific 40-dataset collection.
minor comments (2)
- [Abstract] Clarify the meaning of '(correlated)' in the abstract and dataset description; specify whether it refers to within-dataset inter-series correlations or another property.
- [Model evaluation section] Include a summary table listing all 15 models with their categories (statistical, DL, foundation), key references, and hyperparameters used in the benchmark.
Simulated Author's Rebuttal
We thank the referee for the constructive and detailed feedback on our manuscript introducing EpiCastBench. We address each major comment below and indicate the revisions we will make to improve clarity and robustness.
read point-by-point responses
-
Referee: [Dataset curation and analysis sections (referenced in abstract and § on datasets)] The central claim that the 40 datasets enable 'fair comparison' rests on the curation process being unbiased and representative. However, the manuscript does not provide an explicit, reproducible selection protocol (e.g., precise inclusion/exclusion rules for sparsity thresholds, minimum series length, geographic/disease coverage, or how 'correlated' multivariate structure was ensured). This makes it impossible to rule out hidden selection effects that could favor particular model families (e.g., deep learning models benefiting from longer, denser series).
Authors: We agree that greater transparency in the curation protocol is needed to substantiate the claim of fair and unbiased comparison. The manuscript currently emphasizes the resulting diversity in disease types, regions, granularities, lengths, and sparsity but does not enumerate the precise selection rules. In the revised version we will add a dedicated subsection in the Datasets section that documents the full curation protocol, including the public data sources consulted, quantitative thresholds applied for series length and sparsity, the method used to verify multivariate correlation structure, and the stratification steps taken to achieve coverage across diseases and geographies. This addition will make the process fully reproducible and allow readers to evaluate potential selection effects directly. revision: yes
-
Referee: [Evaluation settings and experimental results sections] No sensitivity analyses or robustness checks are reported against alternative dataset pools, preprocessing variants, or horizon choices. Without these, it is unclear whether reported model rankings and statistical significance results are stable or artifacts of the specific 40-dataset collection.
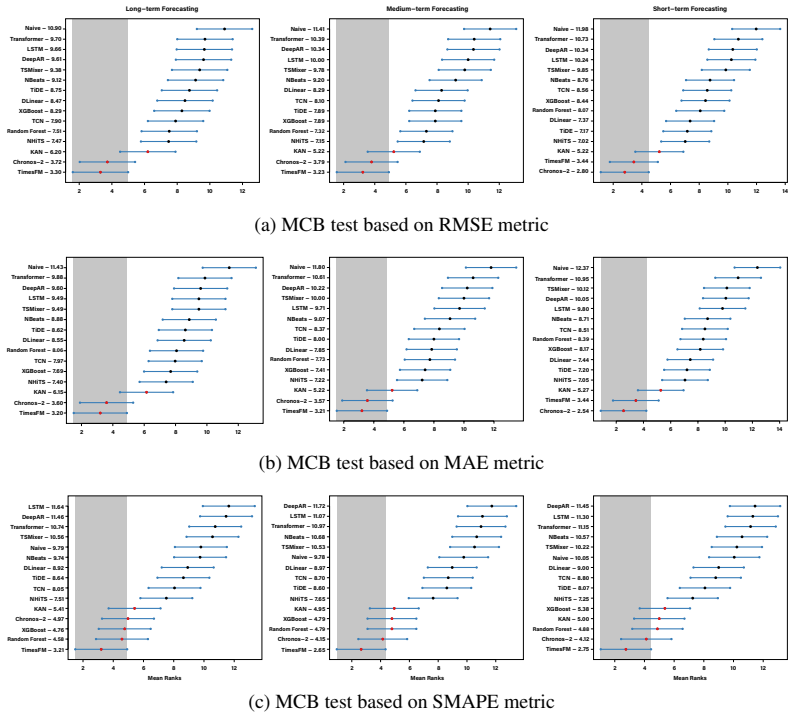
Authors: We recognize that additional sensitivity checks would further demonstrate the stability of the reported rankings. Our existing evaluation already employs statistical significance testing (Friedman test followed by post-hoc Nemenyi) across all 40 datasets to assess whether performance differences are reliable. Nevertheless, we did not conduct exhaustive sensitivity experiments on alternative dataset collections or preprocessing variants. In the revision we will add a short robustness subsection that reports limited sensitivity results (re-evaluation under two alternative horizon lengths on a stratified 10-dataset subset) and will expand the Limitations section to note that broader sensitivity to entirely different dataset pools is left for future work. We believe the combination of dataset diversity, unified protocols, and significance testing already provides substantial evidence that the rankings are not artifacts of the chosen collection. revision: partial
Circularity Check
Empirical benchmark paper with no derivation chain or fitted predictions
full rationale
The paper introduces EpiCastBench as a curated collection of 40 external multivariate epidemic datasets, standardized preprocessing, and off-the-shelf model evaluations. No equations, parameter fits, or predictions are defined inside the work that later get re-used as outputs. All claims rest on publicly available external data sources and standard statistical/deep-learning baselines rather than any self-referential construction. This matches the default expectation for benchmark papers and yields no circularity.
Axiom & Free-Parameter Ledger
Lean theorems connected to this paper
-
IndisputableMonolith/Foundation/RealityFromDistinction.leanreality_from_one_distinction unclear?
unclearRelation between the paper passage and the cited Recognition theorem.
EpiCastBench comprises 40 publicly available multivariate time series datasets of incidence cases... standardized evaluation settings, including a unified forecasting horizon, consistent preprocessing pipelines, diverse performance metrics, and statistical significance testing.
What do these tags mean?
- matches
- The paper's claim is directly supported by a theorem in the formal canon.
- supports
- The theorem supports part of the paper's argument, but the paper may add assumptions or extra steps.
- extends
- The paper goes beyond the formal theorem; the theorem is a base layer rather than the whole result.
- uses
- The paper appears to rely on the theorem as machinery.
- contradicts
- The paper's claim conflicts with a theorem or certificate in the canon.
- unclear
- Pith found a possible connection, but the passage is too broad, indirect, or ambiguous to say the theorem truly supports the claim.
Reference graph
Works this paper leans on
-
[1]
https://www.kaggle.com/datasets/unanimad/ corona-virus-brazil
Corona virus brazil dataset. https://www.kaggle.com/datasets/unanimad/ corona-virus-brazil
-
[2]
IDOBE: Infectious Disease Outbreak forecasting Benchmark Ecosystem
A. Adiga, J. Chou, A. Chiranth, B. Lewis, A. I. Bento, S. Truelove, G. Fox, M. Marathe, H. Hochheiser, and S. Venkatramanan. Idobe: Infectious disease outbreak forecasting benchmark ecosystem.arXiv preprint arXiv:2604.18521, 2026
work page internal anchor Pith review Pith/arXiv arXiv 2026
-
[3]
A. S. Allende. Covid-19 data repository. https://github.com/alonsosilvaallende/ COVID-19/tree/master/data
-
[4]
A. F. Ansari, O. Shchur, J. Küken, A. Auer, B. Han, P. Mercado, S. S. Rangapuram, H. Shen, L. Stella, X. Zhang, et al. Chronos-2: From univariate to universal forecasting.arXiv preprint arXiv:2510.15821, 2025
work page internal anchor Pith review arXiv 2025
- [5]
-
[6]
M. Biggerstaff, D. Alper, M. Dredze, S. Fox, I. C.-H. Fung, K. S. Hickmann, B. Lewis, R. Rosenfeld, J. Shaman, M.-H. Tsou, et al. Results from the centers for disease control and prevention’s predict the 2013–2014 influenza season challenge.BMC infectious diseases, 16(1):357, 2016
work page 2013
-
[7]
L. Breiman. Random forests.Machine learning, 45(1):5–32, 2001
work page 2001
-
[8]
L. C. Brooks, D. C. Farrow, S. Hyun, R. J. Tibshirani, and R. Rosenfeld. Nonmechanistic forecasts of seasonal influenza with iterative one-week-ahead distributions.PLoS computational biology, 14(6):e1006134, 2018
work page 2018
- [9]
-
[10]
K. Charniga, Z. M. Cucunubá, M. Mercado, F. Prieto, M. Ospina, P. Nouvellet, and C. A. Donnelly. Spatial and temporal invasion dynamics of the 2014–2017 zika and chikungunya epidemics in colombia.PLOS Computational Biology, 17(7):e1009174, 2021
work page 2014
-
[11]
S.-A. Chen, C.-L. Li, S. O. Arik, N. C. Yoder, and T. Pfister. TSMixer: An all-MLP architecture for time series forecast-ing.Transactions on Machine Learning Research, 2023
work page 2023
-
[12]
T. Chen and C. Guestrin. Xgboost: A scalable tree boosting system. InProceedings of the 22nd ACM SIGKDD International Conference on Knowledge Discovery and Data Mining, pages 785–794, 2016
work page 2016
-
[13]
Y . Chen, Y . Kang, Y . Chen, and Z. Wang. Probabilistic forecasting with temporal convolutional neural network.Neurocomputing, 399:491–501, 2020. 10
work page 2020
-
[14]
V . K. R. Chimmula and L. Zhang. Time series forecasting of covid-19 transmission in canada using lstm networks.Chaos, solitons & fractals, 135:109864, 2020
work page 2020
- [15]
-
[16]
F. J. Colón-González, R. Gibb, K. Khan, A. Watts, R. Lowe, and O. J. Brady. Projecting the future incidence and burden of dengue in southeast asia.nature communications, 14(1):5439, 2023
work page 2023
-
[17]
Covid-19 data for mexico.https://datos.covid-19.conacyt.mx
CONACYT. Covid-19 data for mexico.https://datos.covid-19.conacyt.mx
-
[18]
CovidDataProject. Covid-19 data for colombia. https://github.com/CovidDataProject/ DataCovid19Colombia
-
[19]
E. Y . Cramer, E. L. Ray, V . K. Lopez, J. Bracher, A. Brennen, A. J. Castro Rivadeneira, A. Gerding, T. Gneiting, K. H. House, Y . Huang, et al. Evaluation of individual and ensemble probabilistic forecasts of covid-19 mortality in the united states.Proceedings of the National Academy of Sciences, 119(15):e2113561119, 2022
work page 2022
-
[20]
S. da Silva Neto, T. Tabosa de Oliveira, I. Teixiera, et al. Arboviral disease record data - dengue and chikungunya, brazil, 2013–2020.Scientific Data, 9:198, 2022
work page 2013
-
[21]
A. Das, W. Kong, A. Leach, S. K. Mathur, R. Sen, and R. Yu. Long-term forecasting with tiDE: Time-series dense encoder.Transactions on Machine Learning Research, 2023
work page 2023
-
[22]
A. Das, W. Kong, R. Sen, and Y . Zhou. A decoder-only foundation model for time-series forecasting. InForty-first International Conference on Machine Learning, 2024
work page 2024
-
[23]
D. della Protezione Civile. Covid-19 data for italian provinces. https://github.com/ pcm-dpc/COVID-19/tree/master/dati-province
-
[24]
J. Deng, W. Dong, R. Socher, L.-J. Li, K. Li, and L. Fei-Fei. Imagenet: A large-scale hierarchical image database. In2009 IEEE conference on computer vision and pattern recognition, pages 248–255. Ieee, 2009
work page 2009
-
[25]
E. Dong, H. Du, and L. Gardner. An interactive web-based dashboard to track covid-19 in real time.The Lancet. Infectious diseases, 20(5):533–534, 2020
work page 2020
-
[26]
C. for Disease Control and P. (CDC). Zika virus data repository. https://github.com/ cdcepi/zika
-
[27]
E. C. for Disease Prevention and C. (ECDC). Data on daily new cases of covid- 19 in eu/eea by country. https://www.ecdc.europa.eu/en/publications-data/ data-daily-new-cases-covid-19-eueea-country
- [28]
- [29]
-
[30]
J. Gehrcke. Covid-19 data for germany. https://github.com/jgehrcke/ covid-19-germany-gae
-
[31]
R. Godahewa, C. Bergmeir, G. I. Webb, R. J. Hyndman, and P. Montero-Manso. Monash time series forecasting archive. In35th Conference on Neural Information Processing Systems (NeurIPS 2021) Track on Datasets and Benchmarks, 2021
work page 2021
- [32]
- [33]
-
[34]
Covid-19 epidemiological updates in canada
Government of Canada. Covid-19 epidemiological updates in canada. https:// health-infobase.canada.ca/covid-19/
-
[35]
S. Hassan. R dengue analysis.https://github.com/shakhassan/r-dengue-analysis
- [36]
-
[37]
S. Hochreiter and J. Schmidhuber. Long short-term memory.Neural computation, 9(8):1735– 1780, 1997
work page 1997
-
[38]
R. Hyndman, Y . Kang, P. Montero-Manso, M. O’Hara-Wild, T. Talagala, E. Wang, Y . Yang, S. B. Taieb, C. Hanqing, D. K. Lake, N. Laptev, J. R. Moorman, and B. Zhang. tsfeatures: Time series feature extraction, 2023
work page 2023
-
[39]
R. J. Hyndman and A. B. Koehler. Another look at measures of forecast accuracy.International Journal of Forecasting, 22(4):679–688, 2006
work page 2006
-
[40]
M. A. Johansson, K. M. Apfeldorf, S. Dobson, J. Devita, A. L. Buczak, B. Baugher, L. J. Moniz, T. Bagley, S. M. Babin, E. Guven, et al. An open challenge to advance probabilistic forecasting for dengue epidemics.Proceedings of the National Academy of Sciences, 116(48):24268–24274, 2019
work page 2019
-
[41]
K. E. Jones, N. G. Patel, M. A. Levy, A. Storeygard, D. Balk, J. L. Gittleman, and P. Daszak. Global trends in emerging infectious diseases.Nature, 451(7181):990–993, 2008
work page 2008
-
[42]
A. J. Koning, P. H. Franses, M. Hibon, and H. O. Stekler. The m3 competition: Statistical tests of the results.International Journal of Forecasting, 21(3):397–409, 2005
work page 2005
-
[43]
S. F. U. D. Lab. Covid-19 data for japan. https://github.com/sfu-db/ covid19-datasets/blob/master/datasets-details/Japan.md
-
[44]
Z. Liu, Y . Wang, S. Vaidya, F. Ruehle, J. Halverson, M. Soljacic, T. Y . Hou, and M. Tegmark. KAN: Kolmogorov–arnold networks. InThe Thirteenth International Conference on Learning Representations, 2025
work page 2025
-
[45]
R. Lowe, S. Lee, K. O’Reilly, O. Brady, L. Bastos, G. Carrasco-Escobar, R. de Castro Catão, F. Colón-González, C. Barcellos, M. Carvalho, M. Blangiardo, H. Rue, and A. Gasparrini. Combined effects of hydrometeorological hazards and urbanisation on dengue risk in brazil: a spatiotemporal modelling study.The Lancet Planetary Health, 5(4):e209–e219, Apr 2021
work page 2021
- [46]
- [47]
-
[48]
R. (Netherlands). Covid-19 data for the netherlands.https://data.rivm.nl/covid-19
-
[49]
New South Wales Government. Covid-19 cases by location. https://data.nsw.gov.au/ data/dataset/covid-19-cases-by-location
-
[50]
C. M. of Health. Covid-19 api for the czech republic. https://onemocneni-aktualne. mzcr.cz/api/v2/covid-19
-
[51]
S. F. O. of Public Health (FOPH). Covid-19 data for switzerland. https://idd.bag.admin. ch/diseases/covid/data
-
[52]
B. N. Oreshkin, D. Carpov, N. Chapados, and Y . Bengio. N-beats: Neural basis expansion analysis for interpretable time series forecasting. InInternational Conference on Learning Representations, 2020. 12
work page 2020
-
[53]
V . V . Palacios. Covid-19 data for spain.https://github.com/victorvicpal
- [54]
-
[55]
F. Ping. Pahang wdf: Weather-dengue forecasting. https://github.com/ping543f/ pahang-wdf/tree/main
-
[56]
I. C.-. D. Project. Covid-19 data for india.https://data.incovid19.org
-
[57]
U. o. P. Project Tycho. Project tycho data repository.https://www.tycho.pitt.edu/
-
[58]
I. D. Repository. Covid-19 data for ireland. https://respiratoryvirus.hpsc.ie/pages/ covid-19
-
[59]
A. Rodriguez, H. Kamarthi, P. Agarwal, J. Ho, M. Patel, S. Sapre, and B. A. Prakash. Machine learning for data-centric epidemic forecasting.Nature Machine Intelligence, 6(10):1122–1131, 2024
work page 2024
-
[60]
R. Rosenfeld and R. J. Tibshirani. Epidemic tracking and forecasting: Lessons learned from a tumultuous year.Proceedings of the National Academy of Sciences, 118(51):e2111456118, 2021
work page 2021
-
[61]
B. Rozemberczki, P. Scherer, O. Kiss, R. Sarkar, and T. Ferenci. Chickenpox Cases in Hungary: a Benchmark Dataset for Spatiotemporal Signal Processing with Graph Neural Networks, 2021
work page 2021
-
[62]
D. Salinas, V . Flunkert, J. Gasthaus, and T. Januschowski. Deepar: Probabilistic forecasting with autoregressive recurrent networks.International Journal of Forecasting, 36(3):1181–1191, 2020
work page 2020
-
[63]
Covid-19 epidemiological dashboard for belgium
Sciensano. Covid-19 epidemiological dashboard for belgium. https://epistat.sciensano. be/covid/
-
[64]
T. N. Y . Times. Covid-19 data for the united states. https://github.com/nytimes/ covid-19-data
-
[65]
A. Vaswani, N. Shazeer, N. Parmar, J. Uszkoreit, L. Jones, A. N. Gomez, Ł. Kaiser, and I. Polosukhin. Attention is all you need.Advances in neural information processing systems, 30, 2017
work page 2017
-
[66]
A. Wang. Glue: A multi-task benchmark and analysis platform for natural language understand- ing.arXiv preprint arXiv:1804.07461, 2018
work page internal anchor Pith review Pith/arXiv arXiv 2018
-
[67]
T. White. Covid-19 data for the united kingdom. https://github.com/tomwhite/ covid-19-uk-data
- [68]
-
[69]
A. Zeng, M. Chen, L. Zhang, and Q. Xu. Are transformers effective for time series forecasting? InProceedings of the AAAI conference on artificial intelligence, volume 37, pages 11121–11128, 2023. 13 A Appendix A.1 Baseline models In EpiCastBench, we benchmark the performance of fifteen forecasting models of different paradigms. A brief description of thes...
-
[70]
Chronos-2 and TimesFM alternate as the top-performing models across countries, including zero-inflated cases such as China and Canada, where both maintain stable performance. While metric-specific differences exist, they are generally modest; for example, KAN achieves the best scale-dependent performance for Colombia’s COVID-19 dataset but remains close t...
discussion (0)
Sign in with ORCID, Apple, or X to comment. Anyone can read and Pith papers without signing in.