Recognition: 2 theorem links
· Lean TheoremscShapeBench: Discovering geometry from high dimensional scRNAseq data
Pith reviewed 2026-05-14 21:17 UTC · model grok-4.3
The pith
scReebTower extracts Reeb graphs from diffusion geometry to classify single-cell data shapes more accurately than PAGA or Mapper.
A machine-rendered reading of the paper's core claim, the machinery that carries it, and where it could break.
Core claim
scShapeBench supplies ground-truth synthetic data and expert-annotated real single-cell datasets grouped into four discrete geometric categories, while scReebTower builds Reeb graphs from diffusion geometry to recover those categories and link visualization directly to pipeline selection, outperforming PAGA and Mapper on the provided evaluation metrics.
What carries the argument
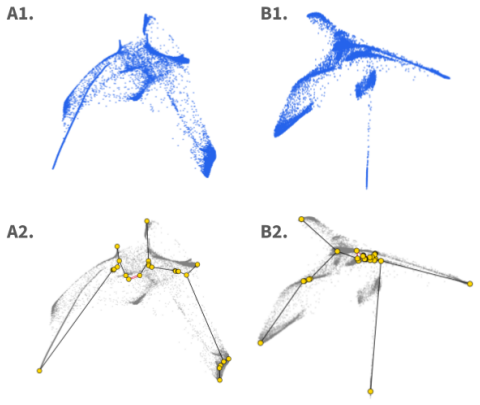
scReebTower, which constructs Reeb graphs on diffusion distances to represent the shape of high-dimensional single-cell point clouds and connect that representation to downstream analysis choice.
Where Pith is reading between the lines
- If shape detection becomes reliable, the same benchmark format could be reused to test automated pipeline selection in other high-dimensional domains such as spatial transcriptomics or flow cytometry.
- Accurate shape labels would allow direct measurement of how often current analysis choices mismatch data geometry and therefore quantify hidden bias in published single-cell studies.
- The four-category taxonomy could be expanded by measuring continuous variation between shapes rather than forcing discrete labels on borderline datasets.
Load-bearing premise
Expert annotations of real single-cell datasets into the four discrete shape categories are accurate, consistent, and sufficient to represent the geometries that matter for downstream analysis.
What would settle it
A fresh collection of single-cell datasets in which independent experts produce conflicting shape labels or in which scReebTower no longer records higher topology-aware scores than PAGA and Mapper.
Figures


read the original abstract
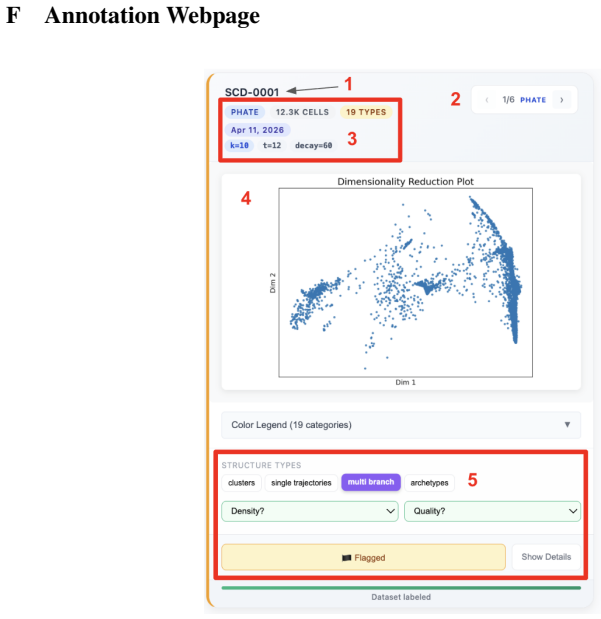
High-dimensional point cloud data arise across many scientific domains, especially single-cell biology. The shapes or topologies of these datasets determine the types of information that can be extracted. For example, clustered data supports cell-type identification, trajectory structures support transition analysis, and archetypal structures capture continua of cellular behaviors. Existing analysis pipelines often assume a specific shape. The standard Seurat pipeline combines UMAP visualization with Louvain clustering and therefore assumes clustered data, while tools such as Monocle and SPADE assume tree-like structures, and flow-based models such as MIOFlow and Conditional Flow Matching target trajectories. Choosing which pipeline to apply is therefore often left to bioinformaticians who visually inspect datasets before selecting an analysis strategy. With the rise of agentic AI scientists, automating shape detection is increasingly important for selecting downstream analysis pipelines. To address this problem, we introduce scShapeBench, a benchmark dataset for shape detection containing both synthetic and expert-annotated single-cell datasets. Synthetic datasets are sampled from ground-truth skeleton graphs with controlled variance. Real single-cell datasets are curated from diverse sources and annotated by experts into four categories: clusters, single trajectory, multi-branching, and archetypal. We additionally introduce scReebTower, a baseline method that uses diffusion geometry to extract Reeb graphs and connect visualization with pipeline selection. We provide topology-aware evaluation metrics and compare scReebTower against PAGA and Mapper on synthetic and real data. Our results indicate that scReebTower outperforms existing baselines. Overall, our contributions span benchmarks, evaluation metrics, and a baseline for automated shape detection in single-cell data.
Editorial analysis
A structured set of objections, weighed in public.
Referee Report
Summary. The paper introduces scShapeBench, a benchmark dataset for shape detection in high-dimensional scRNA-seq data comprising synthetic point clouds sampled from ground-truth skeleton graphs with controlled variance and real datasets curated from diverse sources and expert-annotated into four discrete categories (clusters, single trajectory, multi-branching, archetypal). It proposes scReebTower, a baseline method that extracts Reeb graphs via diffusion geometry to automate shape detection and link visualization to downstream pipeline selection, and evaluates it against PAGA and Mapper using topology-aware metrics, claiming outperformance on both synthetic and real data.
Significance. If the results hold, the benchmark, topology-aware metrics, and scReebTower baseline would provide a useful standardized framework for automated geometry discovery in single-cell biology, helping select appropriate analysis tools (e.g., clustering vs. trajectory inference) amid diverse data structures. The combination of synthetic ground-truth evaluation and real-data testing is a strength, as is the explicit connection between Reeb graphs and pipeline choice.
major comments (3)
- [Real data curation and annotation] Real-data evaluation section: the outperformance claim on expert-annotated datasets rests on the assumption that the four-category labels are accurate, consistent, and representative, yet no inter-annotator agreement statistics, sensitivity analysis to label flips, or protocol for handling ambiguous/mixed-topology datasets are reported. This is load-bearing for the headline result, since the topology-aware metrics are defined relative to these labels.
- [Results and evaluation] Results section: the abstract asserts that scReebTower outperforms PAGA and Mapper on topology-aware metrics, but supplies no numerical values, confidence intervals, statistical tests, or details on how synthetic variance or annotation disagreements were quantified. Without these, the strength of the superiority claim cannot be assessed.
- [scReebTower method] Method section: while scReebTower builds on standard diffusion geometry and Reeb graphs, the specific choices for diffusion operator construction, Reeb graph extraction parameters, and the mapping from graph to pipeline recommendation are not fully specified, limiting reproducibility and making it hard to isolate what drives any performance gain.
minor comments (3)
- [Abstract] Abstract: the phrase 'controlled variance' for synthetic data is used without specifying the variance schedule or sampling procedure.
- [References] Ensure all cited baselines (PAGA, Mapper, Seurat, Monocle, MIOFlow) have complete references.
- [Figures] Figure captions for Reeb graph visualizations should include explicit legends explaining node/edge coloring and any scale information.
Simulated Author's Rebuttal
We thank the referee for their constructive comments, which highlight important aspects for strengthening the manuscript. We address each major comment below and will revise the paper accordingly to improve clarity, reproducibility, and the robustness of our claims.
read point-by-point responses
-
Referee: [Real data curation and annotation] Real-data evaluation section: the outperformance claim on expert-annotated datasets rests on the assumption that the four-category labels are accurate, consistent, and representative, yet no inter-annotator agreement statistics, sensitivity analysis to label flips, or protocol for handling ambiguous/mixed-topology datasets are reported. This is load-bearing for the headline result, since the topology-aware metrics are defined relative to these labels.
Authors: We agree that validating the annotation process is essential for the real-data results. In the revised manuscript, we will report inter-annotator agreement statistics (Cohen's kappa) from the expert annotations, include a sensitivity analysis demonstrating metric stability under label perturbations, and detail our protocol for ambiguous cases (majority vote with exclusion of unresolved mixed-topology samples). These additions will directly address the load-bearing nature of the labels. revision: yes
-
Referee: [Results and evaluation] Results section: the abstract asserts that scReebTower outperforms PAGA and Mapper on topology-aware metrics, but supplies no numerical values, confidence intervals, statistical tests, or details on how synthetic variance or annotation disagreements were quantified. Without these, the strength of the superiority claim cannot be assessed.
Authors: We acknowledge that the abstract and results lack sufficient quantitative support. We will revise the abstract to include specific performance values with confidence intervals and add statistical tests (e.g., paired Wilcoxon tests) in the results section. We will also expand the evaluation protocol to explicitly describe how synthetic variance was controlled and how annotation disagreements were quantified and mitigated. revision: yes
-
Referee: [scReebTower method] Method section: while scReebTower builds on standard diffusion geometry and Reeb graphs, the specific choices for diffusion operator construction, Reeb graph extraction parameters, and the mapping from graph to pipeline recommendation are not fully specified, limiting reproducibility and making it hard to isolate what drives any performance gain.
Authors: We thank the referee for this observation on reproducibility. In the revision, we will fully specify the diffusion operator construction (kernel type, bandwidth selection via cross-validation), Reeb graph extraction parameters (level-set discretization and merging thresholds), and the exact rule-based mapping from extracted graph features to pipeline recommendations. We will also add pseudocode for the full pipeline. revision: yes
Circularity Check
No significant circularity in derivation chain
full rationale
The paper introduces scShapeBench (synthetic data from explicit ground-truth skeleton graphs plus expert-annotated real scRNA-seq data) and scReebTower (diffusion geometry plus Reeb graphs, standard techniques). It evaluates against external baselines (PAGA, Mapper) using topology-aware metrics on both synthetic and real data. No equation or step reduces by construction to a fitted parameter, self-definition, or load-bearing self-citation chain; the outperformance claim is an empirical comparison on independent inputs rather than a tautology.
Axiom & Free-Parameter Ledger
axioms (2)
- domain assumption Expert annotations of real single-cell datasets into clusters, single trajectory, multi-branching, and archetypal categories are accurate and consistent.
- domain assumption Synthetic data sampled from ground-truth skeleton graphs with controlled variance adequately models real single-cell variability.
invented entities (1)
-
scReebTower
no independent evidence
Lean theorems connected to this paper
-
IndisputableMonolith/Foundation/AlexanderDuality.leanalexander_duality_circle_linking unclear?
unclearRelation between the paper passage and the cited Recognition theorem.
scReebTower relies on the diffusion geometry to extract Reeb graphs... Use the Fiedler vector ϕ1 as a Morse function for Reeb graph construction
-
IndisputableMonolith/Foundation/AbsoluteFloorClosure.leanabsolute_floor_iff_bare_distinguishability unclear?
unclearRelation between the paper passage and the cited Recognition theorem.
We provide topology-aware evaluation metrics... Wasserstein persistence similarity and graph edit distance
What do these tags mean?
- matches
- The paper's claim is directly supported by a theorem in the formal canon.
- supports
- The theorem supports part of the paper's argument, but the paper may add assumptions or extra steps.
- extends
- The paper goes beyond the formal theorem; the theorem is a base layer rather than the whole result.
- uses
- The paper appears to rely on the theorem as machinery.
- contradicts
- The paper's claim conflicts with a theorem or certificate in the canon.
- unclear
- Pith found a possible connection, but the passage is too broad, indirect, or ambiguous to say the theorem truly supports the claim.
Reference graph
Works this paper leans on
-
[1]
Spatial reconstruction of single-cell gene expression data.Nat Biotechnol, 33(5):495–502, April 2015
Rahul Satija, Jeffrey A Farrell, David Gennert, Alexander F Schier, and Aviv Regev. Spatial reconstruction of single-cell gene expression data.Nat Biotechnol, 33(5):495–502, April 2015
work page 2015
-
[2]
Junyue Cao, Malte Spielmann, Xiaojie Qiu, Xingfan Huang, Daniel M Ibrahim, Andrew J Hill, Fan Zhang, Stefan Mundlos, Lena Christiansen, Frank J Steemers, Cole Trapnell, and Jay Shendure. The single-cell transcriptional landscape of mammalian organogenesis.Nature, 566(7745):496–502, February 2019
work page 2019
-
[3]
Benedict Anchang, Tom DP Hart, Sean C Bendall, Peng Qiu, Zach Bjornson, Michael Linder- man, Garry P Nolan, and Sylvia K Plevritis. Visualization and cellular hierarchy inference of single-cell data using spade.Nature protocols, 11(7):1264–1279, 2016
work page 2016
-
[4]
Guillaume Huguet, D. S. Magruder, Alexander Tong, Oluwadamilola Fasina, Manik Kuchroo, Guy Wolf, and Smita Krishnaswamy. Manifold interpolating optimal-transport flows for trajectory inference, 2022
work page 2022
-
[5]
Trajecto- rynet: A dynamic optimal transport network for modeling cellular dynamics
Alexander Tong, Jessie Huang, Guy Wolf, David Van Dijk, and Smita Krishnaswamy. Trajecto- rynet: A dynamic optimal transport network for modeling cellular dynamics. InInternational conference on machine learning, pages 9526–9536. PMLR, 2020
work page 2020
-
[6]
F Alexander Wolf, Fiona K Hamey, Mireya Plass, Jordi Solana, Joakim S Dahlin, Berthold Göttgens, Nikolaus Rajewsky, Lukas Simon, and Fabian J Theis. PAGA: graph abstraction reconciles clustering with trajectory inference through a topology preserving map of single cells. Genome Biol, 20(1):59, March 2019
work page 2019
-
[7]
Topological Methods for the Analysis of High Dimensional Data Sets and 3D Object Recognition
Gurjeet Singh, Facundo Memoli, and Gunnar Carlsson. Topological Methods for the Analysis of High Dimensional Data Sets and 3D Object Recognition. In M. Botsch, R. Pajarola, B. Chen, and M. Zwicker, editors,Eurographics Symposium on Point-Based Graphics. The Eurographics Association, 2007
work page 2007
-
[8]
Georges Reeb. Sur les points singuliers d’une forme de pfaff complètement intégrable ou d’une fonction numérique.Comptes Rendus de l’Académie des Sciences, 222:847–849, 1946
work page 1946
-
[9]
Diffusion maps.Applied and computational harmonic analysis, 21(1):5–30, 2006
Ronald R Coifman and Stéphane Lafon. Diffusion maps.Applied and computational harmonic analysis, 21(1):5–30, 2006
work page 2006
-
[10]
Time-inhomogeneous diffusion geometry and topology, 2023
Guillaume Huguet, Alexander Tong, Bastian Rieck, Jessie Huang, Manik Kuchroo, Matthew Hirn, Guy Wolf, and Smita Krishnaswamy. Time-inhomogeneous diffusion geometry and topology, 2023
work page 2023
-
[11]
Moyle, Manik Kuchroo, David van Dijk, Kevin R
Nathan Brugnone, Alex Gonopolskiy, Mark W. Moyle, Manik Kuchroo, David van Dijk, Kevin R. Moon, Daniel Colon-Ramos, Guy Wolf, Matthew J. Hirn, and Smita Krishnaswamy. Coarse graining of data via inhomogeneous diffusion condensation. In2019 IEEE International Conference on Big Data (Big Data), page 2624–2633. IEEE, December 2019. 10
work page 2019
-
[12]
CZI Cell Science Program, Shibla Abdulla, Brian Aevermann, Pedro Assis, Seve Badajoz, Sidney M Bell, Emanuele Bezzi, Batuhan Cakir, Jim Chaffer, Signe Chambers, et al. Cz cellxgene discover: a single-cell data platform for scalable exploration, analysis and modeling of aggregated data.Nucleic acids research, 53(D1):D886–D900, 2025
work page 2025
-
[13]
Single cell portal: an interactive home for single-cell genomics data.BioRxiv, 2023
Leyla Tarhan, Jon Bistline, Jean Chang, Bryan Galloway, Emily Hanna, and Eric Weitz. Single cell portal: an interactive home for single-cell genomics data.BioRxiv, 2023
work page 2023
-
[14]
Nancy George, Silvie Fexova, Alfonso Munoz Fuentes, Pedro Madrigal, Yalan Bi, Haider Iqbal, Upendra Kumbham, Nadja Francesca Nolte, Lingyun Zhao, Anil S Thanki, et al. Expression atlas update: insights from sequencing data at both bulk and single cell level.Nucleic Acids Research, 52(D1):D107–D114, 2024
work page 2024
-
[15]
Scanpy: large-scale single-cell gene expression data analysis.Genome biology, 19(1):15, 2018
F Alexander Wolf, Philipp Angerer, and Fabian J Theis. Scanpy: large-scale single-cell gene expression data analysis.Genome biology, 19(1):15, 2018
work page 2018
-
[16]
Moon, David van Dijk, Zheng Wang, Scott Gigante, Daniel B
Kevin R. Moon, David van Dijk, Zheng Wang, Scott Gigante, Daniel B. Burkhardt, William S. Chen, Kristina Yim, Antonia van den Elzen, Matthew J. Hirn, Ronald R. Coifman, Natalia B. Ivanova, Guy Wolf, and Smita Krishnaswamy. Visualizing structure and transitions in high- dimensional biological data.Nature Biotechnology, 37(12):1482–1492, 2019
work page 2019
-
[17]
UMAP: Uniform Manifold Approximation and Projection for Dimension Reduction
Leland McInnes, John Healy, and James Melville. Umap: Uniform manifold approximation and projection for dimension reduction.arXiv preprint arXiv:1802.03426, 2018
work page internal anchor Pith review Pith/arXiv arXiv 2018
-
[18]
Manik Kuchroo, Jessie Huang, Patrick Wong, Jean-Christophe Grenier, Dennis Shung, Alexan- der Tong, Carolina Lucas, Jon Klein, Daniel B Burkhardt, Scott Gigante, et al. Multiscale phate identifies multimodal signatures of covid-19.Nature biotechnology, 40(5):681–691, 2022
work page 2022
-
[19]
J Justin Milner, Clara Toma, Zhaoren He, Nadia S Kurd, Quynh P Nguyen, Bryan McDonald, Lauren Quezada, Christella E Widjaja, Deborah A Witherden, John T Crowl, et al. Heterogenous populations of tissue-resident cd8+ t cells are generated in response to infection and malignancy. Immunity, 52(5):808–824, 2020
work page 2020
-
[20]
Smita Krishnaswamy, Alex Tong, Manik Kuchroo, Shabarni Gupta, Aarthi Venkat, Beatriz San Juan, Laura Rangel, Brandon Zhu, John Lock, and Christine Chaffer. Revealing dynamic temporal regulatory networks driving cancer cell state plasticity with neural ode-based optimal transport. 2023
work page 2023
-
[21]
Aanet resolves a continuum of spatially localized cell states to unveil intratumoral heterogeneity
Aarthi Venkat, Scott E Youlten, Beatriz P San Juan, Carley A Purcell, Shabarni Gupta, Matthew Amodio, Daniel P Neumann, John G Lock, Anton E Westacott, Cerys S McCool, et al. Aanet resolves a continuum of spatially localized cell states to unveil intratumoral heterogeneity. Cancer Discovery, 15(10):2139–2165, 2025
work page 2025
-
[22]
Probability measures on the space of persistence diagrams.Inverse Problems, 27(12):124007, nov 2011
Yuriy Mileyko, Sayan Mukherjee, and John Harer. Probability measures on the space of persistence diagrams.Inverse Problems, 27(12):124007, nov 2011
work page 2011
-
[23]
Exploring network structure, dynamics, and function using networkx
Aric Hagberg, Pieter Swart, and Daniel Chult. Exploring network structure, dynamics, and function using networkx. 06 2008
work page 2008
-
[24]
An Exact Graph Edit Distance Algorithm for Solving Pattern Recognition Problems
Zeina Abu-Aisheh, Romain Raveaux, Jean-Yves Ramel, and Patrick Martineau. An Exact Graph Edit Distance Algorithm for Solving Pattern Recognition Problems. In4th International Conference on Pattern Recognition Applications and Methods 2015, Lisbon, Portugal, January 2015
work page 2015
-
[25]
Henry Adams, Tegan Emerson, Michael Kirby, Rachel Neville, Chris Peterson, Patrick Shipman, Sofya Chepushtanova, Eric Hanson, Francis Motta, and Lori Ziegelmeier. Persistence images: A stable vector representation of persistent homology.Journal of Machine Learning Research, 18(8):1–35, 2017
work page 2017
-
[26]
Comparing partitions.Journal of Classification, 2(1):193– 218, December 1985
Lawrence Hubert and Phipps Arabie. Comparing partitions.Journal of Classification, 2(1):193– 218, December 1985
work page 1985
-
[27]
Wouter Saelens, Robrecht Cannoodt, Helena Todorov, and Yvan Saeys. A comparison of single-cell trajectory inference methods.Nature Biotechnology, 37(5):547–554, April 2019. 11
work page 2019
-
[28]
Stability of persistence diagrams
David Cohen-Steiner, Herbert Edelsbrunner, and John Harer. Stability of persistence diagrams. volume 37, pages 263–271, 06 2005
work page 2005
-
[29]
Alexander Wolf, Florian Buettner, and Fabian J
Laleh Haghverdi, Maren Büttner, F. Alexander Wolf, Florian Buettner, and Fabian J. Theis. Diffusion pseudotime robustly reconstructs lineage branching.Nature Methods, 13(10):845–848, Oct 2016
work page 2016
-
[30]
How Powerful are Graph Neural Networks?
Keyulu Xu, Weihua Hu, Jure Leskovec, and Stefanie Jegelka. How powerful are graph neural networks?arXiv preprint arXiv:1810.00826, 2018
work page internal anchor Pith review Pith/arXiv arXiv 2018
-
[31]
Strategies for pre-training graph neural networks.arXiv preprint arXiv:1905.12265, 2019
Weihua Hu, Bowen Liu, Joseph Gomes, Marinka Zitnik, Percy Liang, Vijay Pande, and Jure Leskovec. Strategies for pre-training graph neural networks.arXiv preprint arXiv:1905.12265, 2019. 12 A Related Work Graph-based and topological structure recovery.Many methods for recovering structure from high-dimensional data begin by constructing a neighborhood grap...
discussion (0)
Sign in with ORCID, Apple, or X to comment. Anyone can read and Pith papers without signing in.