Recognition: unknown
Beyond Explained Variance: A Cautionary Tale of PCA
Pith reviewed 2026-05-14 18:25 UTC · model grok-4.3
The pith
PCA scatterplots can falsely suggest clusters in data that actually form a simple ring with no clusters.
A machine-rendered reading of the paper's core claim, the machinery that carries it, and where it could break.
Core claim
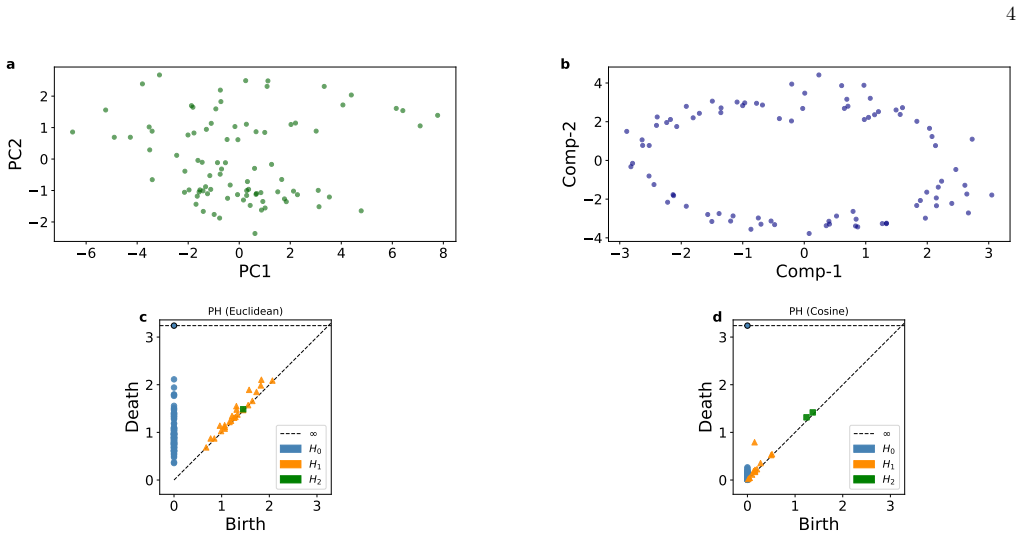
For the Kuehneotherium fossil teeth measurements, the PCA scatterplot reported in prior work displays apparent clustering where the second principal component is negative, yet t-SNE and persistent homology analysis show the data points form a ring with no evident clustering and one-dimensional intrinsic geometry. A probabilistic model in which points are drawn uniformly from a unit circle produces an arcsine distribution for pairwise cosine distances, in qualitative agreement with the U-shaped distribution present in the actual data.
What carries the argument
The generative probabilistic-geometric model of uniform sampling from a unit circle, which produces the arcsine law for cosine distances and thereby supports the ring topology identified by t-SNE and persistent homology over PCA clustering.
If this is right
- Methods that rely primarily on explained variance for visualization can distort the apparent geometry of data on nonlinear manifolds.
- Combining t-SNE with persistent homology can detect one-dimensional ring structures that PCA scatterplots obscure as clusters.
- Matching observed distance histograms to the arcsine distribution supplies an independent check on whether a circular manifold model is plausible.
Where Pith is reading between the lines
- Analyses in paleontology or materials science that use PCA for low-dimensional projections may need routine checks with topology-sensitive tools to avoid mistaking rings for clusters.
- If many biological or physical datasets prove to lie on such low-dimensional circles, distance-distribution diagnostics could become a standard preprocessing step before choosing a visualization method.
- The qualitative agreement between model and data could be turned into a quantitative test by deriving exact moments or goodness-of-fit statistics for the arcsine law on finite samples.
Load-bearing premise
That uniform sampling from a unit circle is the correct description of how the data were generated and that the qualitative match between the model's arcsine distance distribution and the observed U-shape provides independent confirmation rather than post-hoc fitting.
What would settle it
A new measurement or reanalysis of the same teeth data that shows either persistent homology confirming clusters aligned with the PCA result or a distance distribution that deviates substantially from the arcsine shape while still forming a ring in t-SNE.
Figures

read the original abstract
We address shortcomings of principal component analysis (PCA) for visualizing high-dimensional data lying on a nonlinear low-dimensional manifold via two-dimensional scatterplots, focusing on a fossil teeth dataset from the early mammalian insectivore Kuehneotherium. While the PCA scatterplot reported by Jolliffe and Cadima (Philosophical Transactions of the Royal Society A, 2016) shows clustering in the region where PC2 < 0, our analysis based on t-SNE and persistent homology (PH) reveals a ring-like structure with no evident clustering and intrinsic dimensionality equal to one. We further propose a generative probabilistic-geometric model in which the data are sampled uniformly from a unit circle. Under this model, pairwise cosine distances follow an arcsine distribution, in qualitative agreement with the observed U-shaped distribution, thereby independently supporting the analysis based on tt t-SNE and persistent homology.
Editorial analysis
A structured set of objections, weighed in public.
Referee Report
Summary. The paper argues that PCA applied to a high-dimensional fossil teeth dataset from Kuehneotherium produces misleading scatterplots that suggest clustering (particularly for PC2 < 0), whereas t-SNE and persistent homology instead reveal a ring-like structure of intrinsic dimension 1 with no evident clusters. The authors introduce a generative model in which points are sampled uniformly from a unit circle; under this model the distribution of pairwise cosine distances is arcsine, which they report is in qualitative agreement with the observed U-shaped histogram and thereby provides independent support for the ring topology.
Significance. If the ring structure and its generative description can be placed on firmer quantitative footing, the work supplies a concrete cautionary example of PCA's limitations for nonlinear manifolds in paleontological data analysis and illustrates the value of combining manifold-learning visualizations with simple probabilistic-geometric models.
major comments (2)
- [Abstract] Abstract and generative-model section: the assertion that the arcsine distribution supplies 'independent support' for the ring structure is circular. The model is introduced specifically to reproduce the observed U-shaped distance histogram; once uniform sampling on the circle is assumed, the arcsine law for the cosine of the angular difference follows immediately by transformation of variables and therefore cannot corroborate the topology inferred from t-SNE/PH.
- [Abstract] Abstract and results section on distance distributions: no quantitative goodness-of-fit statistic (Kolmogorov-Smirnov distance, chi-squared test, or bootstrap confidence bands on the histogram) is reported for the arcsine law versus the empirical pairwise-cosine distribution. Qualitative visual agreement alone leaves the support for the generative model suggestive rather than conclusive.
minor comments (1)
- [Abstract] Abstract contains the typographical error 'tt t-SNE' (should read 't-SNE').
Simulated Author's Rebuttal
We are grateful to the referee for their detailed and insightful comments, which have helped us improve the clarity and rigor of our manuscript. We respond to each major comment below.
read point-by-point responses
-
Referee: [Abstract] Abstract and generative-model section: the assertion that the arcsine distribution supplies 'independent support' for the ring structure is circular. The model is introduced specifically to reproduce the observed U-shaped distance histogram; once uniform sampling on the circle is assumed, the arcsine law for the cosine of the angular difference follows immediately by transformation of variables and therefore cannot corroborate the topology inferred from t-SNE/PH.
Authors: We appreciate this observation and agree that the term 'independent support' could be misinterpreted. The ring structure is primarily inferred from the t-SNE visualization and persistent homology analysis, which indicate a one-dimensional manifold without clusters. The generative model of uniform sampling on a unit circle is then introduced as a minimal probabilistic model that reproduces the characteristic U-shaped histogram of pairwise cosine distances observed in the data. While the arcsine distribution follows directly from the model assumptions, the fact that this simple model aligns with the empirical distance distribution provides a parsimonious geometric explanation consistent with the manifold-learning results. We will revise the abstract and the generative-model section to replace 'independently supporting' with language emphasizing consistency and explanatory power, avoiding any implication of statistical independence. revision: partial
-
Referee: [Abstract] Abstract and results section on distance distributions: no quantitative goodness-of-fit statistic (Kolmogorov-Smirnov distance, chi-squared test, or bootstrap confidence bands on the histogram) is reported for the arcsine law versus the empirical pairwise-cosine distribution. Qualitative visual agreement alone leaves the support for the generative model suggestive rather than conclusive.
Authors: We concur that quantitative measures would strengthen the presentation. In the revised version, we will compute and report a Kolmogorov-Smirnov statistic for the fit between the empirical distribution of pairwise cosine distances and the theoretical arcsine distribution. Additionally, we will include bootstrap-derived confidence bands on the empirical histogram to provide a visual and quantitative assessment of the agreement. These additions will make the support for the generative model more conclusive. revision: yes
Circularity Check
Arcsine agreement follows by construction from the circle model chosen to match the observed ring, supplying no independent support
specific steps
-
fitted input called prediction
[Abstract]
"We further propose a generative probabilistic-geometric model in which the data are sampled uniformly from a unit circle. Under this model, pairwise cosine distances follow an arcsine distribution, in qualitative agreement with the observed U-shaped distribution, thereby independently supporting the analysis based on t-SNE and persistent homology."
The arcsine distribution for the dot product of two independent uniform points on the circle follows immediately from the angular difference being uniform on [0, π] via standard change of variables. Once the model is selected to reproduce the ring structure and U-shape seen in the data, the agreement is mathematically forced and cannot furnish independent corroboration of the data-generating process or of the t-SNE/PH topology.
full rationale
The paper's topology conclusion rests on t-SNE and persistent homology. The generative model is then posited as uniform sampling on the unit circle specifically to account for the ring and the U-shaped distances. The arcsine law for cosine distances is a standard transformation of variables once the model is fixed, so the reported qualitative agreement is guaranteed rather than corroborative. This matches the fitted-input-called-prediction pattern and is presented as independent support, creating partial circularity in the derivation chain even though the core manifold inference itself is not reduced.
Axiom & Free-Parameter Ledger
axioms (1)
- domain assumption The observed data points can be modeled as uniformly sampled from a unit circle in some embedding space.
Reference graph
Works this paper leans on
-
[1]
To this end, various heuristics exist
Estimating Intrinsic Dimensionality using PCA Within PCA, the methods for estimating the intrin- sic (or effective) dimension, which, in this context, cor- responds to deciding how many principal components (PCs) to keep. To this end, various heuristics exist. In this work, we shall consider the following ones: Kaiser criterion (also known as the Kaiser-G...
work page 2004
-
[2]
Pearson, Philosophical Magazine Series 12, 559 (1901)
K. Pearson, Philosophical Magazine Series 12, 559 (1901)
work page 1901
-
[3]
Hotelling, Journal of Educational Psychology24, 498 (1933)
H. Hotelling, Journal of Educational Psychology24, 498 (1933)
work page 1933
-
[4]
I. T. Jolliffe,Principal Component Analysis, Springer Series in Statistics (Springer, New York, NY, 2002), 2nd ed., ISBN 978-0-387-95442-4, springer Science+Business Media New York; eBook ISBN: 978-0-387-22440-4; Softcover ISBN: 978-1- 4419-2999-0; Published in Springer Book Archive
work page 2002
-
[5]
A Tutorial on Principal Component Analysis
J. Shlens,A tutorial on principal component analysis(2014), 1404.1100, URLhttps://arxiv.org/abs/1404.1100
work page internal anchor Pith review Pith/arXiv arXiv 2014
-
[6]
M. Greenacre, P. J. F. Groenen, T. Hastie, A. I. D’Enza, A. I. Markos, and E. Tuzhilina, Nature Reviews Methods Primers 2(2022)
work page 2022
-
[7]
M. Scheidgen, L. Himanen, A. Ladines, D. Sikter, M. Nakhaee, ´A. Fekete, T.-C. Chang, A. Golparvar, J. Mar´ ıquez, S. Brockhauser, et al., Journal of Open Source Software8, 5388 (2023), URLhttps://doi.org/10.21105/joss.05388
-
[8]
M. K. Horton, P. Huck, R. X. Yang, J. M. Munro, S. Dwaraknath, A. M. Ganose, R. S. Kingsbury, M. Wen, J. X. Shen, T. S. Mathis, et al., Nature Materials24, 1522 (2025), ISSN 1476-4660, URLhttps://doi.org/10.1038/s41563-025-02272-0
-
[9]
H. M. Berman, T. Battistuz, T. N. Bhat, W. Bluhm, P. E. Bourne, K. Burkhardt, L. Iype, S. Jain, P. Fagan, J. Marvin, et al., Nucleic Acids Research28, 235 (2000), the worldwide repository of experimentally determined macromolecular structures, URLhttps://www.rcsb.org/
work page 2000
- [10]
- [11]
-
[12]
M. P. Deisenroth, A. A. Faisal, and C. S. Ong,Mathematics for Machine Learning(Cambridge University Press, 2020)
work page 2020
-
[13]
P. G. Gill, M. A. Purnell, N. Crumpton, K. R. Brown, N. J. Gostling, M. Stampanoni, and E. J. Rayfield, Nature512, 303 (2014), ISSN 1476-4687, URLhttps://doi.org/10.1038/nature13622
-
[15]
L. van der Maaten and G. Hinton, Journal of Machine Learning Research9, 2579 (2008)
work page 2008
-
[16]
D. Kobak and P. Berens, Nature Communications10, 5416 (2019), ISSN 2041-1723, URLhttps://doi.org/10.1038/ s41467-019-13056-x
work page 2019
-
[17]
G. E. Carlsson, Bulletin of the American Mathematical Society46, 255 (2009)
work page 2009
-
[18]
N. Otter, M. A. Porter, U. Tillmann, P. Grindrod, and H. A. Harrington, EPJ Data Science6, 17 (2017), ISSN 2193-1127, URLhttps://doi.org/10.1140/epjds/s13688-017-0109-5
-
[19]
Wasserman, Annual Review of Statistics and Its Application5, 501 (2018)
L. Wasserman, Annual Review of Statistics and Its Application5, 501 (2018)
work page 2018
-
[20]
E. Munch, Journal of Learning Analytics4, 47–61 (2017), URLhttps://learning-analytics.info/index.php/JLA/ article/view/5196
work page 2017
- [21]
-
[23]
S. Damrich, P. Berens, and D. Kobak,Persistent homology for high-dimensional data based on spectral methods(2024), 2311.03087, URLhttps://arxiv.org/abs/2311.03087
-
[24]
L´ evy, Compositio Mathematica7, 283 (1939)
P. L´ evy, Compositio Mathematica7, 283 (1939)
work page 1939
-
[25]
Strang, The American Mathematical Monthly100, 848 (1993)
G. Strang, The American Mathematical Monthly100, 848 (1993)
work page 1993
-
[26]
G. W. Stewart, SIAM Review35, 551 (1993)
work page 1993
-
[27]
Shinn, Proceedings of the National Academy of Sciences120, e2311420120 (2023)
M. Shinn, Proceedings of the National Academy of Sciences120, e2311420120 (2023)
work page 2023
-
[28]
F. Pedregosa, G. Varoquaux, A. Gramfort, V. Michel, B. Thirion, O. Grisel, M. Blondel, P. Prettenhofer, R. Weiss, V. Dubourg, et al., Journal of Machine Learning Research12, 2825 (2011), URLhttp://jmlr.org/papers/v12/ pedregosa11a.html
work page 2011
-
[29]
H. F. Kaiser, Educational and Psychological Measurement20, 141 (1960), https://doi.org/10.1177/001316446002000116, URLhttps://doi.org/10.1177/001316446002000116
-
[30]
J. B. Tenenbaum, V. de Silva, and J. C. Langford, Science290, 2319 (2000)
work page 2000
-
[31]
A. G´ eron,Hands-On Machine Learning with Scikit-Learn and TensorFlow: Concepts, Tools, and Techniques to Build Intelligent Systems(O’ReillY, U.S.A, 2019)
work page 2019
-
[32]
M. A. Kramer, AIChE Journal37, 233 (1991)
work page 1991
-
[33]
S. Recanatesi, S. Bradde, V. Balasubramanian, N. A. Steinmetz, and E. Shea-Brown, Patterns3, 100555 (2022), ISSN 2666-3899, URLhttps://www.sciencedirect.com/science/article/pii/S266638992200160X
work page 2022
-
[34]
M. Gavish and D. L. Donoho, IEEE Transactions on Information Theory60, 5040 (2014)
work page 2014
-
[36]
V. A. Marˇ cenko and L. A. Pastur, Mathematics of the USSR-Sbornik1, 457 (1967)
work page 1967
-
[37]
C. de Bodt, A. Diaz-Papkovich, M. Bleher, K. Bunte, C. Coupette, S. Damrich, E. F. Sanmartin, F. A. Hamprecht, E. ´Agnes Horv´ at, D. Kohli, et al.,Low-dimensional embeddings of high-dimensional data(2025), 2508.15929, URLhttps: //arxiv.org/abs/2508.15929. 6
-
[38]
P. G. Poliˇ car, M. Straˇ zar, and B. Zupan, Journal of Statistical Software109, 1–30 (2024), URLhttps://www.jstatsoft. org/index.php/jss/article/view/v109i03
work page 2024
-
[39]
Villani,Optimal Transport: Old and New(Springer, Berlin, Heidelberg, 2008)
C. Villani,Optimal Transport: Old and New(Springer, Berlin, Heidelberg, 2008)
work page 2008
- [40]
-
[41]
G. Tauzin, U. Lupo, L. Tunstall, J. B. P´ erez, M. Caorsi, A. Medina-Mardones, A. Dassatti, and K. Hess,giotto-tda: A topological data analysis toolkit for machine learning and data exploration(2020), 2004.02551
-
[42]
K. P. Murphy,Machine learning - a probabilistic perspective(MIT Press, Cambridge, Massachusetts, 2012)
work page 2012
-
[43]
K. Zeng, C. E. P. De Jes´ us, A. J. Fox, and M. D. Graham, Machine Learning: Science and Technology5, 025053 (2024), URLhttps://doi.org/10.1088/2632-2153/ad4ba5
-
[44]
K. V. Mardia and P. E. Jupp,Directional Statistics, Wiley Series in Probability and Statistics (Wiley, 2000), ISBN 978-0471953333
work page 2000
-
[45]
G. Casella and R. L. Berger,Statistical Inference(Duxbury, 2002), 2nd ed
work page 2002
-
[46]
K. V. Bury,Statistical Distributions in Engineering(Cambridge University Press, 1999)
work page 1999
-
[47]
Wes McKinney, inProceedings of the 9th Python in Science Conference, edited by St´ efan van der Walt and Jarrod Millman (2010), pp. 56 – 61
work page 2010
-
[48]
Akaike, 2nd International Symposium on Information Theory pp
H. Akaike, 2nd International Symposium on Information Theory pp. 267–281 (1973)
work page 1973
-
[49]
Schwarz, The Annals of Statistics6, 461 (1978)
G. Schwarz, The Annals of Statistics6, 461 (1978)
work page 1978
-
[50]
C. Zanolli, F. Bouchet, J. Fortuny, F. Bernardini, C. Tuniz, and D. M. Alba, Journal of Human Evolution177, 103326 (2023), ISSN 0047-2484, URLhttps://www.sciencedirect.com/science/article/pii/S0047248423000039
work page 2023
-
[51]
P. G. Gill, Ph.D. thesis, University of Bristol (2004)
work page 2004
-
[52]
P. G. Gill, M. A. Purnell, N. Crumpton, K. R. Brown, N. J. Gostling, M. Stampanoni, and E. J. Rayfield, Nature512, 303 (2014)
work page 2014
-
[53]
P. G. Gill,Personal correspondence(2025)
work page 2025
-
[54]
D. F. Andrews, Biometrics28, 125 (1972)
work page 1972
-
[55]
C. Garc´ ıa-Osorio and C. Fyfe, Journal of Universal Computer Science11, 1806 (2005)
work page 2005
-
[56]
McKinney, inProceedings of the 9th Python in Science Conference, edited by S
W. McKinney, inProceedings of the 9th Python in Science Conference, edited by S. van der Walt and J. Millman (2010), pp. 56–61
work page 2010
-
[57]
I. T. Jolliffe and J. Cadima, Philosophical Transactions of the Royal Society A: Mathematical, Physical and Engineering Sciences374, 20150202 (2016)
work page 2016
-
[58]
S. Damrich, O. Bobrowski, and P. Skraba, arXiv preprint arXiv:2305.15640 (2023)
-
[59]
R. Vershynin,High-Dimensional Probability: An Introduction with Applications in Data Science, Cambridge Series in Statistical and Probabilistic Mathematics (Cambridge University Press, 2018)
work page 2018
-
[60]
S. L. Brunton and J. N. Kutz,Data-Driven Science and Engineering: Machine Learning, Dynamical Systems, and Control (Cambridge University Press, 2019)
work page 2019
discussion (0)
Sign in with ORCID, Apple, or X to comment. Anyone can read and Pith papers without signing in.