Uncertainty-Aware Wildfire Smoke Density Classification from Satellite Imagery via CBAM-Augmented EfficientNet with Evidential Deep Learning
Pith reviewed 2026-05-20 19:08 UTC · model grok-4.3
The pith
A CBAM-augmented EfficientNet with evidential deep learning classifies satellite wildfire smoke into light moderate or heavy while estimating epistemic and aleatoric uncertainty directly.
A machine-rendered reading of the paper's core claim, the machinery that carries it, and where it could break.
Core claim
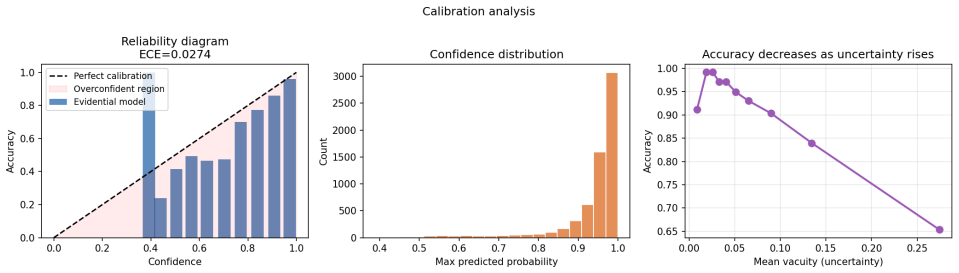
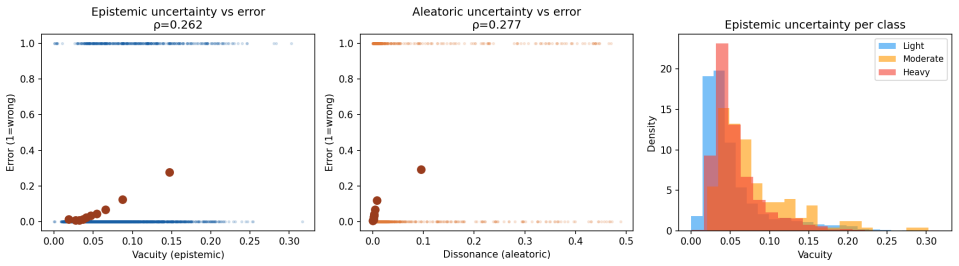
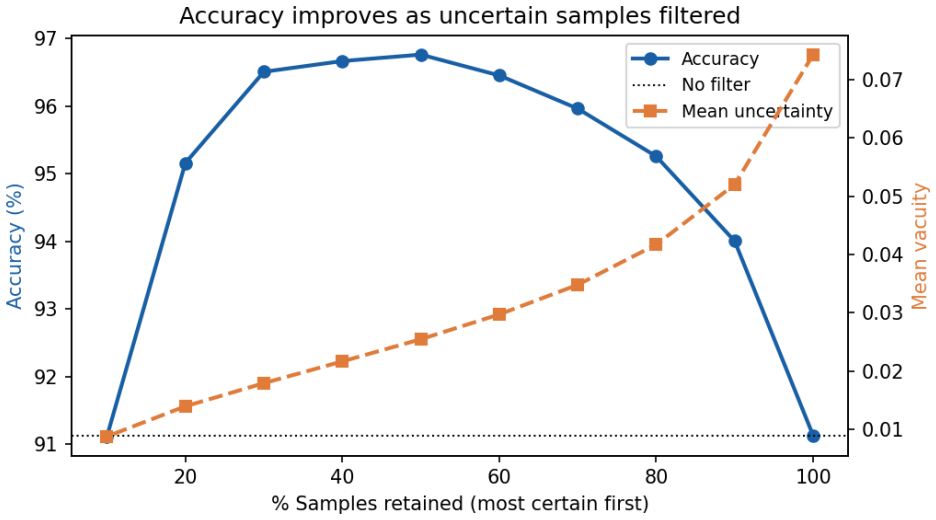
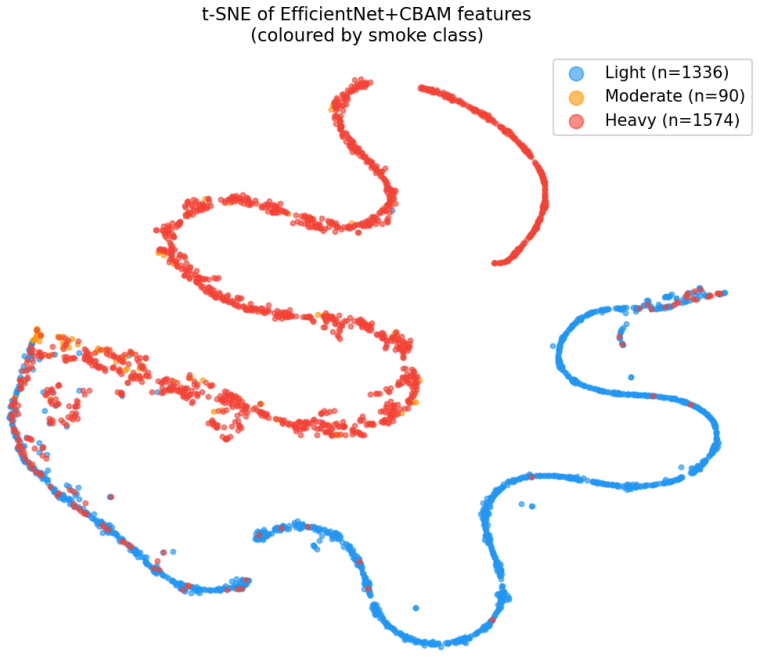
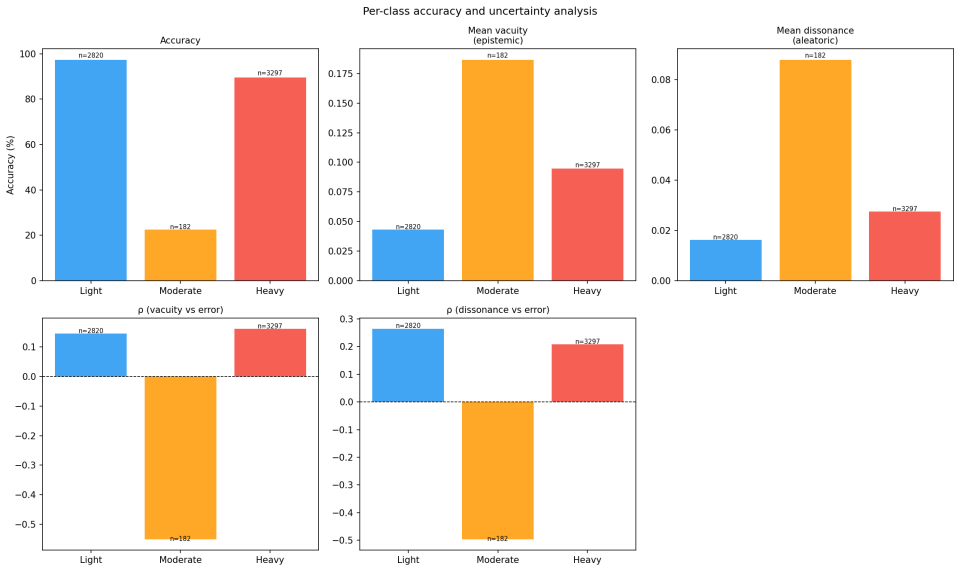
On 16298 real satellite patches the CBAM-augmented EfficientNet-B3 with evidential head reaches 93.8 percent weighted accuracy and 91.1 percent unweighted accuracy with an expected calibration error of 0.0274. Retaining only the 50 percent of patches with lowest uncertainty lifts accuracy to 96.7 percent. As image quality is degraded uncertainty rises monotonically, vacuity serves as a scan-quality indicator, and the Moderate class records the highest mean vacuity of 0.187, confirming that the model recognizes transitional smoke boundaries as the most epistemically uncertain. CBAM attention maps localize to structurally distinctive regions and t-SNE embeddings show clear separation between L
What carries the argument
Evidential deep learning head that predicts Dirichlet concentration parameters to produce class probabilities together with vacuity (epistemic) and dissonance (aleatoric) uncertainty values in one forward pass.
If this is right
- The model reaches 93.8 percent weighted test accuracy and 0.0274 expected calibration error on real satellite patches.
- Selective prediction on the most certain 50 percent of patches raises accuracy to 96.7 percent.
- Uncertainty values increase monotonically as image quality degrades, allowing vacuity to serve as a practical scan-quality measure.
- The Moderate class exhibits the highest mean epistemic uncertainty of 0.187, matching its transitional character.
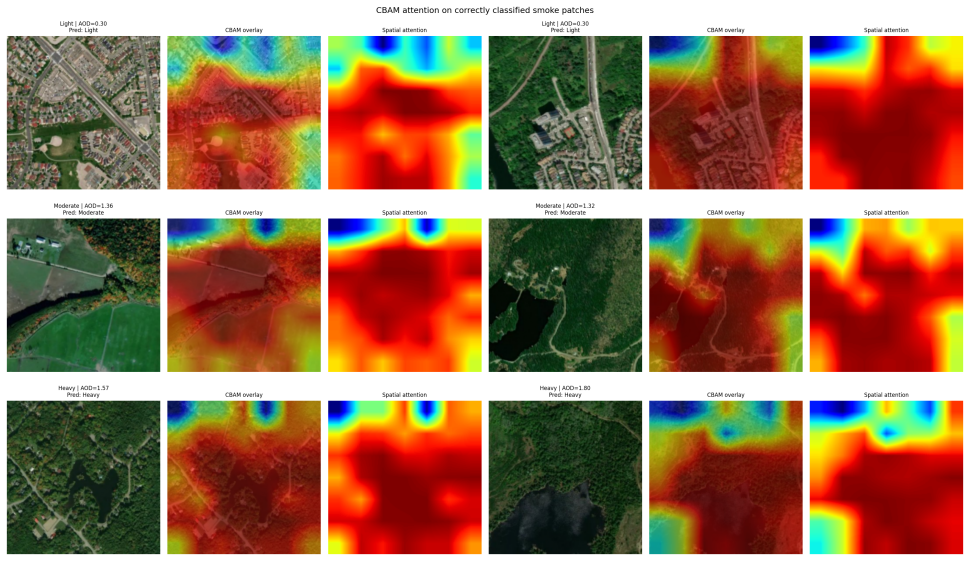
- CBAM attention maps focus on structurally distinctive scene regions while t-SNE shows clear separation of Light and Heavy classes.
Where Pith is reading between the lines
- Operational wildfire systems could route high-vacuity Moderate patches to human review or additional sensors first.
- The monotonic uncertainty response to degradation could be used to automatically discard or re-acquire poor-quality satellite passes.
- The same single-pass uncertainty decomposition might transfer to other satellite tasks that involve gradual transitions, such as cloud or flood mapping.
- Selective prediction could be combined with cost-sensitive routing so that low-certainty alerts trigger cheaper verification steps.
Load-bearing premise
The evidential head correctly extracts epistemic uncertainty as vacuity and aleatoric uncertainty as dissonance from the Dirichlet parameters, and the Moderate class labels genuinely mark transitional smoke conditions expected to carry the highest epistemic uncertainty.
What would settle it
Progressively degrade the satellite patches by adding noise or lowering resolution and check whether reported vacuity increases at each step; separately compare mean vacuity across the three classes to test whether Moderate remains highest.
Figures
read the original abstract
Rapid and accurate wildfire smoke severity assessment from satellite images is essential for emergency response, air quality modeling, and human health risk management. Existing deep learning approaches treat smoke detection as a binary task, producing point estimates without any measure of prediction confidence. We propose a probabilistic framework to categorize a satellite patch into Light, Moderate, and Heavy severity classes and to provide decomposed epistemic and aleatoric uncertainty in a single forward pass. Our architecture uses the backbone of a pre-trained EfficientNet-B3 and a CBAM module with an evidential deep learning head that predicts Dirichlet concentration parameters, directly estimating vacuity (epistemic) and dissonance (aleatoric) without Monte Carlo sampling. Evaluated on 16,298 real satellite patches derived from the Wildfire Detection dataset, our model achieves 93.8% weighted test accuracy (91.1% unweighted) with ECE=0.0274. Selective prediction retaining the most certain 50% of patches achieves 96.7% accuracy. As image quality degrades, uncertainty increases monotonically, and vacuity is a practical scan quality measure. The Moderate class represents transitional smoke conditions that exhibit the highest epistemic uncertainty (mean vacuity = 0.187), confirming the model correctly identifies ambiguous smoke boundary regions. CBAM spatial attention maps localize to structurally distinctive scene regions, and t-SNE demonstrates the clear cluster separation of Light and Heavy smoke.
Editorial analysis
A structured set of objections, weighed in public.
Referee Report
Summary. The paper introduces a CBAM-augmented EfficientNet-B3 backbone with an evidential deep learning head that outputs Dirichlet concentration parameters for three-class (Light/Moderate/Heavy) wildfire smoke density classification from satellite patches. It reports 93.8% weighted and 91.1% unweighted accuracy, ECE=0.0274 on 16,298 real patches, 96.7% accuracy under selective prediction on the top 50% most certain samples, monotonic uncertainty growth under degradation, and highest mean vacuity (0.187) for the Moderate class, interpreted as successful capture of epistemic uncertainty at smoke boundaries. CBAM attention maps and t-SNE visualizations support interpretability.
Significance. If the central empirical results and uncertainty decomposition hold after addressing label validation, the work offers a computationally efficient, single-pass method for uncertainty-aware smoke severity assessment that could support real-time emergency response and air-quality applications. The decomposed vacuity/dissonance outputs and selective-prediction gains are practically useful; the approach avoids Monte Carlo sampling while providing attention-based localization. Credit is due for the concrete accuracy/ECE/selective numbers on a sizable real dataset and the monotonic degradation test.
major comments (1)
- [Abstract and Results (per-class uncertainty analysis)] Abstract and Results section on per-class uncertainty: the claim that Moderate patches exhibit the highest epistemic uncertainty (mean vacuity = 0.187) and thereby confirm that the model 'correctly identifies ambiguous smoke boundary regions' is load-bearing for the uncertainty-aware contribution. This interpretation requires that the derived Moderate labels genuinely correspond to transitional density states rather than annotation heuristics, imbalance artifacts, or subjective thresholds. Without additional validation (e.g., expert re-labeling of Moderate samples or controlled boundary-case experiments), the reported monotonic uncertainty increase and selective-prediction improvement lose their supporting interpretation for epistemic capture, even if raw accuracy and ECE remain high.
minor comments (2)
- [Methods] Training protocol and hyper-parameter details for the evidential head (e.g., annealing schedule for Dirichlet parameters, loss weighting) are only sketched; explicit values or a reproducibility checklist would strengthen the manuscript.
- [Results (visualizations)] Figure 3 (t-SNE) and attention-map figures would benefit from quantitative cluster-separation metrics (e.g., silhouette score) to support the qualitative claim of 'clear cluster separation'.
Simulated Author's Rebuttal
We thank the referee for the thoughtful and detailed review. The concern about the evidential support for interpreting Moderate-class vacuity as evidence of epistemic capture at true transitional boundaries is well-taken. We address this point directly below and indicate the revisions we will make.
read point-by-point responses
-
Referee: [Abstract and Results (per-class uncertainty analysis)] Abstract and Results section on per-class uncertainty: the claim that Moderate patches exhibit the highest epistemic uncertainty (mean vacuity = 0.187) and thereby confirm that the model 'correctly identifies ambiguous smoke boundary regions' is load-bearing for the uncertainty-aware contribution. This interpretation requires that the derived Moderate labels genuinely correspond to transitional density states rather than annotation heuristics, imbalance artifacts, or subjective thresholds. Without additional validation (e.g., expert re-labeling of Moderate samples or controlled boundary-case experiments), the reported monotonic uncertainty increase and selective-prediction improvement lose their supporting interpretation for epistemic capture, even if raw accuracy and ECE remain high.
Authors: We agree that the interpretive claim in the abstract and results section is stronger than the supporting evidence for label provenance allows. The Moderate labels are taken directly from the source Wildfire Detection dataset and were produced by its original annotators using visual density heuristics; we do not possess independent expert re-annotation or controlled boundary experiments. In the revised manuscript we will (i) add a concise description of label provenance in the Dataset subsection, (ii) replace the word “confirming” with “consistent with the hypothesis that” in both the abstract and the per-class uncertainty paragraph, and (iii) insert a short limitations paragraph acknowledging possible subjectivity or threshold effects in the Moderate class. The numerical results—weighted accuracy, ECE, selective-prediction gains, and monotonic uncertainty growth under degradation—do not rely on this interpretation and will remain unchanged. We therefore view the revision as partial: textual clarification and tempering of language rather than new empirical validation. revision: partial
Circularity Check
No significant circularity; empirical evaluation on external dataset with standard evidential formulation
full rationale
The paper's central results consist of training a CBAM-augmented EfficientNet-B3 with an evidential deep learning head on the Wildfire Detection dataset and reporting test accuracy, ECE, selective prediction performance, and uncertainty trends on held-out patches. The evidential head follows the standard Dirichlet concentration parameterization from prior literature rather than deriving it internally. No load-bearing step reduces a claimed prediction or uniqueness result to a fitted parameter or self-citation by construction. The interpretation of Moderate-class vacuity is an empirical observation on the given labels, not a definitional equivalence. The derivation chain is therefore self-contained against external benchmarks.
Axiom & Free-Parameter Ledger
free parameters (1)
- Dirichlet concentration parameters
Reference graph
Works this paper leans on
-
[1]
A. Aaba. Wildfire detection from satellite images. Kaggle dataset, 2022. URL https://www.kaggle. com/datasets/abdelghaniaaba/wildfire-detection-from-satellite-images
work page 2022
- [2]
-
[3]
N. Audebert, B. Le Saux, and S. Lef`evre. Beyond rgb: Very high resolution urban remote sensing with multimodal deep networks.ISPRS journal of photogrammetry and remote sensing, 140:20–32, 2018
work page 2018
-
[4]
R. Ba, C. Chen, J. Yuan, W. Song, and S. Lo. Smokenet: Satellite smoke scene detection using convolutional neural network with spatial and channel-wise attention.Remote Sensing, 11(14), 2019. ISSN 2072-4292. doi: 10.3390/rs11141702. URLhttps://www.mdpi.com/2072-4292/11/14/1702
-
[5]
J. Deng, W. Dong, R. Socher, L.-J. Li, K. Li, and L. Fei-Fei. Imagenet: A large-scale hierarchical image database. In2009 IEEE Conference on Computer Vision and Pattern Recognition, pages 248–255, 2009. doi: 10.1109/CVPR.2009.5206848
- [6]
-
[7]
R. Ghali and M. A. Akhloufi. Deep learning approaches for wildland fires using satellite remote sensing data: Detection, mapping, and prediction.Fire, 6(5), 2023. ISSN 2571-6255. doi: 10.3390/fire6050192. URLhttps://www.mdpi.com/2571-6255/6/5/192
-
[8]
F. C. Ghesu, B. Georgescu, A. Mansoor, Y . Yoo, E. Gibson, R. Vishwanath, A. Balachandran, J. M. Balter, Y . Cao, R. Singh, et al. Quantifying and leveraging predictive uncertainty for medical image assessment. Medical Image Analysis, 68:101855, 2021
work page 2021
-
[9]
J. Hu, L. Shen, and G. Sun. Squeeze-and-excitation networks. InProceedings of the IEEE conference on computer vision and pattern recognition, pages 7132–7141, 2018
work page 2018
-
[10]
K. Hutchison, B. Iisager, T. Kopp, and J. Jackson. Distinguishing aerosols from clouds in global, multi- spectral satellite data with automated cloud classification algorithms.Journal of Atmospheric and Oceanic Technology - J ATMOS OCEAN TECHNOL, 25, 04 2008. doi: 10.1175/2007JTECHA1004.1
-
[11]
P. Jain, S. C. Coogan, S. G. Subramanian, M. Crowley, S. Taylor, and M. D. Flannigan. A review of machine learning applications in wildfire science and management.Environmental Reviews, 28(4):478–505, 2020. ISSN 1208-6053. doi: https://doi.org/10.1139/er-2020-0019. URL https://www.sciencedirect. com/science/article/pii/S1208605320000374
-
[12]
M. W. Jones, A. Smith, R. Betts, J. G. Canadell, I. C. Prentice, and C. L. Qu ´er´e. Climate change increases the risk of wildfires. Technical report, Tyndall Centre for Climate Change Research, 2020. URL http://www.jstor.org/stable/resrep51248
work page 2020
-
[13]
Y . J. Kaufman, C. O. Justice, L. P. Flynn, J. D. Kendall, E. M. Prins, L. Giglio, D. E. Ward, W. P. Menzel, and A. W. Setzer. Potential global fire monitoring from eos-modis.Journal of Geophysical Research: Atmospheres, 103(D24):32215–32238, 1998. doi: https://doi.org/10.1029/98JD01644. URL https://agupubs.onlinelibrary.wiley.com/doi/abs/10.1029/98JD01644
-
[14]
F. Laden, J. Schwartz, F. E. Speizer, and D. W. Dockery. Reduction in fine particulate air pollution and mortality: Extended follow-up of the harvard six cities study.American Journal of Respiratory and Critical Care Medicine, 173(6):667–672, 03 2006. doi: 10.1164/rccm.200503-443OC. URL https: //doi.org/10.1164/rccm.200503-443OC
-
[15]
B. Lakshminarayanan, A. Pritzel, and C. Blundell. Simple and scalable predictive uncertainty estimation using deep ensembles.Advances in neural information processing systems, 30, 2017
work page 2017
- [16]
- [17]
-
[18]
C. J. Tucker. Red and photographic infrared linear combinations for monitoring vegetation.Remote Sensing of Environment, 8(2):127–150, 1979. ISSN 0034-4257. doi: https://doi.org/10.1016/0034-4257(79)90013-0. URLhttps://www.sciencedirect.com/science/article/pii/0034425779900130
-
[19]
S. Woo, J. Park, J.-Y . Lee, and I. S. Kweon. Cbam: Convolutional block attention module. InProceedings of the European conference on computer vision (ECCV), pages 3–19, 2018
work page 2018
- [20]
-
[21]
URL https://www.sciencedirect.com/ science/article/pii/S0034425718305236
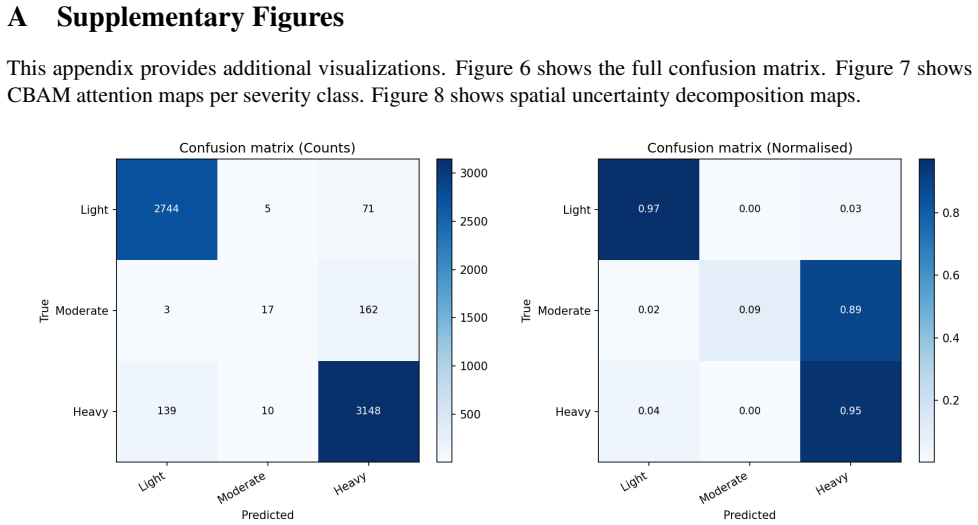
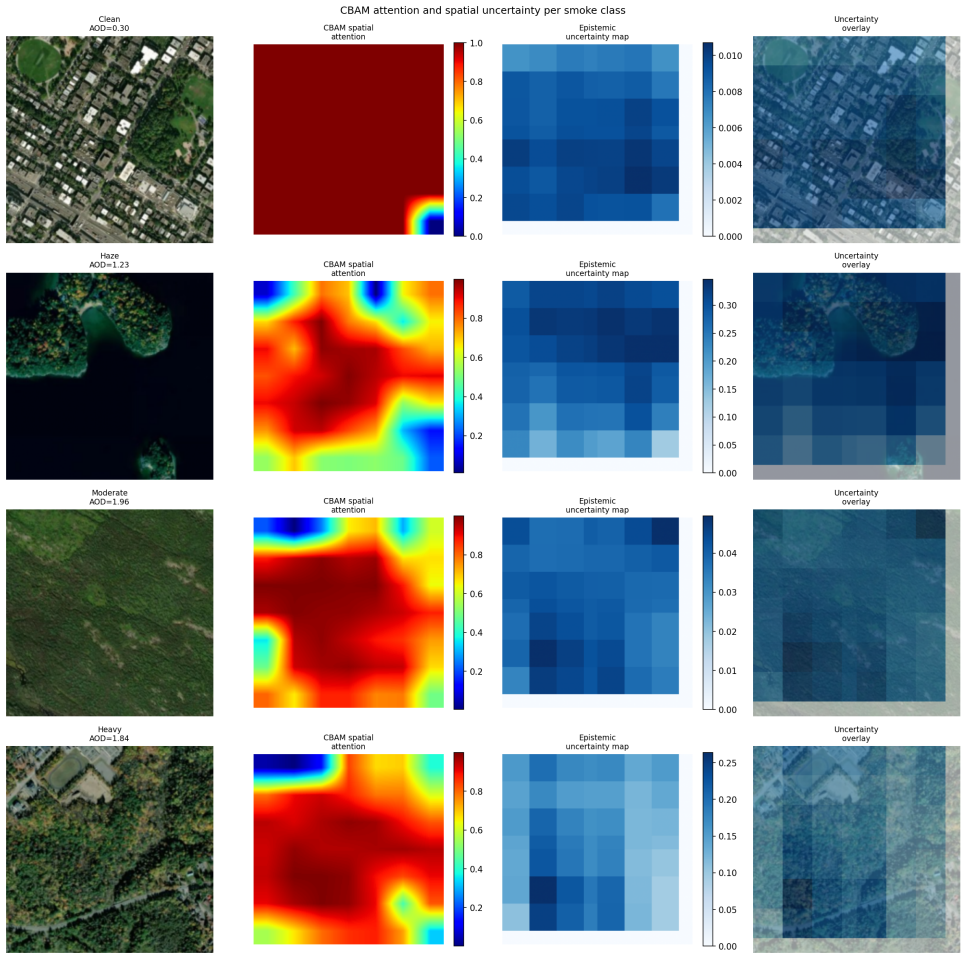
doi: https://doi.org/10.1016/j.rse.2018.11.014. URL https://www.sciencedirect.com/ science/article/pii/S0034425718305236. 13 A Supplementary Figures This appendix provides additional visualizations. Figure 6 shows the full confusion matrix. Figure 7 shows CBAM attention maps per severity class. Figure 8 shows spatial uncertainty decomposition maps. Figure...
discussion (0)
Sign in with ORCID, Apple, or X to comment. Anyone can read and Pith papers without signing in.