TailedTS: Benchmark Dataset for Heavy-Tailed Time Series Prediction and Periodicity Quantification
Pith reviewed 2026-05-20 22:37 UTC · model grok-4.3
The pith
Frequently viewed Wikipedia pages exhibit significantly weaker periodic structure than less-viewed pages.
A machine-rendered reading of the paper's core claim, the machinery that carries it, and where it could break.
Core claim
The central claim is that frequently-viewed Wikipedia pages exhibit significantly weaker periodic structure than their less-viewed counterparts, quantified through a periodicity framework based on sparse autoregression with sparsity and non-negativity constraints, with direct consequences for server allocation and traffic forecasting on large digital platforms.
What carries the argument
A periodicity quantification framework based on sparse autoregression with sparsity and non-negativity constraints that measures the strength of periodic patterns across different traffic volumes.
Load-bearing premise
The power-law distribution and periodicity differences observed in 2024 Wikipedia data hold for other heavy-tailed time series outside this platform and time window.
What would settle it
Re-running the sparse autoregression analysis on Wikipedia data from a different year or on hourly traffic from another high-volume platform would show whether the weaker periodicity in popular pages persists.
Figures


read the original abstract
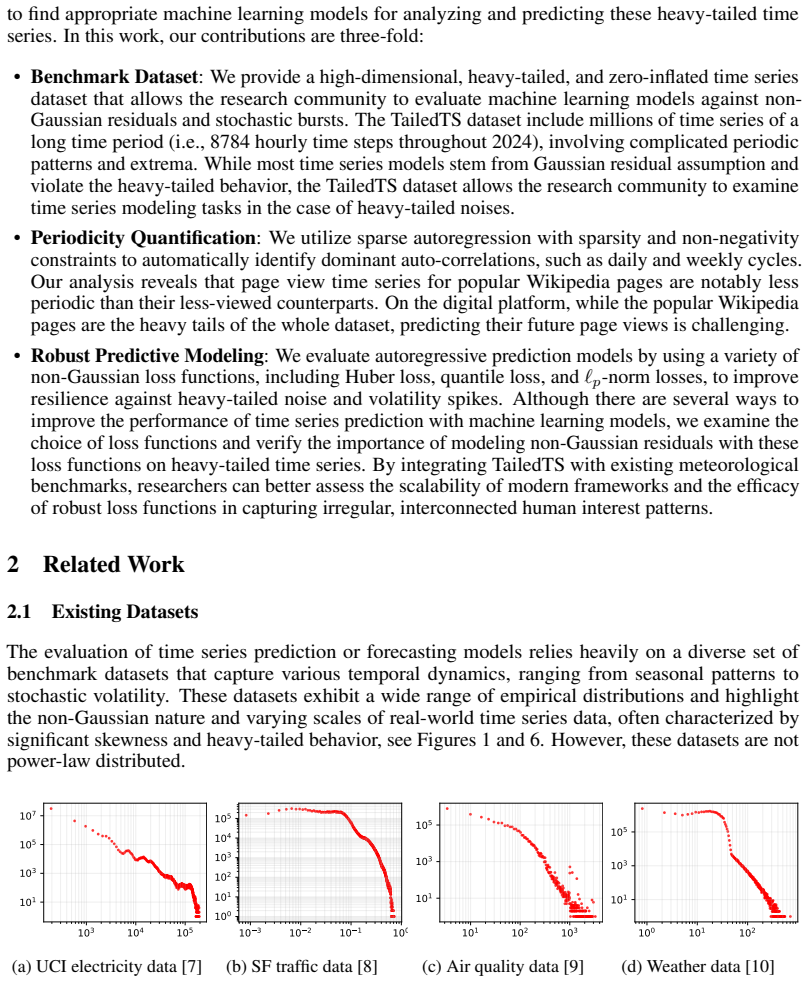
We present TailedTS, a large-scale benchmark dataset derived from Wikipedia hourly page view observations throughout 2024, specifically designed to test time series forecasting models under heavy-tailed, zero-inflated, and non-Gaussian conditions. The dataset comprises approximately 24.69 billion data points spanning roughly 3 million unique Wikipedia pages per month, stored in high-efficiency Apache Parquet format. Wikipedia traffic follows a pronounced power-law distribution where roughly 5% of pages account for over 70% of total page views, creating a natural and rigorous testbed for model robustness against extreme volatility that are absent from or underrepresented in existing benchmarks such as M4, M5, and UCI electricity datasets. TailedTS enables several research tasks. First, we introduce a periodicity quantification framework based on sparse autoregression with sparsity and non-negativity constraints, revealing that frequently-viewed pages exhibit significantly weaker periodic structure than their less-viewed counterparts, showing direct implications for server allocation and traffic forecasting on large digital platforms. Second, we provide standardized prediction benchmarks evaluated under a suite of non-Gaussian loss functions, including $\ell_1$-norm, Huber, quantile, and $\ell_p$-norm losses, demonstrating that standard Gaussian-based estimators degrade substantially on high-volume page categories, while robust alternatives provide consistent gains across all traffic scales. TailedTS is publicly available at https://doi.org/10.5281/zenodo.17070469.
Editorial analysis
A structured set of objections, weighed in public.
Referee Report
Summary. The manuscript introduces TailedTS, a large-scale benchmark dataset from Wikipedia hourly page views in 2024 comprising ~24.69 billion data points across ~3 million unique pages per month in Parquet format. It emphasizes the power-law distribution of traffic (5% of pages account for >70% of views) as a testbed for heavy-tailed, zero-inflated, non-Gaussian time series. The authors propose a periodicity quantification framework based on sparse autoregression with sparsity and non-negativity constraints, reporting that frequently-viewed pages exhibit significantly weaker periodic structure than less-viewed counterparts. They also supply standardized forecasting benchmarks under non-Gaussian losses (ℓ1, Huber, quantile, ℓp) showing that robust estimators outperform Gaussian-based ones on high-volume categories.
Significance. The public release of this billion-scale, heavy-tailed dataset is a clear strength and fills a gap relative to M4/M5/UCI benchmarks. If the periodicity and forecasting results hold after robustness checks, they carry direct implications for traffic prediction and resource allocation on platforms with power-law usage patterns. The work applies existing sparse autoregression rather than deriving new theory, so its primary value lies in the empirical benchmark and the scale of the released data.
major comments (1)
- [Periodicity quantification framework] The periodicity claim (abstract and the section introducing the sparse autoregression framework) rests on outputs from the constrained model without reported normalization for the orders-of-magnitude variance differences between high- and low-traffic series. High-traffic pages obey the reported power-law and therefore exhibit substantially higher variance and different zero-inflation; the measured difference in periodic strength could arise from interaction between the sparsity/non-negativity constraints and signal amplitude rather than genuine structural disparity. Explicit checks against scale-invariant alternatives (e.g., per-series z-scoring, log-transform, or direct comparison of autocorrelation peaks/Fourier power ratios) are needed to substantiate the claim.
minor comments (2)
- [Abstract] The abstract states that the dataset enables 'standardized prediction benchmarks' but does not list the precise train/validation/test splits, forecast horizons, or cross-validation scheme used for the reported loss comparisons.
- [Dataset construction] Provide the exact data filtering rules, handling of missing hours, and implementation details of the sparsity constraint (e.g., regularization parameter selection) so that the benchmark can be reproduced and extended.
Simulated Author's Rebuttal
We thank the referee for the constructive feedback on our manuscript introducing TailedTS. We address the single major comment point by point below and will revise the manuscript to incorporate additional robustness checks as suggested.
read point-by-point responses
-
Referee: The periodicity claim (abstract and the section introducing the sparse autoregression framework) rests on outputs from the constrained model without reported normalization for the orders-of-magnitude variance differences between high- and low-traffic series. High-traffic pages obey the reported power-law and therefore exhibit substantially higher variance and different zero-inflation; the measured difference in periodic strength could arise from interaction between the sparsity/non-negativity constraints and signal amplitude rather than genuine structural disparity. Explicit checks against scale-invariant alternatives (e.g., per-series z-scoring, log-transform, or direct comparison of autocorrelation peaks/Fourier power ratios) are needed to substantiate the claim.
Authors: We appreciate the referee's identification of this potential scale-related confound. The sparse autoregression model with sparsity and non-negativity constraints was applied independently to each series to quantify periodic components in a manner suited to the zero-inflated count data. Nevertheless, we agree that the lack of explicit normalization leaves open the possibility that variance differences driven by the power-law distribution could influence the measured periodic strength. In the revised manuscript we will add the suggested scale-invariant checks: (i) per-series z-scoring prior to model fitting, (ii) log-transform variants where feasible, and (iii) direct comparisons of autocorrelation peaks and Fourier power ratios across traffic-volume strata. These results will be presented alongside the original constrained-model outputs to confirm that the weaker periodic structure in high-traffic pages is not an artifact of amplitude differences. revision: yes
Circularity Check
No circularity: external dataset and applied framework yield independent empirical finding
full rationale
The paper releases an external Wikipedia 2024 traffic dataset and applies a periodicity quantification framework (sparse autoregression with sparsity/non-negativity constraints) to it. The central claim—that high-traffic pages show weaker periodicity—is an output of that application on the new data, not a quantity defined by or fitted to the same model. No equations reduce a prediction to its own inputs by construction, no self-citation chain bears the load of the result, and the dataset itself is independent of the analysis. This is a standard data-release plus empirical application pattern with no detectable circularity.
Axiom & Free-Parameter Ledger
axioms (2)
- domain assumption Wikipedia hourly page views constitute a representative heavy-tailed, zero-inflated time series domain absent from prior benchmarks.
- domain assumption Sparse autoregression with sparsity and non-negativity constraints provides a valid measure of periodic structure.
Lean theorems connected to this paper
-
IndisputableMonolith/Cost/FunctionalEquation.leanwashburn_uniqueness_aczel unclear?
unclearRelation between the paper passage and the cited Recognition theorem.
periodicity quantification framework based on sparse autoregression with sparsity and non-negativity constraints... frequently-viewed pages exhibit significantly weaker periodic structure
-
IndisputableMonolith/Foundation/DimensionForcing.leanreality_from_one_distinction unclear?
unclearRelation between the paper passage and the cited Recognition theorem.
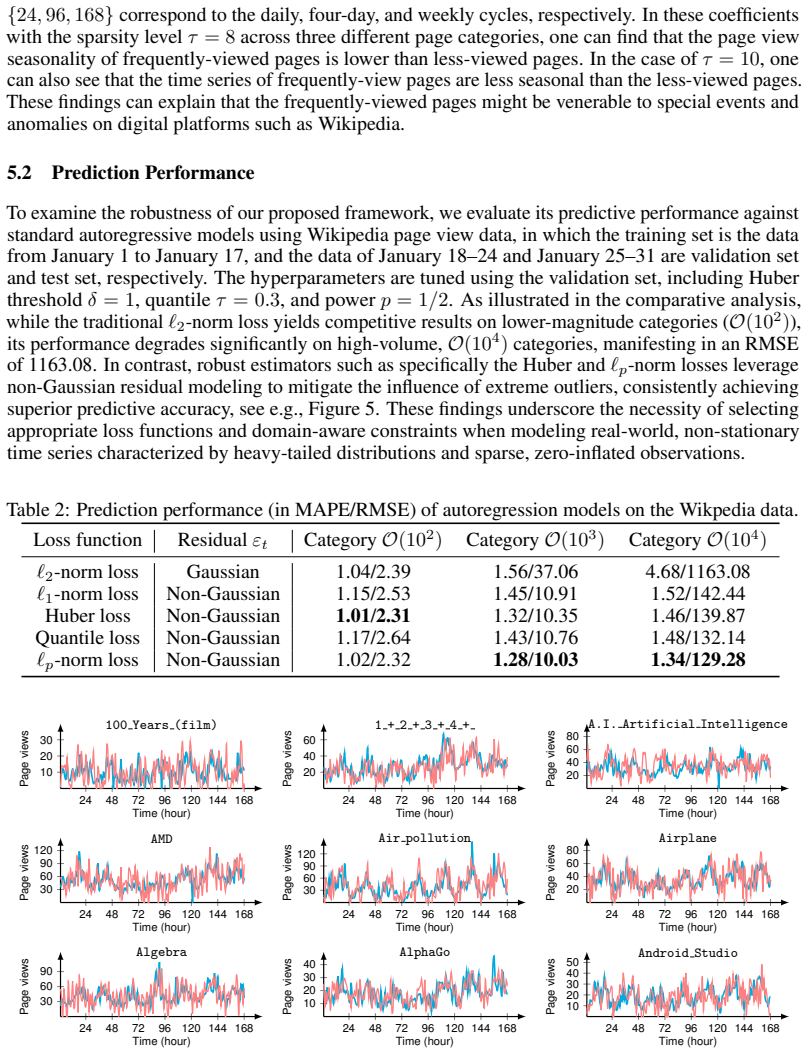
sparsity levels as τ=8,10 and the order as d=168 (i.e., weekly cycle)... indices {24,48,168} correspond to the daily, bi-daily, and weekly cycles
What do these tags mean?
- matches
- The paper's claim is directly supported by a theorem in the formal canon.
- supports
- The theorem supports part of the paper's argument, but the paper may add assumptions or extra steps.
- extends
- The paper goes beyond the formal theorem; the theorem is a base layer rather than the whole result.
- uses
- The paper appears to rely on the theorem as machinery.
- contradicts
- The paper's claim conflicts with a theorem or certificate in the canon.
- unclear
- Pith found a possible connection, but the passage is too broad, indirect, or ambiguous to say the theorem truly supports the claim.
Reference graph
Works this paper leans on
-
[1]
Cambridge University Press, 2022
Jayakrishnan Nair, Adam Wierman, and Bert Zwart.The fundamentals of heavy tails: Properties, emergence, and estimation, volume 53. Cambridge University Press, 2022
work page 2022
-
[2]
Weak Signals and Heavy Tails: Learning Theory meets Extreme Value Analysis
Stephan Clémençon and Anne Sabourin. Weak signals and heavy tails: Machine-learning meets extreme value theory.arXiv preprint arXiv:2504.06984, 2025
work page internal anchor Pith review Pith/arXiv arXiv 2025
-
[3]
The heavy-tail phenomenon in sgd
Mert Gurbuzbalaban, Umut Simsekli, and Lingjiong Zhu. The heavy-tail phenomenon in sgd. InInternational Conference on Machine Learning, pages 3964–3975. PMLR, 2021
work page 2021
-
[4]
Abhishek Roy, Krishnakumar Balasubramanian, and Murat A Erdogdu. On empirical risk minimization with dependent and heavy-tailed data.Advances in Neural Information Processing Systems, 34:8913–8926, 2021
work page 2021
-
[5]
Spyros Makridakis, Evangelos Spiliotis, and Vassilios Assimakopoulos. The m4 competition: 100,000 time series and 61 forecasting methods.International Journal of Forecasting, 36(1):54– 74, 2020
work page 2020
-
[6]
Spyros Makridakis, Evangelos Spiliotis, and Vassilios Assimakopoulos. The m5 competi- tion: Background, organization, and implementation.International Journal of Forecasting, 38(4):1325–1336, 2022
work page 2022
-
[7]
ElectricityLoadDiagrams20112014
Artur Trindade. ElectricityLoadDiagrams20112014. UCI Machine Learning Repository, 2015. DOI: https://doi.org/10.24432/C58C86
-
[8]
Modeling long-and short-term temporal patterns with deep neural networks
Guokun Lai, Wei-Cheng Chang, Yiming Yang, and Hanxiao Liu. Modeling long-and short-term temporal patterns with deep neural networks. InThe 41st international ACM SIGIR conference on research & development in information retrieval, pages 95–104, 2018
work page 2018
-
[9]
Kdd cup dataset (without missing values), June 2020
Rakshitha Godahewa, Christoph Bergmeir, Geoff Webb, Rob Hyndman, and Pablo Montero- Manso. Kdd cup dataset (without missing values), June 2020
work page 2020
-
[10]
Rakshitha Godahewa, Christoph Bergmeir, Geoff Webb, Pablo Montero-Manso, and Rob Hyndman. Weather dataset, August 2020
work page 2020
-
[11]
Individual household electric power consumption data set
Georges Hebrail and Alice Berard. Individual household electric power consumption data set. UCI Machine Learning Repository, 2012
work page 2012
-
[12]
Springer science & business media, 2009
Peter J Brockwell and Richard A Davis.Time series: theory and methods. Springer science & business media, 2009
work page 2009
-
[13]
George EP Box, Gwilym M Jenkins, Gregory C Reinsel, and Greta M Ljung.Time series analysis: forecasting and control. John Wiley & Sons, 2015
work page 2015
-
[14]
Long short-term memory.Neural computation, 9(8):1735–1780, 1997
Sepp Hochreiter and Jürgen Schmidhuber. Long short-term memory.Neural computation, 9(8):1735–1780, 1997
work page 1997
-
[15]
Empirical Evaluation of Gated Recurrent Neural Networks on Sequence Modeling
Junyoung Chung, Caglar Gulcehre, KyungHyun Cho, and Yoshua Bengio. Empirical evaluation of gated recurrent neural networks on sequence modeling.arXiv preprint arXiv:1412.3555, 2014
work page internal anchor Pith review Pith/arXiv arXiv 2014
-
[16]
Learning phrase representations using rnn encoder– decoder for statistical machine translation
Kyunghyun Cho, Bart Van Merriënboer, Ça˘glar Gulçehre, Dzmitry Bahdanau, Fethi Bougares, Holger Schwenk, and Yoshua Bengio. Learning phrase representations using rnn encoder– decoder for statistical machine translation. InProceedings of the 2014 conference on empirical methods in natural language processing (EMNLP), pages 1724–1734, 2014
work page 2014
-
[17]
Temporal convolutional networks for action segmentation and detection
Colin Lea, Michael D Flynn, Rene Vidal, Austin Reiter, and Gregory D Hager. Temporal convolutional networks for action segmentation and detection. Inproceedings of the IEEE Conference on Computer Vision and Pattern Recognition, pages 156–165, 2017. 10
work page 2017
-
[18]
An Empirical Evaluation of Generic Convolutional and Recurrent Networks for Sequence Modeling
Shaojie Bai, J Zico Kolter, and Vladlen Koltun. An empirical evaluation of generic convolutional and recurrent networks for sequence modeling.arXiv preprint arXiv:1803.01271, 2018
work page internal anchor Pith review Pith/arXiv arXiv 2018
-
[19]
Shiyang Li, Xiaoyong Jin, Yao Xuan, Xiyou Zhou, Wenhu Chen, Yu-Xiang Wang, and Xifeng Yan. Enhancing the locality and breaking the memory bottleneck of transformer on time series forecasting.Advances in neural information processing systems, 32, 2019
work page 2019
-
[20]
Informer: Beyond efficient transformer for long sequence time-series forecasting
Haoyi Zhou, Shanghang Zhang, Jieqi Peng, Shuai Zhang, Jianxin Li, Hui Xiong, and Wancai Zhang. Informer: Beyond efficient transformer for long sequence time-series forecasting. In Proceedings of the AAAI conference on artificial intelligence, volume 35, pages 11106–11115, 2021
work page 2021
-
[21]
Haixu Wu, Jiehui Xu, Jianmin Wang, and Mingsheng Long. Autoformer: Decomposition trans- formers with auto-correlation for long-term series forecasting.Advances in neural information processing systems, 34:22419–22430, 2021
work page 2021
-
[22]
Time-LLM: Time Series Forecasting by Reprogramming Large Language Models
Ming Jin, Shiyu Wang, Lintao Ma, Zhixuan Chu, James Y Zhang, Xiaoming Shi, Pin-Yu Chen, Yuxuan Liang, Yuan-Fang Li, Shirui Pan, et al. Time-llm: Time series forecasting by reprogramming large language models.arXiv preprint arXiv:2310.01728, 2023
work page internal anchor Pith review Pith/arXiv arXiv 2023
-
[23]
Nate Gruver, Marc Finzi, Shikai Qiu, and Andrew G Wilson. Large language models are zero-shot time series forecasters.Advances in neural information processing systems, 36:19622– 19635, 2023
work page 2023
-
[24]
Yong Liu, Guo Qin, Xiangdong Huang, Jianmin Wang, and Mingsheng Long. Autotimes: Au- toregressive time series forecasters via large language models.Advances in Neural Information Processing Systems, 37:122154–122184, 2024
work page 2024
-
[25]
Gennady Samorodnitsky and Murad S Taqqu.Stable non-Gaussian random processes: stochas- tic models with infinite variance, volume 1. CRC press, 1994
work page 1994
-
[26]
Richard A Davis and William TM Dunsmuir. Least absolute deviation estimation for regression with arma errors.Journal of Theoretical Probability, 10(2):481–497, 1997
work page 1997
-
[27]
Xingfa Zhang, Rongmao Zhang, Yuan Li, and Shiqing Ling. Lade-based inferences for autore- gressive models with heavy-tailed g-garch (1, 1) noise.Journal of Econometrics, 227(1):228– 240, 2022
work page 2022
-
[28]
F Jay Breidt, Richard A Davis, and A Alexandre Trindade. Least absolute deviation estimation for all-pass time series models.Annals of statistics, pages 919–946, 2001
work page 2001
-
[29]
Shiqing Ling. Self-weighted least absolute deviation estimation for infinite variance autore- gressive models.Journal of the Royal Statistical Society Series B: Statistical Methodology, 67(3):381–393, 2005
work page 2005
-
[30]
Youshen Xia and Mohamed S Kamel. A generalized least absolute deviation method for parame- ter estimation of autoregressive signals.IEEE Transactions on Neural Networks, 19(1):107–118, 2008
work page 2008
-
[31]
Rongning Wu and Richard A Davis. Least absolute deviation estimation for general autore- gressive moving average time-series models.Journal of Time Series Analysis, 31(2):98–112, 2010
work page 2010
-
[32]
Zhe Liu and Ying Yang. Least absolute deviations estimation for uncertain regression with imprecise observations.Fuzzy Optimization and Decision Making, 19(1):33–52, 2020
work page 2020
-
[33]
Robust estimation of a location parameter
Peter J Huber. Robust estimation of a location parameter. InBreakthroughs in statistics: Methodology and distribution, pages 492–518. Springer, 1992
work page 1992
-
[34]
Ricardo A Maronna, R Douglas Martin, Victor J Yohai, and Matías Salibián-Barrera.Robust statistics: theory and methods (with R). John Wiley & Sons, 2019
work page 2019
-
[35]
Adaptive huber regression.Journal of the American Statistical Association, 115(529):254–265, 2020
Qiang Sun, Wen-Xin Zhou, and Jianqing Fan. Adaptive huber regression.Journal of the American Statistical Association, 115(529):254–265, 2020. 11
work page 2020
-
[36]
Jianqing Fan, Yongyi Guo, and Bai Jiang. Adaptive huber regression on markov-dependent data.Stochastic processes and their applications, 150:802–818, 2022
work page 2022
-
[37]
Quantile regression.Journal of economic perspectives, 15(4):143–156, 2001
Roger Koenker and Kevin F Hallock. Quantile regression.Journal of economic perspectives, 15(4):143–156, 2001
work page 2001
-
[38]
Quantile autoregression.Journal of the American statistical association, 101(475):980–990, 2006
Roger Koenker and Zhijie Xiao. Quantile autoregression.Journal of the American statistical association, 101(475):980–990, 2006
work page 2006
-
[39]
Sawsan Qassim Hadi and Omar Abdulmohsin Ali. Spatial quantile autoregressive model: A review.Journal of Economics and Administrative Sciences, 31(146):141–155, 2025
work page 2025
-
[40]
Jean-Paul Chavas and Jian Li. A quantile autoregression analysis of price volatility in agricultural markets.Agricultural Economics, 51(2):273–289, 2020
work page 2020
-
[41]
Jorge Castillo-Mateo, Jesús Asín, Ana C Cebrián, Alan E Gelfand, and Jesús Abaurrea. Spatial quantile autoregression for season within year daily maximum temperature data.The Annals of Applied Statistics, 17(3):2305–2325, 2023
work page 2023
-
[42]
Robust regression computation using iteratively reweighted least squares
Dianne P O’Leary. Robust regression computation using iteratively reweighted least squares. SIAM Journal on Matrix Analysis and Applications, 11(3):466–480, 1990
work page 1990
-
[43]
Ingrid Daubechies, Ronald DeV ore, Massimo Fornasier, and C Sinan Güntürk. Iteratively reweighted least squares minimization for sparse recovery.Communications on Pure and Applied Mathematics: A Journal Issued by the Courant Institute of Mathematical Sciences, 63(1):1–38, 2010
work page 2010
-
[44]
Liangzu Peng, Christian Kümmerle, and René Vidal. Global linear and local superlinear convergence of IRLS for non-smooth robust regression.Advances in neural information processing systems, 35:28972–28987, 2022
work page 2022
-
[45]
Ying Sun, Prabhu Babu, and Daniel P Palomar. Majorization-minimization algorithms in signal processing, communications, and machine learning.IEEE Transactions on Signal Processing, 65(3):794–816, 2016
work page 2016
-
[46]
Xinyu Chen, Vassilis Digalakis Jr, Lijun Ding, Dingyi Zhuang, and Jinhua Zhao. Interpretable time series autoregression for periodicity quantification.arXiv preprint arXiv:2506.22895, 2025
-
[47]
Ingrid Daubechies, Michel Defrise, and Christine De Mol. An iterative thresholding algorithm for linear inverse problems with a sparsity constraint.Communications on Pure and Applied Mathematics: A Journal Issued by the Courant Institute of Mathematical Sciences, 57(11):1413– 1457, 2004
work page 2004
-
[48]
Amir Beck and Marc Teboulle. A fast iterative shrinkage-thresholding algorithm for linear inverse problems.SIAM Journal on Imaging Sciences, 2(1):183–202, 2009
work page 2009
-
[49]
Cambridge university press, 2004
Stephen Boyd and Lieven Vandenberghe.Convex optimization. Cambridge university press, 2004
work page 2004
-
[50]
" " 10Download p ag ev ie ws files 11
IBM ILOG CPLEX. Cplex optimization studio cplex user’s manual, version 12 release 6.https: //www.engineering.iastate.edu/~jdm/ee458/CPLEX-UsersManual2015.pdf, 2015. 12 Supplementary Material for TailedTS: Benchmark Dataset for Heavy-Tailed Time Series Prediction and Periodicity Quantification A Benchmark Datasets Figure 6 shows the histogram plots of 8 be...
work page 2015
discussion (0)
Sign in with ORCID, Apple, or X to comment. Anyone can read and Pith papers without signing in.