A Hycean Interpretation of K2-18b Supported by Photochemical Atmospheric Compositional
Pith reviewed 2026-05-20 01:14 UTC · model grok-4.3
The pith
Hycean atmospheres with a 1-bar H2 envelope, percent-level CH4 and CO, and CO2 at 10^{-3} to 10^{-2} reproduce the JWST spectra of K2-18b without DMS.
A machine-rendered reading of the paper's core claim, the machinery that carries it, and where it could break.
Core claim
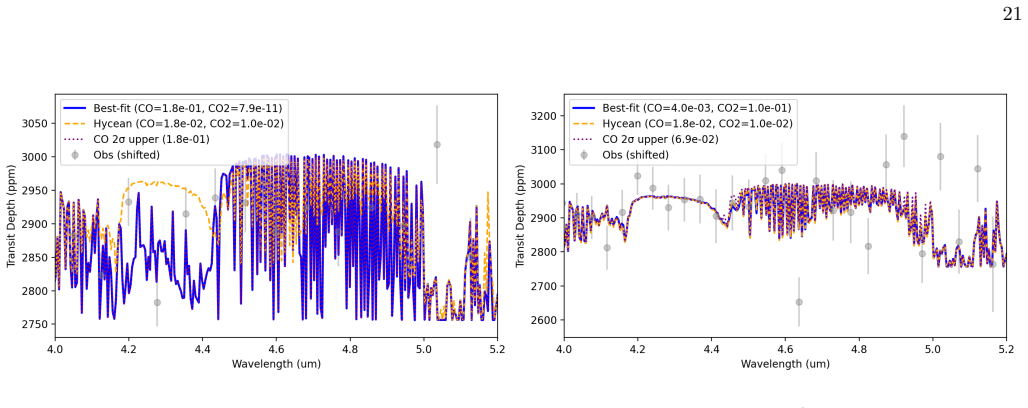
Hycean models with a 1 bar H2 envelope, percent-level CH4 and CO, and CO2 buffered at ~10^{-3}-10^{-2} reproduce the NIRISS and NIRSpec spectra from 0.8 to 5.2 μm without invoking DMS or other additional species. Photochemical simulations show that H2-CH4-H2O networks generically drive CO to mixing ratios of order 1-2 %. Mass-balance arguments imply that a ~1 bar H2 envelope with percent-level CH4 requires interior replenishment on gigayear timescales, and the resulting vertical gradients naturally generate flat, CH4-dominated plateaux in transmission.
What carries the argument
One-dimensional photochemical modeling of H2-CH4-H2O networks coupled to radiative-convective equilibrium calculations that avoid runaway greenhouse states, then used for forward modeling of transmission spectra.
If this is right
- Liquid oceans remain stable over wide ranges of temperature and pressure in these setups.
- H2-CH4-H2O photochemical networks produce CO at 1-2% mixing ratios as a generic outcome.
- Interior replenishment of CH4 on gigayear timescales is required to maintain the envelope.
- Vertical abundance gradients create flat CH4-dominated plateaux in the transmission spectrum.
- Existing CO and CO2 constraints alone cannot yet exclude Hycean interpretations.
Where Pith is reading between the lines
- Tighter measurements of the 4-5 μm CO feature in future JWST cycles could directly test the predicted 1-2% abundance.
- The same modeling approach might apply to other sub-Neptunes showing similar flat transmission spectra.
- Adding hazes or trace condensables in follow-up calculations would show how robust the current spectral match remains.
- If correct, the result broadens the pool of targets where liquid-water oceans could be searched for using transmission data.
Load-bearing premise
The atmosphere is a pure H2-CH4-H2O mixture over a liquid ocean with no hazes or other condensables, and the 1-bar H2 envelope stays stable against escape or mixing with deeper layers.
What would settle it
High-precision spectra in the 4-5 μm region that show CO abundances well below 1% or require strong additional absorbers inconsistent with the predicted CH4-CO-CO2 balance would falsify the Hycean fit.
Figures


read the original abstract
The nature of the sub-Neptune K2-18b is debated between Hycean and mini-Neptune interpretations. We test whether self-consistent Hycean atmospheres are compatible with current JWST transmission spectra by combining one-dimensional photochemical modelling, radiative--convective equilibrium calculations, and forward modelling of transmission spectra. We assume H2-CH4-H2O atmospheres over a liquid ocean, compute altitude-dependent abundances with a 1D photochemical model, and couple them to P-T profiles that avoid runaway greenhouse states. Using the CH4-dominated 2.8-4.0 $\mu$m band, we constrain wavelength-independent offsets between NIRISS SOSS and NIRSpec G395H for multiple reductions, and then scan grids of CO and CO2 scaling factors, weighted by the CH4-band offset posteriors, to evaluate oxidised-carbon abundances consistent with the 4-5 $\mu$m region. Radiative--convective calculations further map pressures and albedos that yield non-runaway climates. Over a wide range of temperatures and pressures, liquid oceans can exist, and Hycean models with a 1 bar H2 envelope, percent-level CH4 and CO, and CO2 buffered at $\sim 10^{-3}$-$10^{-2}$ reproduce the NIRISS and NIRSpec spectra from 0.8 to 5.2 $\mu$m without invoking DMS or other additional species. Our photochemical simulations show that H2-CH4-H2O networks generically drive CO to mixing ratios of order 1-2 %. Mass-balance arguments imply that a $\sim$1 bar H2 envelope with percent-level CH4 requires interior replenishment on gigayear timescales, and the resulting vertical gradients naturally generate flat, CH4-dominated plateaux in transmission. While mini-Neptune scenarios remain viable, our results show that Hycean configurations are likewise consistent with the data, and current CO and CO2 constraints alone are not yet sufficient to rule out Hycean interpretations of K2-18b.
Editorial analysis
A structured set of objections, weighed in public.
Referee Report
Summary. The manuscript claims that self-consistent Hycean atmospheres (H2-CH4-H2O over a liquid ocean) with a 1 bar H2 envelope, percent-level CH4 and CO, and CO2 buffered at ~10^{-3}-10^{-2} reproduce the JWST NIRISS SOSS and NIRSpec G395H transmission spectra of K2-18b from 0.8 to 5.2 μm. This is shown via 1D photochemical modeling yielding ~1-2% CO, radiative-convective calculations for non-runaway P-T profiles, forward modeling of spectra, and use of the CH4 2.8-4.0 μm band to constrain wavelength-independent offsets between instruments before scanning CO/CO2 grids. The authors conclude that current CO/CO2 constraints do not rule out Hycean interpretations and that interior replenishment on Gyr timescales is implied by mass balance.
Significance. If the central claims hold, the work is significant for demonstrating that Hycean configurations are compatible with existing JWST data on K2-18b, thereby keeping both Hycean and mini-Neptune scenarios viable. The self-consistent coupling of photochemical networks to radiative-convective equilibrium and transmission spectra, together with the mass-balance arguments for envelope maintenance, provides a useful framework and falsifiable predictions for future observations. The explicit avoidance of runaway greenhouse states and the generic production of CO in H2-CH4-H2O networks are particular strengths.
major comments (3)
- [Abstract and §4] Abstract and the offset/grid procedure: The wavelength-independent offset between NIRISS SOSS and NIRSpec G395H is derived from the CH4-dominated 2.8-4.0 μm band and then used to weight the CO/CO2 scaling-factor grid; this data-driven adjustment means the claim that the models 'reproduce' the spectra is not fully independent of the target data, introducing a circularity risk that affects the evaluation of oxidized-carbon abundances in the 4-5 μm region.
- [Results] Results section: No quantitative goodness-of-fit metrics (e.g., χ², reduced χ², or posterior probabilities) or error bars on the model spectra are reported, making it impossible to assess objectively how well the Hycean models match the data relative to alternatives or to evaluate sensitivity to the chosen offset posteriors.
- [§3.1 and §6] §3.1 and §6: The assumption of a pure H2-CH4-H2O mixture with no hazes or additional condensables, together with the stability of the 1-bar H2 envelope against escape or mixing, is load-bearing for the flat CH4 plateau and spectral reproduction, yet no explicit test of haze yields from CH4 photochemistry or envelope stability is provided in the coupled radiative-convective + transmission calculations.
minor comments (3)
- [Title] The title appears truncated ('Supported by Photochemical Atmospheric Compositional'); consider completing it for clarity.
- [Throughout] Notation for mixing ratios and pressures should be made fully consistent (e.g., always using scientific notation such as 10^{-3} rather than mixing decimal and exponential forms).
- [Figures] Ensure all figures display data error bars, model uncertainty ranges, and explicit labels distinguishing the various CO/CO2 grid members.
Simulated Author's Rebuttal
We thank the referee for their positive assessment of the work's significance and for the constructive major comments. We respond to each point below, indicating planned revisions where appropriate.
read point-by-point responses
-
Referee: [Abstract and §4] The wavelength-independent offset between NIRISS SOSS and NIRSpec G395H is derived from the CH4-dominated 2.8-4.0 μm band and then used to weight the CO/CO2 scaling-factor grid; this data-driven adjustment means the claim that the models 'reproduce' the spectra is not fully independent of the target data, introducing a circularity risk that affects the evaluation of oxidized-carbon abundances in the 4-5 μm region.
Authors: We thank the referee for noting this procedural detail. The offset is determined solely from the 2.8-4.0 μm interval where CH4 absorption dominates and CO/CO2 features contribute negligibly according to our forward models. This wavelength-independent shift aligns the two instrument reductions before the separate CO/CO2 grid evaluation is performed in the 4-5 μm region. Because the CH4 band is insensitive to the oxidized-carbon scaling factors, the procedure does not directly tune those abundances to the data. We will revise the abstract and §4 to state this spectral separation explicitly and add a short sensitivity test confirming that CO/CO2 conclusions are unchanged across the offset posterior range. revision: partial
-
Referee: [Results] No quantitative goodness-of-fit metrics (e.g., χ², reduced χ², or posterior probabilities) or error bars on the model spectra are reported, making it impossible to assess objectively how well the Hycean models match the data relative to alternatives or to evaluate sensitivity to the chosen offset posteriors.
Authors: We agree that quantitative metrics would strengthen the presentation. In the revised manuscript we will report χ² and reduced χ² values for the Hycean models against the observed spectra, together with uncertainty ranges on the model spectra propagated from the offset posteriors and parameter grids. This will permit direct comparison with alternative scenarios and clearer assessment of fit quality. revision: yes
-
Referee: [§3.1 and §6] The assumption of a pure H2-CH4-H2O mixture with no hazes or additional condensables, together with the stability of the 1-bar H2 envelope against escape or mixing, is load-bearing for the flat CH4 plateau and spectral reproduction, yet no explicit test of haze yields from CH4 photochemistry or envelope stability is provided in the coupled radiative-convective + transmission calculations.
Authors: We acknowledge that the haze-free and envelope-stability assumptions are central. Our photochemical network yields low higher-hydrocarbon production rates under the explored conditions, consistent with prior H2-rich atmosphere studies, but we did not insert explicit haze opacities into the coupled radiative-convective runs. Envelope stability is supported by the mass-balance arguments but lacks a dedicated escape calculation. We will expand §3.1 and §6 to discuss the photochemical haze yields, cite relevant literature on minimal haze formation, and note the stability assumption with supporting references while identifying a full escape analysis as a limitation for future work. revision: partial
Circularity Check
CH4-band offset fitting from data weights CO/CO2 grid, making full-spectrum reproduction dependent on target data
specific steps
-
fitted input called prediction
[Abstract]
"Using the CH4-dominated 2.8-4.0 μm band, we constrain wavelength-independent offsets between NIRISS SOSS and NIRSpec G395H for multiple reductions, and then scan grids of CO and CO2 scaling factors, weighted by the CH4-band offset posteriors, to evaluate oxidised-carbon abundances consistent with the 4-5 μm region. ... Hycean models with a 1 bar H2 envelope, percent-level CH4 and CO, and CO2 buffered at ∼10^{-3}-10^{-2} reproduce the NIRISS and NIRSpec spectra from 0.8 to 5.2 μm without invoking DMS or other additional species."
Offsets are fitted to the CH4 portion of the target spectra; these posteriors then weight the CO/CO2 grid evaluated on the adjacent 4-5 μm region. The final claim that the models reproduce the full 0.8-5.2 μm spectra is achieved after this data-driven adjustment and scaling rather than as an independent test of the assumed H2-CH4-H2O photochemical network and 1-bar envelope.
full rationale
The paper demonstrates compatibility of Hycean models with JWST spectra via photochemical abundances, radiative-convective P-T profiles, and forward modeling. The key step constrains inter-instrument offsets directly from the CH4 band in the observed data, then uses the resulting posteriors to weight a grid search over CO/CO2 scalings for the 4-5 μm region before claiming overall reproduction. This is a standard fitting procedure for model testing rather than a first-principles derivation or blind prediction, so the reproduction claim is partially data-dependent by construction. No self-citations, definitional loops, or imported uniqueness theorems appear in the provided text; the photochemical network and mass-balance arguments stand as independent content. The result is therefore self-contained against external benchmarks with only moderate circularity from the fitting chain.
Axiom & Free-Parameter Ledger
free parameters (3)
- wavelength-independent offset between NIRISS SOSS and NIRSpec G395H
- CO and CO2 scaling factors
- surface pressure and albedo
axioms (2)
- domain assumption H2-CH4-H2O networks generically drive CO to mixing ratios of order 1-2 %
- domain assumption A ~1 bar H2 envelope with percent-level CH4 requires interior replenishment on gigayear timescales
Reference graph
Works this paper leans on
-
[1]
2019, ApJL, 887, L14, doi: 10.3847/2041-8213/ab59dc
Benneke, B., Wong, I., Piaulet, C., & et al. 2019, ApJL, 887, L14, doi: 10.3847/2041-8213/ab59dc
-
[2]
Chan, W. F., Cooper, G., & Brion, C. E. 1993, Chemical Physics, 170, 123, doi: 10.1016/0301-0104(93)80098-T
-
[3]
Charlson, R. J., Lovelock, J. E., Andreae, M. O., & Warren, S. G. 1987, Nature, 326, 655, doi: 10.1038/326655a0
-
[4]
Chase, M. W. 1998, NIST-JANAF Thermochemical Tables, 4th Edition. https://www.nist.gov/publications/nist- janaf-thermochemical-tables-4th-edition
work page 1998
-
[5]
Dasgupta, R., & Hirschmann, M. M. 2010, Earth and Planetary Science Letters, 298, 1, doi: 10.1016/j.epsl.2010.06.039
-
[6]
Fujisawa, T., Shimada, M., Yoshida, T., & Kuramoto, K. 2026, Chemical reaction network and rate coefficients for Hycean atmosphere modeling of K2-18b, Zenodo, Zenodo, doi: 10.5281/zenodo.20225015
-
[7]
Fulton, B. J., Petigura, E. A., Howard, A. W., et al. 2017, AJ, 154, 109, doi: 10.3847/1538-3881/aa80eb
-
[8]
Gordon, I. E., Rothman, L. S., Hargreaves, R. J., & et al. 2022, JQSRT, 277, doi: 10.1016/j.jqsrt.2021.107949
-
[9]
2021, ApJL, 921, L8, doi: 10.3847/2041-8213/ac1f92
Hu, R., Damiano, M., Scheucher, M., & et al. 2021, ApJL, 921, L8, doi: 10.3847/2041-8213/ac1f92
-
[10]
Innes, H., Tsai, S.-M., & Pierrehumbert, R. T. 2023, ApJ, 953, 168, doi: 10.3847/1538-4357/ace346
-
[11]
K., Christoforidis, A., & Kissel, J
Jessberger, E. K., Christoforidis, A., & Kissel, J. 1988, Nature, 332, 691, doi: 10.1038/332691a0
-
[12]
2024, ApJ, 967, 95, doi: 10.3847/1538-4357/ad3e7e
Kawamura, T., Yoshida, T., & Terada, N. 2024, ApJ, 967, 95, doi: 10.3847/1538-4357/ad3e7e
-
[13]
Khare, B. N., Sagan, C., Arakawa, E. T., et al. 1984, Icarus, 60, 127, doi: 10.1016/0019-1035(84)90142-8
-
[14]
S., Fegley, B., Schaefer, L., & Ford, E
Kite, E. S., Fegley, B., Schaefer, L., & Ford, E. B. 2020, arXiv e-prints. https://arxiv.org/abs/2001.09269
-
[15]
Kochanov, R. V., Gordon, I. E., Rothman, L. S., & et al. 2016, JQSRT, 177, 15, doi: 10.1016/j.jqsrt.2016.03.005
-
[16]
2024, Sci Rep, 14, 2397, doi: 10.1038/s41598-024-52718-9 28
Koyama, S., Koyama, S., Kamada, A., et al. 2024, Sci Rep, 14, 2397, doi: 10.1038/s41598-024-52718-9 28
-
[17]
Lopez, E. D., & Fortney, J. J. 2014, ApJ, 792, 1, doi: 10.1088/0004-637X/792/1/1
-
[18]
Madhusudhan, N., & Nixon, C. M. 2021, MNRAS, 505, 3414, doi: 10.1093/mnras/stab1500
-
[19]
Madhusudhan, N., Piette, A. A. A., & Constantinou, S. 2021, ApJ, 918, 1, doi: 10.3847/1538-4357/abfd9c
-
[20]
2023, ApJL, 956, L13, doi: 10.3847/2041-8213/acf577
Madhusudhan, N., Sarkar, S., Constantinou, S., & et al. 2023, ApJL, 956, L13, doi: 10.3847/2041-8213/acf577
-
[21]
Mlawer, E. J., Turner, D. D., Paine, S. N., & Palchetti, L. 2023, The inclusion of the MT_CKD water vapor continuum model in the HITRAN molecular spectroscopic database, Tech. rep., doi: 10.1016/j.jqsrt.2023.108645
-
[22]
Nakamura, Y., Terada, K., & Tao, C. 2022, J. Geophys. Res. Space Phys., 127, 3, doi: 10.1029/2022JA030312
-
[23]
2023, Earth Planets Space, 75, 140, doi: 10.1186/s40623-023-01881-w
Nakamura, Y., Terada, N., & Koyama, S. 2023, Earth Planets Space, 75, 140, doi: 10.1186/s40623-023-01881-w
-
[24]
Pavlov, A. A., Brown, L. L., & Kasting, J. F. 2001, Journal of Geophysical Research: Planets, 106, 23267, doi: 10.1029/2000JE001448
-
[25]
2000, Journal of Geophysical Research: Planets, 105, 11981, doi: 10.1029/1999JE001134
Freedman, R. 2000, Journal of Geophysical Research: Planets, 105, 11981, doi: 10.1029/1999JE001134
-
[26]
2011, ApJ, 734, L13, doi: 10.1088/2041-8205/734/1/L13
Pierrehumbert, R., & Gaidos, E. 2011, ApJ, 734, L13, doi: 10.1088/2041-8205/734/1/L13
-
[27]
Haywood, R. D. 2018, MNRAS, 480, 5314, doi: 10.1093/mnras/sty2209
-
[28]
Rogers, L. A. 2015, ApJ, 801, 41, doi: 10.1088/0004-637X/801/1/41
-
[29]
A., Bodenheimer, P., Lissauer, J
Rogers, L. A., Bodenheimer, P., Lissauer, J. J., & Seager, S. 2011, ApJ, 738, 59, doi: 10.1088/0004-637X/738/1/59
-
[30]
Schmidt, P. S., MacDonald, R. J., & Tsai, S.-M. 2025, ApJ, 170, 298, doi: 10.3847/1538-3881/ae019a
-
[31]
Shang-Min, T., Lyons, J. R., & Grosheintz, L. 2017, ApJS, 228, 20, doi: 10.3847/1538-4365/228/2/20
-
[32]
2011, Earth and Planetary Science Letters, 308, 417, doi: 10.1016/j.epsl.2011.06.011
Tian, F., Kasting, J., & Zahnle, K. 2011, Earth and Planetary Science Letters, 308, 417, doi: 10.1016/j.epsl.2011.06.011
-
[33]
Trainer, M. G., Pavlov, A. A., DeWitt, H. L., et al. 2006, Proceedings of the National Academy of Sciences, 103, 18035, doi: 10.1073/pnas.0608561103
-
[34]
Tsiaras, A., Waldmann, I. P., Tinetti, G., & et al. 2019, Nature Astronomy, 3, 1086, doi: 10.1038/s41550-019-0878-9
-
[35]
Wogan, N. F., Batalha, N. E., Zahnle, K., & et al. 2024, arXiv e-prints. https://arxiv.org/abs/2401.11082
-
[36]
Yoshida, T., Aoki, S., & Ueno, Y. 2023, Planet. Sci. J., 4, 53, doi: 10.3847/PSJ/acc030
-
[37]
2025, ApJ, 985, 5, doi: 10.3847/1538-4357/adc8a5
Yoshida, T., Arima, K., & Kuroda, T. 2025, ApJ, 985, 5, doi: 10.3847/1538-4357/adc8a5
-
[38]
2024, Astrobiology, 24, 1074, doi: 10.1089/ast.2024.0048
Kuramoto, K. 2024, Astrobiology, 24, 1074, doi: 10.1089/ast.2024.0048
-
[39]
2020, Icarus, 345, 113740, doi: 10.1016/j.icarus.2020.113740
Yoshida, T., & Kuramoto, K. 2020, Icarus, 345, 113740, doi: 10.1016/j.icarus.2020.113740
discussion (0)
Sign in with ORCID, Apple, or X to comment. Anyone can read and Pith papers without signing in.