pith. sign in

arxiv: 2605.20631 · v1 · pith:5VZZCUYUnew · submitted 2026-05-20 · ⚛️ physics.optics · cond-mat.mes-hall· cond-mat.mtrl-sci

Probing Lattice Dynamics in Real-Space and Real-Time

Pith reviewed 2026-05-21 02:58 UTC · model grok-4.3

classification ⚛️ physics.optics cond-mat.mes-hallcond-mat.mtrl-sci
keywords high-harmonic spectroscopycoherent phononsgraphenelattice dynamicsultrafast processesinelastic scatteringphonon chiralitysidebands
0
0 comments X

The pith

Coherent phonon excitation in graphene produces sidebands in high-harmonic spectra separated by the phonon frequency.

A machine-rendered reading of the paper's core claim, the machinery that carries it, and where it could break.

This paper examines how coherent lattice vibrations influence attosecond-scale electronic responses in solids via high-harmonic spectroscopy. It reports that exciting the in-plane phonon mode in graphene generates sidebands in the harmonic spectrum at intervals matching the phonon frequency. The approach also allows characterization of phonon energy, polarization, phase difference, and chirality. In a separate part, inelastic scattering with theoretical modeling is shown to match results from time-resolved diffraction for probing lattice dynamics in real space and time at atomic resolution.

Core claim

Coherent excitation of the in-plane phonon mode in graphene results in sidebands in the harmonic spectrum separated by the frequency of the excited phonon mode. High-harmonic spectroscopy can characterize the energy, polarization, phase difference, and chirality of phonon modes. Inelastic scattering techniques combined with theoretical analysis produce results comparable to those from time-resolved diffraction and imaging measurements in pump-probe setups, with excellent agreement to a time-resolved diffuse x-ray scattering experiment.

What carries the argument

High-harmonic spectroscopy (HHS) under coherent phonon modulation of the electronic response, which generates observable sidebands in the harmonic spectrum.

If this is right

  • Phonon-driven processes such as heat transfer and phase transitions can be studied with sub-cycle temporal resolution.
  • Multiple phonon properties including chirality become accessible through analysis of harmonic sidebands.
  • Inelastic scattering provides an alternative method to time-resolved diffraction for atomic-scale lattice dynamics.
  • The technique yields results consistent with pump-probe x-ray scattering experiments.

Where Pith is reading between the lines

These are editorial extensions of the paper, not claims the author makes directly.

  • The method could be extended to track displacive phase transitions driven by specific phonon modes in other materials.
  • Applying HHS to additional two-dimensional systems might clarify links between lattice dynamics and thermal conductivity.
  • A direct comparison with time-resolved electron diffraction would test the generality of the inelastic scattering approach.

Load-bearing premise

The observed sidebands arise solely from coherent phonon modulation of the electronic response without significant contributions from other ultrafast processes or experimental artifacts.

What would settle it

Sidebands that remain when coherent phonon excitation is suppressed or when the inelastic scattering model no longer reproduces time-resolved diffraction data.

Figures

Figures reproduced from arXiv: 2605.20631 by Navdeep Rana.

Figure 1.1
Figure 1.1. Figure 1.1: (a) A representative high-harmonic spectrum from gaseous medium. (b) The three-step recollision mechanism of HHG from gases in real-space, adapted from Ref. (Thomson et al., 2013). emitted. HHG from gases was first observed by Ferray et al. using intense laser pulse (Ferray et al., 1988). The HHG spectrum shown in [PITH_FULL_IMAGE:figures/full_fig_p027_1_1.png] view at source ↗
Figure 1.2
Figure 1.2. Figure 1.2: The underlying mechanism of HHG in solids. The energy band structure of monolayer graphene along high-symmetry directions within two band picture in which the conduction (valence) band is shown by blue (orange) in momen￾tum space. et al., 2016; You et al., 2017) to two-dimensional semiconductors (Liu et al., 2017), gapless semimetals (Yoshikawa et al., 2017), metasurfaces (Liu et al., 2018), and nanostru… view at source ↗
Figure 2.1
Figure 2.1. Figure 2.1: Hexagonal honeycomb lattice structure of graphene. (a) Real-space structure of graphene with a1 and a2 as primitive lattice vectors. The A and B represent two non-equivalent atoms of graphene arranged in the honeycomb lattice. (b) Brillouin zone in the momentum space with Γ, M, K, and K ′ as the high symmetry points. Each of the carbon atoms in graphene has a total of four valence electrons, two of which… view at source ↗
Figure 2.2
Figure 2.2. Figure 2.2: Energy dispersion in graphene obtained by simulating the tight-binding Hamiltonian in Eq. (2.1.4). (a) Valence and conduction bands along the high-symmetry points in one dimension, and (b) energy band structure in three dimensional. the s, px, and py orbitals of the carbon atoms, are less important for the electronic properties as they are “more” localized. Therefore, the tight-binding model of graphene … view at source ↗
Figure 2.3
Figure 2.3. Figure 2.3: High-harmonic spectra of monolayer graphene. (a) Red (blue) color corre￾sponds to the polarization of emitted radiation parallel (perpendicular) to the polarization of the harmonic generating probe pulse. (b) Intra- and in￾terband resolved high-harmonics. Here, FT stands for the Fourier transform. Let us briefly discuss the advantages of using the Houston basis state to describe laser-driven electron dyn… view at source ↗
Figure 2.4
Figure 2.4. Figure 2.4: (a) Phonon dispersion along high-symmetry points of graphene calculated from the dynamical matrix using fitted constants: αs = 445 N/m and αϕ = 102 N/m. (b) Phonon dispersion of graphene obtained using ab initio simulation (Marquina et al., 2013). A and B types of carbon atoms. The dynamical matrix within nearest-neighbor interaction is defined as D(k) =         DAA xx DAA xy DAB xx DAB xy DAA yx… view at source ↗
Figure 2.5
Figure 2.5. Figure 2.5: Sketches of atomic vibrations associated with the degenerate E2g phonon modes in real-space for (a),(b) acoustic and (c),(d) optical Phonon modes at the Γ point. Here, modes are labeled as (a) in-plane longitudinal acoustic (iLA), (b) in-plane transverse acoustic (iTA), (c) in-plane longitudinal optical (iLO), and (d) in-plane transverse optical (iTO) phonon mode, respectively. We will limit our discussi… view at source ↗
Figure 3.1
Figure 3.1. Figure 3.1: (a) Change in the electronic band structure of the bilayer graphene for dif￾ferent amplitudes of the in-plane coherent E1u phonon mode [adapted from supplementary information in Gierz et al. (2015)]. (b) Similar changes in the band structure of the monolayer graphene for different amplitudes of the in-plane coherent E2g phonon mode. Results for the monolayer graphene are obtained from our theoretical mod… view at source ↗
Figure 3.2
Figure 3.2. Figure 3.2: High-harmonic spectra of monolayer graphene with and without coherent lattice dynamics. (a) and (c) High-harmonic spectra corresponding to the coherent iLO phonon mode and the probe harmonic pulse is polarized along Γ − K and Γ − M directions, respectively. (b) and (d) Same as (a) and (c) except iTO phonon mode is coherently excited. In all the cases, sidebands corresponding to the first harmonic are mar… view at source ↗
Figure 3.3
Figure 3.3. Figure 3.3: Time-frequency representation of the high-harmonic generation. Time￾frequency map of the current corresponds to (a) graphene without phonon excitation, (b) parallel (X) and (c) perpendicular (Y) components in graphene with the iLO coherent phonon mode. (d) Time-frequency map of the current in graphene with the iTO coherent phonon mode. The electric field of the probe pulse is shown by a white curve, whic… view at source ↗
Figure 3.4
Figure 3.4. Figure 3.4: High-harmonic spectra of monolayer deformed graphene. (a) and (c) When the atoms in graphene are maximally displaced, from their equilibrium posi￾tion, along iLO phonon mode. (b) and (d) Similar to (a) and (b) but atoms are displaced along iTO phonon mode. The harmonic spectrum of undeformed graphene is shown in the grey-shaded area for reference. The unit cell of the deformed graphene lattice and the po… view at source ↗
Figure 3.5
Figure 3.5. Figure 3.5: Schematic representations of the dynamical symmetries of the Floquet Hamil￾tonian (a) D1 = σˆx · τˆ2 (b) D2 = σˆx. The arrows show the displacements of the atom for a particular phonon mode. the Raman tensor D1Rm(t) = Rm(t) reduces to e i(±mωpht)   Es,mx Es,my   = e i[±m(ωpht+π)]   Es,mx −Es,my   . (3.1.4) The selection rule for the mth-order sideband is as follows: when m is odd (even), the pola… view at source ↗
Figure 3.6
Figure 3.6. Figure 3.6: Sensitivity of the high-harmonic spectra with respect to different amplitudes of the lattice vibrations. The spectra correspond to graphene with the coher￾ent iLO phonon mode. The parameters of the probe laser pulse are same as in [PITH_FULL_IMAGE:figures/full_fig_p069_3_6.png] view at source ↗
Figure 3.7
Figure 3.7. Figure 3.7: Effect of the anharmonicity in the high-harmonic spectroscopy of the coherent lattice dynamics in graphene. High-harmonic spectra corresponding to the coherent iLO phonon mode with the maximum amplitude equal to (a) 0.03, and (c) 0.05 of the lattice constant. (b) and (d) are the same as (a) and (c) except iTO phonon mode is coherently excited. The blue (red) color corresponds to the lattice dynamics with… view at source ↗
Figure 3.8
Figure 3.8. Figure 3.8: High-harmonic spectra corresponding to graphene with the coherent iLO phonon mode coupled with α times iTO phonon mode strength. The spectra shown in (a), (b), and (c) correspond to α = 0.1, 0.5, and 1.0, respectively. The red (blue) color corresponds to the polarization of emitted radiation par￾allel (perpendicular) to the polarization of the harmonic generating probe pulse. The probe harmonic pulse is … view at source ↗
Figure 3.9
Figure 3.9. Figure 3.9: Effect of the carbon isotope on high-harmonic spectroscopy of the coherent lattice dynamics corresponding to the in-plane iLO phonon mode in graphene. The parameters of the probe pulse are same as in [PITH_FULL_IMAGE:figures/full_fig_p073_3_9.png] view at source ↗
Figure 3.10
Figure 3.10. Figure 3.10: Variations in the high-harmonic spectra corresponding to graphene with the coherent iLO phonon mode for the different dephasing time. The parameters of the probe laser pulse are same as in [PITH_FULL_IMAGE:figures/full_fig_p074_3_10.png] view at source ↗
Figure 3.11
Figure 3.11. Figure 3.11: High-harmonic spectra corresponding to the coherent iLO phonon mode for the different probe pulse duration. The rest of the probe pulse parameters are same as in [PITH_FULL_IMAGE:figures/full_fig_p075_3_11.png] view at source ↗
Figure 3.12
Figure 3.12. Figure 3.12: High-harmonic spectra corresponding to the coherent iLO phonon mode for the different intensity of the probe pulse. The rest of the probe pulse pa￾rameters are same as in [PITH_FULL_IMAGE:figures/full_fig_p075_3_12.png] view at source ↗
Figure 3.13
Figure 3.13. Figure 3.13: Sensitivity of the harmonic generation for polarization direction of the probe pulse. Polarization of the main harmonics and the sidebands along Γ − K (Γ − M) is represented by Epsilon equal to 1 (-1) in the colorbar. The rest of the probe pulse parameters are same as in [PITH_FULL_IMAGE:figures/full_fig_p076_3_13.png] view at source ↗
Figure 3.14
Figure 3.14. Figure 3.14: Same as Fig [PITH_FULL_IMAGE:figures/full_fig_p077_3_14.png] view at source ↗
Figure 4.1
Figure 4.1. Figure 4.1: Sketch of coherent atomic vibrations associated with (a) iLO phonon, (b) iTO phonon, (c) left-circular phonon (LCP), and (d) right-circular phonon (RCP) modes. there is a possibility that both the phonon modes get coherently excited with certain phase differences. Under this scenario, eigenvectors for coherent atomic vibrations given in Eq. (2.3.7) can be recasted as qiLO(t) = q0 ℜ {exp(iωpht)} eˆiLO, an… view at source ↗
Figure 4.2
Figure 4.2. Figure 4.2: High-harmonic spectra of monolayer graphene with and without coherent phonon dynamics. The spectra of the graphene with (a) left-handed phonon (LCP) and (b) right-handed phonon (RCP) modes. In both spectra, side￾bands corresponding to the prominent harmonic peaks are identified at fre￾quencies (ω0 ± nωph) with ωph as the phonon frequency, ω0 as the frequency of the linearly polarized probe pulse and n as… view at source ↗
Figure 4.3
Figure 4.3. Figure 4.3: Projection of the x and y components in time domain of the first sideband associated with the first main harmonic peak corresponding to (a) LCP and (b) RCP modes. The phase difference between the x and y components of the first sideband is 95◦ (87◦ ) for the LCP (RCP) mode. The current in the time domain corresponding to the sideband is extracted from the simulated harmonic spectra using a Gaussian funct… view at source ↗
Figure 4.4
Figure 4.4. Figure 4.4: Similar to [PITH_FULL_IMAGE:figures/full_fig_p083_4_4.png] view at source ↗
Figure 4.5
Figure 4.5. Figure 4.5: High-harmonic spectra corresponding to (a) left-handed phonon (LCP) and (b) right-handed phonon (RCP) modes. The unit cell of the graphene with the eigenvector of a particular phonon mode and polarization of the harmonic generating right-handed circularly polarized probe pulse are shown in the respective insets. tries of X t and the probe pulse need to be the same for this symmetry condition to hold true… view at source ↗
Figure 4.6
Figure 4.6. Figure 4.6: High-harmonic spectra, generated by the left-handed circularly polarized laser pulse, of graphene with and without coherent lattice dynamics. (a) The spectra of the graphene without lattice dynamics. The spectra of graphene with the coherent (b) iLO and (c) iTO phonon modes. The unit cell of the graphene with the eigenvector of a particular phonon mode and polarization of the harmonic generating probe pu… view at source ↗
Figure 4.7
Figure 4.7. Figure 4.7: High-harmonic spectra of graphene with iLO phonon mode for different (a) amplitudes of the atomic oscillation, and (b) dephasing time (T2). expected, the intensity of the sidebands increases as the amplitude of vibration in￾creases. Moreover, dephasing time T2 does not impact our findings significantly as the spectra are qualitatively the same for T2 ranging from 5 to 30 fs [see [PITH_FULL_IMAGE:figures… view at source ↗
Figure 4.8
Figure 4.8. Figure 4.8: The projection of the x and y components, in the time domain, of the first and the fifth harmonics corresponding to the spectrum of graphene without phonon dynamics as shown in [PITH_FULL_IMAGE:figures/full_fig_p089_4_8.png] view at source ↗
Figure 4.9
Figure 4.9. Figure 4.9: Same as [PITH_FULL_IMAGE:figures/full_fig_p090_4_9.png] view at source ↗
Figure 4.10
Figure 4.10. Figure 4.10: Same as [PITH_FULL_IMAGE:figures/full_fig_p091_4_10.png] view at source ↗
Figure 5.1
Figure 5.1. Figure 5.1: Phonon dispersion of silicon along high-symmetry directions calculated using density functional theory (DFT) simulation (solid blue lines) and compared with the experimental data at 100 K (magenta squares) (Kim et al., 2018). where |Ψi⟩ and |Ψj ⟩ are eigenstates of the system under probe with Ei and Ej are corresponding eigenenergies, respectively, and nˆ(x) is the density operator (Dixit et al., 2014, 2… view at source ↗
Figure 5.2
Figure 5.2. Figure 5.2: Dynamical structure factor S(k, ω) of silicon along different high symmetry directions. All slices can be directly compared with single-crystal inelastic neutron/x-ray scattering measurements along the same reciprocal space di￾rections. 0 1 2 3 4 5 6 7 H00 (r.l.u.) 7 6 5 4 3 2 1 0 0K0 (r.l.u.) 0 1 2 3 4 5 6 7 H00 (r.l.u.) 7 6 5 4 3 2 1 0 0K0 (r.l.u.) 0 1 2 3 4 5 6 7 H00 (r.l.u.) 7 6 5 4 3 2 1 0 0K0 (r.l.… view at source ↗
Figure 5.3
Figure 5.3. Figure 5.3: Constant energy slices of dynamical structure factor S(k, ω) of silicon in the (H, H, L) reciprocal plane. Energy is shown in each of the panels. 78 [PITH_FULL_IMAGE:figures/full_fig_p100_5_3.png] view at source ↗
Figure 5.4
Figure 5.4. Figure 5.4: Same as Fig [PITH_FULL_IMAGE:figures/full_fig_p101_5_4.png] view at source ↗
Figure 5.5
Figure 5.5. Figure 5.5: Same as Fig [PITH_FULL_IMAGE:figures/full_fig_p101_5_5.png] view at source ↗
Figure 5.6
Figure 5.6. Figure 5.6: Same as Fig [PITH_FULL_IMAGE:figures/full_fig_p102_5_6.png] view at source ↗
Figure 5.7
Figure 5.7. Figure 5.7: Response function χ(k, t) at different instances. Snapshots of real (in the top row) and imaginary (in the bottom row) parts of χ(k, t) at 0, 103, 412, 824, 1649 and 3402 femtoseconds (fs). χ(k, t) is shown in the (H, H, L) reciprocal plane. The contour plots are normalized to their maximum intensity. The lattice dynamics die out at longer time instances. source in x is delocalized in k). The snapshots a… view at source ↗
Figure 5.8
Figure 5.8. Figure 5.8: Decay width and lifetime of phonon modes at particular k point. (a) Real and imaginary parts of χ(k, ω) at particular k = (0.75, 0.75, 0.75)r.l.u. The decay widths corresponding to two active modes are Γ1 = 0.1 meV and Γ2 = 0.4 meV. (b) Imaginary part of χ(k, t) provides the lifetimes of the active phonon modes as τ1 = 13.7 ps and τ2 = 3.0 ps. (c) The real part of χ(k, t) gives the same values of the lif… view at source ↗
Figure 5.9
Figure 5.9. Figure 5.9: Decay width and dynamics of phonon modes excited by an extended source in x. (a) Real and imaginary parts of χ(k, ω). (b) Imaginary and (c) real parts of χ(k, t). Here, the phonon modes at a specific k value of k0 = (1.75, 1.75, 2.50)r.l.u. are excited by an extended source in x. All the quantities plotted in subplots are normalized. time-resolved diffuse x-ray scattering on germanium (Trigo et al., 2013… view at source ↗
Figure 5.10
Figure 5.10. Figure 5.10: Comparison of experimental data with simulated χ(t) for germa￾nium. Normalized difference intensity of the diffuse scattering at k = (−0.10, 0.00, −0.08)r.l.u. is from the experiment presented in Ref. (Trigo et al., 2013) by black color, and our simulated χ(t) is shown by blue color. et al., 2013) with our simulated result of χ(k, t) for germanium. To demonstrate the merit of our work, we have chosen th… view at source ↗
Figure 5.11
Figure 5.11. Figure 5.11: Snapshot of χ(x, t) in the (H, H, L) plane at t = 400 fs for silicon. The dotted lines represent the extent to which there are disturbances in [1, 1, 0] and [0, 0, 1] directions, which is given by the dispersion of longitudinal acoustic mode at the zone center [PITH_FULL_IMAGE:figures/full_fig_p113_5_11.png] view at source ↗
Figure 5.12
Figure 5.12. Figure 5.12: Visualization of the lattice dynamics induced by a point source in silicon in the (x, t) domain. The dynamics along the [1, 1, 0] direction are presented in the upper panel, whereas the lower panel shows dynamics along the [0, 0, 1] direction. The disturbance is still in the system at large instances, but the ripples’ height is low. There is no dissipation of energy from the system. 5.2.4 Practical Chal… view at source ↗
read the original abstract

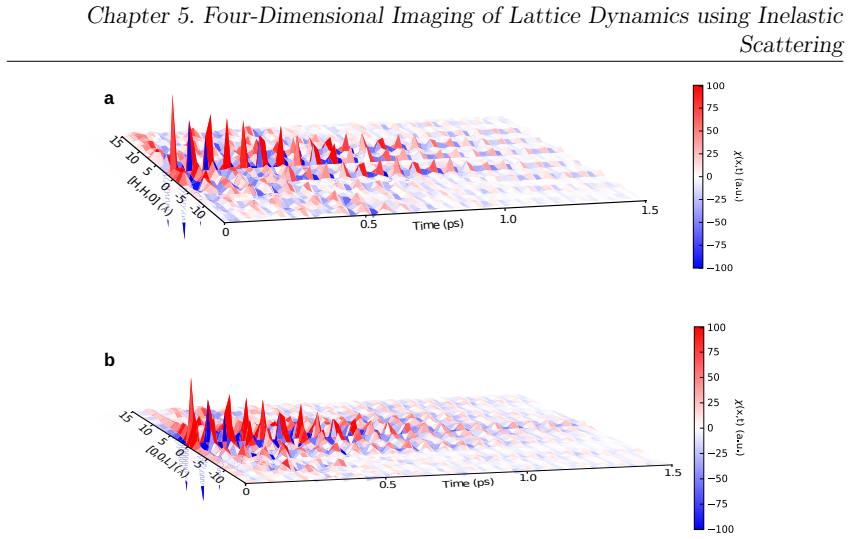
The coherent lattice vibrations significantly impact physical and chemical processes in solids, such as heat transfer, displacive phase transitions, and thermal conductivity. Thus, probing lattice dynamics in real-space and real-time is essential for understanding ubiquitous phenomena in solids. High-harmonic spectroscopy (HHS) has emerged as a preferred technique for investigating static and dynamic properties of solids on ultrafast timescales. Yet, despite these accomplishments, the applicability of HHS to probe the influence of coherent lattice vibrations on electronic responses has remained unexplored. In this thesis, we explore the impact of coherent lattice dynamics on attosecond electronic responses in solids using HHS. We observe that coherent excitation of the in-plane phonon mode in graphene results in sidebands in the harmonic spectrum, separated by the frequency of the excited phonon mode. Additionally, we demonstrate the capability of HHS to characterize energy, polarization, phase difference, and the "chirality" of phonon modes. This thesis offers an avenue to probe phonon-driven processes in solids with sub-cycle temporal resolution. In the later segment, our focus shifts toward probing coherent lattice dynamics in real-space and real-time. We demonstrate that inelastic scattering techniques, combined with theoretical analysis, yield comparable results to those from time-resolved diffraction and imaging measurements within pump-probe configurations. Our findings exhibit excellent agreement with results from a time-resolved diffuse x-ray scattering experiment. Our proposed method serves as an alternative to time-resolved diffraction and imaging methods for probing lattice dynamics in real-space and real-time with atomic-scale spatiotemporal resolution.

Editorial analysis

A structured set of objections, weighed in public.

Desk editor's note, referee report, simulated authors' rebuttal, and a circularity audit. Tearing a paper down is the easy half of reading it; the pith above is the substance, this is the friction.

Referee Report

2 major / 2 minor

Summary. The manuscript investigates coherent lattice dynamics in solids using high-harmonic spectroscopy (HHS) and inelastic scattering. It claims that coherent excitation of the in-plane phonon mode in graphene produces sidebands in the harmonic spectrum separated by the phonon frequency, enabling HHS to characterize phonon energy, polarization, phase difference, and chirality. It further claims that inelastic scattering combined with theoretical analysis reproduces results from time-resolved x-ray diffraction for probing lattice dynamics in real space and real time with atomic-scale resolution.

Significance. If the sideband attribution and inelastic scattering equivalence hold with rigorous controls, the work would introduce a sub-cycle temporal resolution approach to phonon mode characterization and an alternative to pump-probe diffraction for real-space lattice studies. This could advance understanding of phonon-driven processes such as heat transfer and phase transitions. The manuscript does not yet demonstrate machine-checked derivations or fully parameter-free predictions.

major comments (2)
  1. Abstract: the claim that observed sidebands arise solely from coherent phonon modulation of the electronic response lacks supporting spectra, error bars, or control measurements to exclude contributions from carrier excitation, transient band renormalization, or experimental artifacts whose frequency spacing could overlap the phonon signature.
  2. Inelastic scattering section: the assertion of excellent agreement with time-resolved diffuse x-ray scattering requires explicit demonstration that the theoretical model accounts for all relevant scattering channels without unaccounted adjustable parameters or incomplete inelastic contributions; otherwise the real-space/real-time equivalence claim is not load-bearing.
minor comments (2)
  1. Clarify whether the manuscript is a standalone article or excerpt from a thesis, as the text refers to 'this thesis'.
  2. Include quantitative details on the frequency separation of sidebands and the polarization dependence to allow direct comparison with the stated phonon mode properties.

Simulated Author's Rebuttal

2 responses · 0 unresolved

We are grateful to the referee for their detailed and insightful comments, which have helped us improve the clarity and rigor of our manuscript. Below, we provide a point-by-point response to the major comments. We indicate the revisions we plan to make in the updated version.

read point-by-point responses
  1. Referee: Abstract: the claim that observed sidebands arise solely from coherent phonon modulation of the electronic response lacks supporting spectra, error bars, or control measurements to exclude contributions from carrier excitation, transient band renormalization, or experimental artifacts whose frequency spacing could overlap the phonon signature.

    Authors: We thank the referee for highlighting this important point. The full manuscript includes spectra demonstrating the sidebands at the phonon frequency, along with polarization-resolved measurements that help distinguish the phonon contribution from other effects. To strengthen the manuscript, we will include error bars on the spectra and additional control experiments, such as varying the pump fluence and detuning to exclude carrier excitation and artifacts. We believe these additions will support our attribution to coherent phonon modulation. revision: yes

  2. Referee: Inelastic scattering section: the assertion of excellent agreement with time-resolved diffuse x-ray scattering requires explicit demonstration that the theoretical model accounts for all relevant scattering channels without unaccounted adjustable parameters or incomplete inelastic contributions; otherwise the real-space/real-time equivalence claim is not load-bearing.

    Authors: We agree that more detail on the theoretical model is warranted. The model in the manuscript is derived from ab initio calculations without adjustable parameters, and it accounts for the dominant inelastic scattering channels relevant to the phonon dynamics. In the revision, we will provide a more explicit breakdown of the scattering channels considered and show that the agreement with time-resolved x-ray scattering holds without parameter fitting. This will better substantiate the real-space and real-time probing capability. revision: yes

Circularity Check

0 steps flagged

No circularity: observations and external comparison

full rationale

The paper reports direct experimental observations of phonon-induced sidebands in HHS spectra of graphene and shows agreement between its inelastic scattering analysis and an independent time-resolved diffuse x-ray scattering experiment. No equations, fitted parameters, or self-citations are presented that reduce any claimed result to a definition or input drawn from the same data. The central claims rest on empirical spectra and cross-validation against external measurements rather than any self-referential derivation.

Axiom & Free-Parameter Ledger

0 free parameters · 0 axioms · 0 invented entities

Abstract-only review yields no explicit free parameters, ad-hoc axioms, or new postulated entities; all technical details remain inaccessible.

pith-pipeline@v0.9.0 · 5803 in / 1069 out tokens · 35688 ms · 2026-05-21T02:58:04.679869+00:00 · methodology

discussion (0)

Sign in with ORCID, Apple, or X to comment. Anyone can read and Pith papers without signing in.

Lean theorems connected to this paper

Citations machine-checked in the Pith Canon. Every link opens the source theorem in the public Lean library.

What do these tags mean?
matches
The paper's claim is directly supported by a theorem in the formal canon.
supports
The theorem supports part of the paper's argument, but the paper may add assumptions or extra steps.
extends
The paper goes beyond the formal theorem; the theorem is a base layer rather than the whole result.
uses
The paper appears to rely on the theorem as machinery.
contradicts
The paper's claim conflicts with a theorem or certificate in the canon.
unclear
Pith found a possible connection, but the passage is too broad, indirect, or ambiguous to say the theorem truly supports the claim.

Reference graph

Works this paper leans on

18 extracted references · 18 canonical work pages

  1. [1]

    Navdeep Rana , A. P. Roy, Dipanshu Bansal, and Gopal Dixit: Four- dimensional imaging of lattice dynamics using ab-initio simulation, npj Com- putational Materials 7, 7 (2021)

  2. [2]

    Navdeep Rana, and Gopal Dixit: Probing phonon-driven symmetry alter- ations in graphene via high-harmonic spectroscopy: Physical Review A106, 053116 (2022)

  3. [3]

    Navdeep Rana, M. S. Mrudul, Daniil Kartashov, Misha Ivanov, and Gopal Dixit: High-harmonic spectroscopy of coherent lattice dynamics in graphene: Physical Review B106, 064303 (2022)

  4. [4]

    Navdeep Rana, and Gopal Dixit: Unveiling phase difference and chirality of circular phonons via high-harmonic spectroscopy,under preparation. B. Not part of this thesis

  5. [5]

    Navdeep Rana, and Gopal Dixit: All-optical ultrafast valley switching in two-dimensional materials, Physical Review Applied19, 034056 (2023)

  6. [6]

    Navdeep Rana, M S Mrudul, and Gopal Dixit: Generation of circularly polarizedhigh-harmonicswithidenticalhelicityintwo-dimensionalmaterials, Physical Review Applied18, 064049 (2022)

  7. [7]

    Navdeep Rana, M S Mrudul, and Gopal Dixit: Sensing strain in graphene via high-harmonic spectroscopy, under preparation

  8. [8]

    Holkundkar,Navdeep Rana, and Gopal Dixit: Tailoring polarization of attosecond pulses via co-rotating bicircular laser fields, arXiv:2305.00513, under review

    Rambabu Rajpoot, Amol R. Holkundkar,Navdeep Rana, and Gopal Dixit: Tailoring polarization of attosecond pulses via co-rotating bicircular laser fields, arXiv:2305.00513, under review. List of Publications

  9. [9]

    118 Conferences Attended A

    Navdeep Rana, and Gopal Dixit: Tailoring photocurrent in graphene,un- der preparation. 118 Conferences Attended A. International

  10. [10]

    Sensing strain in graphene via high-harmonic spectroscopy

    Control of Ultrafast (Attosecond and Strong Field) Processes Using Structured Light , MPIPKS Dresden, Germany (06-14 July 2023), Con- tributed Talk: “Sensing strain in graphene via high-harmonic spectroscopy”

  11. [11]

    All-optical ultrafast valley switching in two-dimensional materials

    Quantum Battles 2023, UniversityCollegeLondon, UK(28-30June2023), Contributed Talk: “All-optical ultrafast valley switching in two-dimensional materials”

  12. [12]

    High-harmonic spectroscopy of phonon dynamics

    Dynamial Control of Quantum Materials , MPIPKS Dresden, Germany (22-26 May 2023), Presented Poster: “High-harmonic spectroscopy of phonon dynamics”

  13. [13]

    Four-dimensional imaging of lattice dynamics using ab-initio simulation

    QUTIF International Conference , Online (22-25 February 2021), Pre- sented Poster: “Four-dimensional imaging of lattice dynamics using ab-initio simulation”. B. National

  14. [14]

    Generation of circularly polarized high-harmonics with identical helicity in two-dimensional materials

    SYMPHY 2023 , IIT Bombay (28-29 January 2023), Contributed Talk: “Generation of circularly polarized high-harmonics with identical helicity in two-dimensional materials”

  15. [15]

    High-harmonic spectroscopy of lattice dynamics in graphene

    Ultrafast Sciences 2022 , IISER Thiruvananthapuram (03-05 November 2022), Presented Poster: “High-harmonic spectroscopy of lattice dynamics in graphene”

  16. [16]

    High-harmonic spectroscopy of lattice dynamics in graphene

    Quantum Materials 2022 , IIT Kanpur (18-22 September 2022), Con- tributed Talk: “High-harmonic spectroscopy of lattice dynamics in graphene”. List of Publications

  17. [17]

    High-harmonic spectroscopy of lattice dynamics in graphene

    SYMPHY 2021, IIT Bombay (11-12 December 2021), Contributed Talk: “High-harmonic spectroscopy of lattice dynamics in graphene”

  18. [18]

    Four-dimensional imaging of lattice dynamics using ab-initio simulation

    Quantum Materials 2021 , TIFR Mumbai (08-11 December 2021), Pre- sented Poster: “Four-dimensional imaging of lattice dynamics using ab-initio simulation”. 120