Few-shot Cross-country Generalization of Tabular Machine Learning and Foundation Models for Childhood Anemia Prediction under Distribution Shift
Pith reviewed 2026-06-29 19:51 UTC · model grok-4.3
The pith
TabPFN outperforms classical models in low-data regimes for childhood anemia prediction across countries.
A machine-rendered reading of the paper's core claim, the machinery that carries it, and where it could break.
Core claim
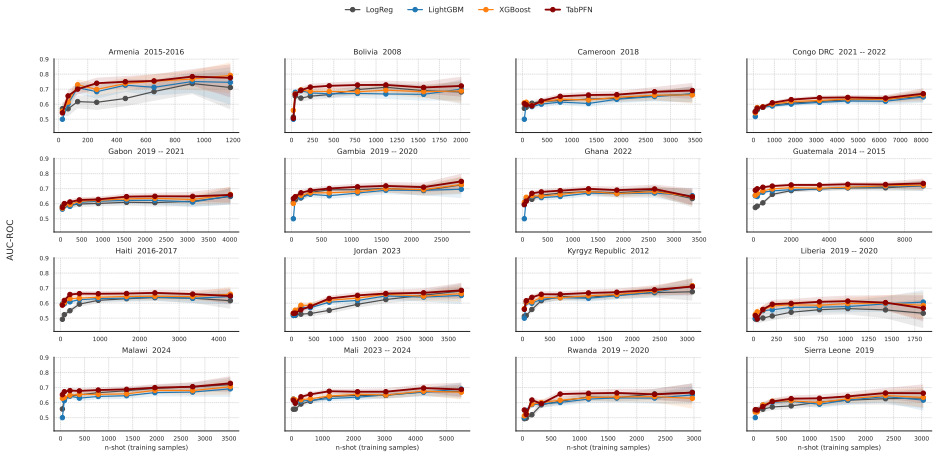
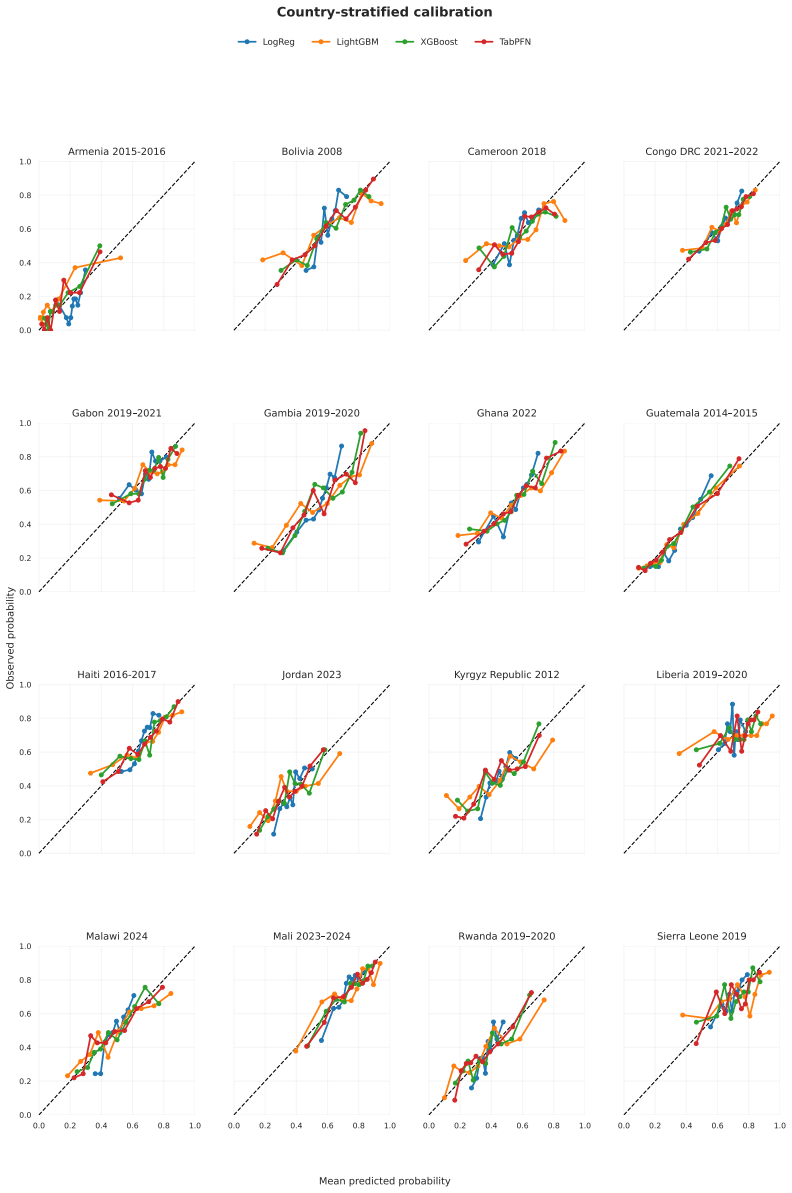
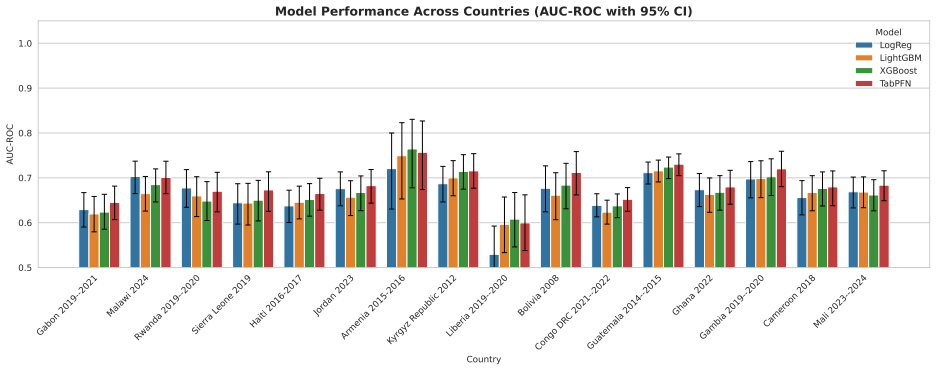
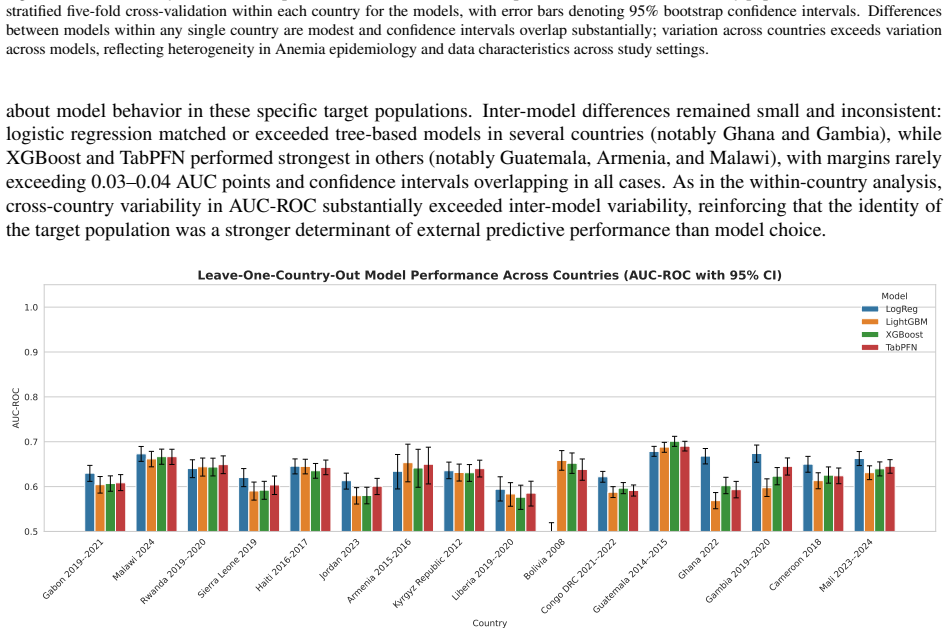
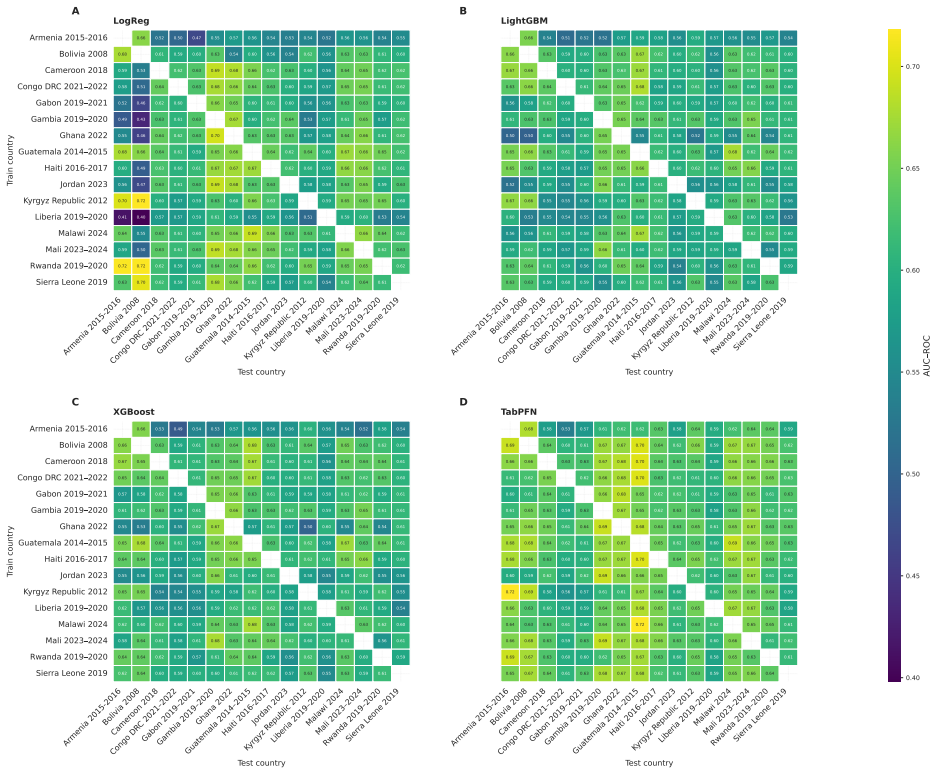
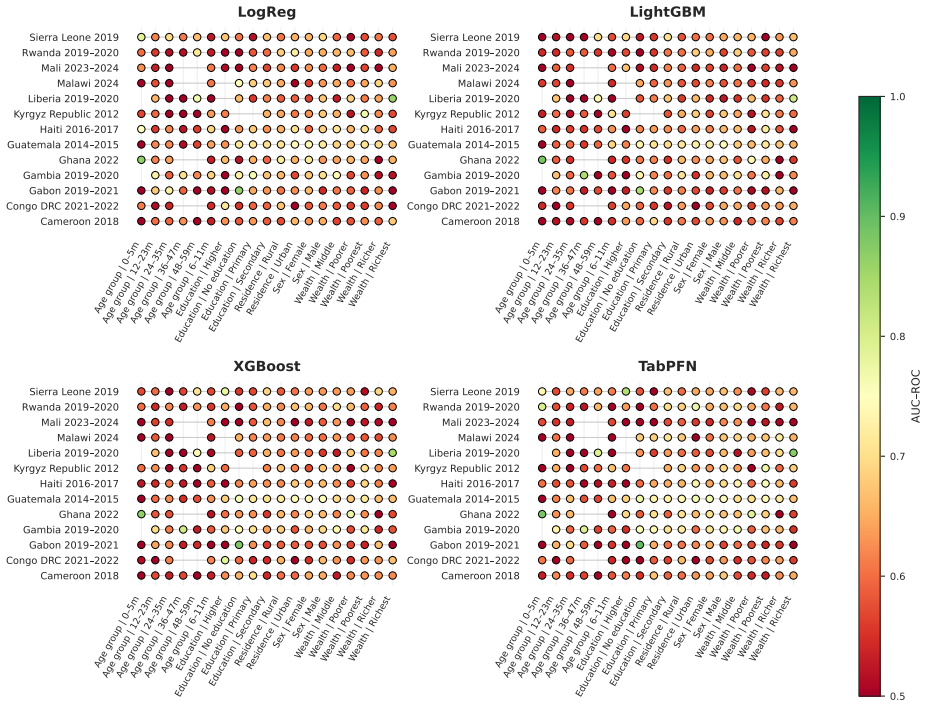
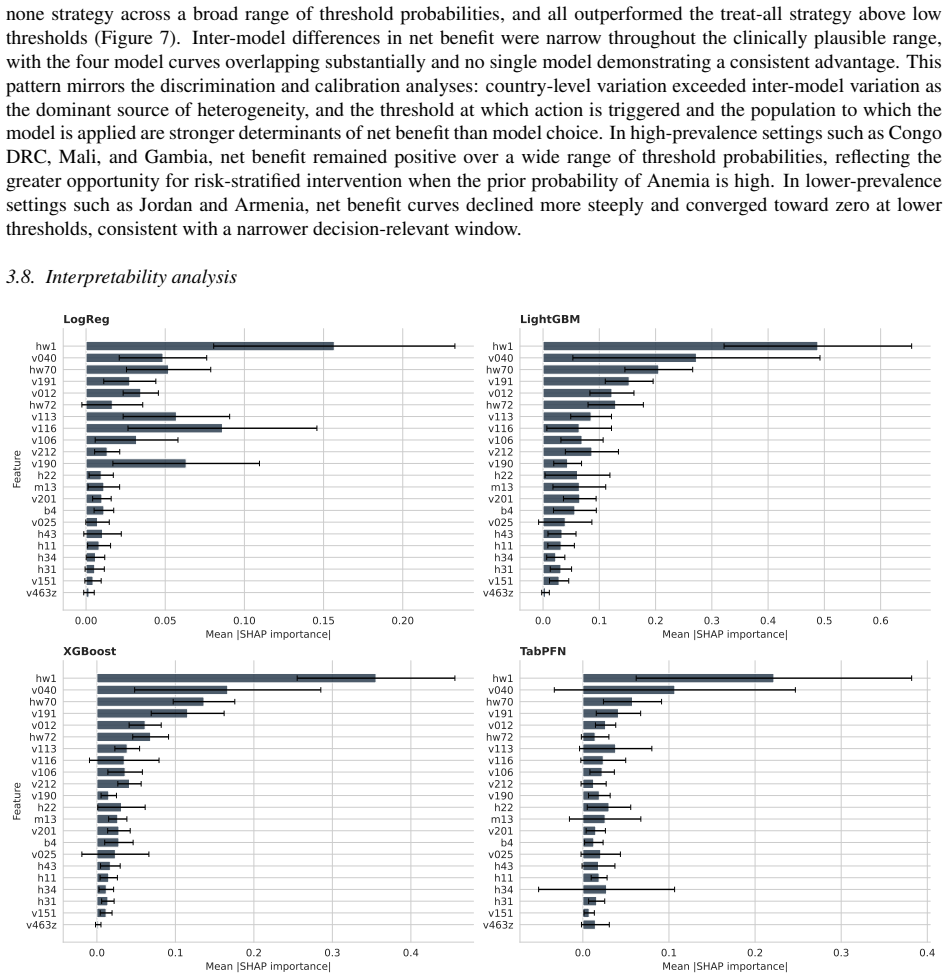
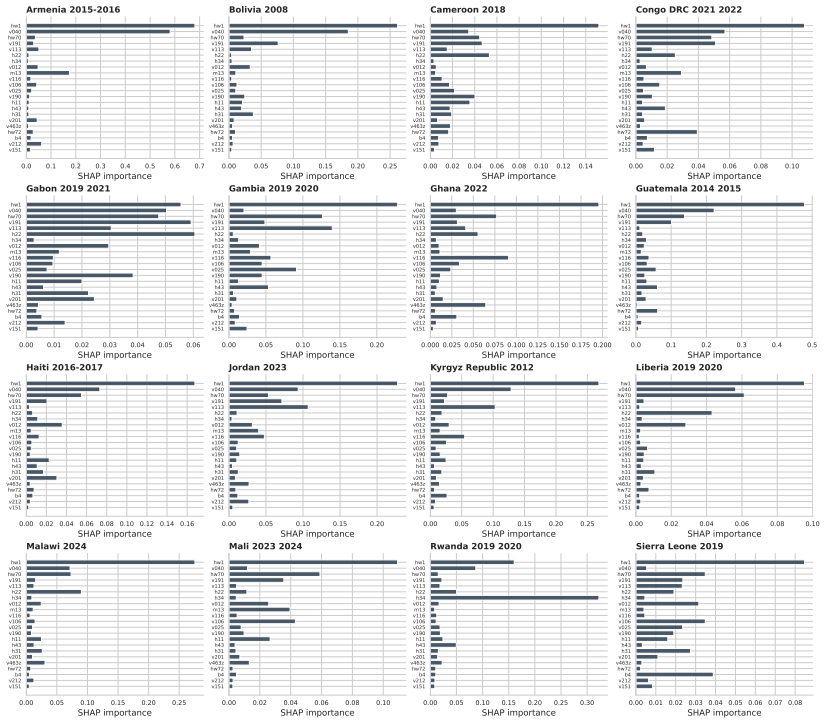
TabPFN v2.6 outperformed Logistic Regression, XGBoost, and LightGBM in low-data regimes with higher discrimination and better calibration, achieving the lowest Brier score of 0.042 and ECE of 0.203 across countries. In full-data settings AUC-ROC ranged 0.59-0.76 with small model differences. LOCO performance was stable at 0.58-0.69 driven by country context, with asymmetric transfer in reverse-LOCO. Subgroup performance was consistent without systematic bias, and SHAP identified child age, altitude, and height-for-age z-score as dominant predictors. Performance is driven more by population variation than model choice.
What carries the argument
TabPFN, a transformer-based foundation model for tabular data, evaluated via leave-one-country-out and few-shot protocols on DHS data for anemia prediction.
If this is right
- TabPFN can be applied in new countries with limited local training data for improved anemia prediction.
- Efforts in anemia modeling should focus on capturing population-specific factors rather than model complexity.
- Models show consistent performance across demographic subgroups, supporting broad application.
- Key predictors like child age, altitude, and HAZ can inform targeted health interventions.
Where Pith is reading between the lines
- Similar advantages for foundation models may appear in predictions of other childhood health conditions with scarce data.
- Validation on data from countries outside the original 16 would test the robustness of the observed cross-country generalization.
- Adding features beyond the current DHS set might reduce the dominance of population variation in performance.
Load-bearing premise
The leave-one-country-out and few-shot protocols capture the relevant distribution shifts that occur when deploying to a new country without additional unmeasured confounding factors.
What would settle it
A new country dataset where TabPFN fails to maintain its calibration and discrimination advantages would falsify the claim of superior low-data generalization.
Figures
read the original abstract
Childhood anemia affects around 40% of children aged 6-59 months globally and arises from heterogeneous factors, limiting model generalizability. We evaluate a transformer-based tabular foundation model against classical supervised methods under cross-country and data-scarce settings. We used DHS data from 16 countries across Africa, Asia, Latin America, the Caucasus, and the Middle East (n=68,856). We compared Logistic Regression, XGBoost, LightGBM, and TabPFN v2.6. Performance was assessed using AUC-ROC, Brier score, and ECE. Generalization was evaluated using leave-one-country-out (LOCO), reverse-LOCO, and few-shot settings. Subgroup analyses included sex, age, residence, maternal education, and wealth. Feature importance was estimated using SHAP. TabPFN outperformed classical models in low-data regimes (<200 samples), showing higher discrimination and better calibration. Across countries, it achieved the lowest Brier score (0.042) and ECE (0.203). Under full-data settings, AUC-ROC ranged from 0.59-0.76 with small between-model differences ($\leq 0.05$). LOCO performance was stable (0.58-0.69), driven by country context. Reverse-LOCO showed asymmetric transferability. Subgroup performance was consistent with no systematic demographic bias. SHAP identified child age, altitude, and height-for-age z-score as dominant predictors, followed by wealth and maternal education. Performance in childhood anemia prediction is driven more by population variation than model choice. TabPFN provides advantages in low-resource settings through improved discrimination and calibration, highlighting foundation models as promising tools for data-scarce global health prediction.
Editorial analysis
A structured set of objections, weighed in public.
Referee Report
Summary. The manuscript evaluates TabPFN v2.6 against Logistic Regression, XGBoost, and LightGBM for childhood anemia prediction on DHS data from 16 countries (n=68,856). It reports TabPFN advantages in few-shot regimes (<200 samples) with superior discrimination and calibration, lowest overall Brier score (0.042) and ECE (0.203), full-data AUC-ROC of 0.59-0.76 with small model differences (≤0.05), and stable LOCO performance (0.58-0.69) driven primarily by country-level population variation rather than model choice. Subgroup and SHAP analyses are also presented.
Significance. If the empirical comparisons hold after methodological clarification, the work provides useful evidence on the relative importance of data heterogeneity versus model architecture in tabular health prediction under distribution shift. The multi-country scale, use of calibration metrics alongside AUC, and explicit few-shot/LOCO protocols are strengths that could inform foundation-model deployment in low-resource global health settings.
major comments (2)
- [Abstract] Abstract and methods description: performance numbers (Brier 0.042, ECE 0.203, AUC ranges) and claims of outperformance are presented without any information on hyperparameter search, statistical testing, preprocessing pipelines, or class-imbalance handling. These omissions make the central numerical claims unverifiable and load-bearing for the reported superiority of TabPFN.
- [Abstract] Abstract: the claim that 'performance is driven more by population variation than model choice' rests on LOCO results showing stable AUC (0.58-0.69) and small between-model gaps (≤0.05). The experiments do not address or control for potential cross-country differences in DHS implementation (hemoglobin assay methods, altitude adjustments, sampling frames, or anemia threshold application) that may confound the intended population shifts and correlate with dominant SHAP features (child age, height-for-age z-score).
minor comments (2)
- [Abstract] The abstract would benefit from explicit reporting of per-country sample sizes and anemia prevalence to contextualize the LOCO stability claim.
- Consider adding a brief statement on how the few-shot subsets (<200 samples) were constructed (random, stratified, or otherwise) to allow replication of the low-data regime results.
Simulated Author's Rebuttal
We thank the referee for the constructive feedback on verifiability and potential confounders. We address each major comment below and indicate planned revisions.
read point-by-point responses
-
Referee: [Abstract] Abstract and methods description: performance numbers (Brier 0.042, ECE 0.203, AUC ranges) and claims of outperformance are presented without any information on hyperparameter search, statistical testing, preprocessing pipelines, or class-imbalance handling. These omissions make the central numerical claims unverifiable and load-bearing for the reported superiority of TabPFN.
Authors: We agree that additional methodological details are needed for full verifiability. The full manuscript methods section describes the models and metrics but does not explicitly detail hyperparameter procedures, statistical tests, or imbalance handling. In revision we will expand the methods to specify: (i) hyperparameter search (TabPFN used defaults per v2.6; classical models used scikit-learn/XGBoost defaults with limited grid search on learning rate and depth); (ii) statistical testing (bootstrap 95% CIs on AUC/Brier and DeLong tests for pairwise comparisons); (iii) preprocessing (median imputation for missing values, z-score standardization for LR, one-hot encoding for categoricals); and (iv) imbalance handling (class weights in LR/XGBoost/LightGBM; TabPFN's built-in handling). A concise summary will be added to the abstract if space allows. These additions will make the reported numbers transparent without altering results. revision: yes
-
Referee: [Abstract] Abstract: the claim that 'performance is driven more by population variation than model choice' rests on LOCO results showing stable AUC (0.58-0.69) and small between-model gaps (≤0.05). The experiments do not address or control for potential cross-country differences in DHS implementation (hemoglobin assay methods, altitude adjustments, sampling frames, or anemia threshold application) that may confound the intended population shifts and correlate with dominant SHAP features (child age, height-for-age z-score).
Authors: The LOCO design intentionally captures the net effect of all country-level factors (including any unmeasured DHS implementation differences) on performance. The observed pattern—larger AUC variation across countries (0.58-0.69) than across models (≤0.05)—still indicates that population context dominates model architecture. We acknowledge that the paper does not explicitly control for assay methods, sampling frames, or threshold variations, as these metadata are not uniformly available in the public DHS files. Altitude is included as a covariate and appears in SHAP rankings, partially addressing one listed factor. In revision we will add an explicit limitations paragraph discussing these potential confounders and noting that the small model gaps persist even under the observed heterogeneity. No new experiments are feasible without external data sources. revision: partial
Circularity Check
Purely empirical comparison with no derivation chain
full rationale
This is a standard empirical ML benchmarking paper that trains and evaluates models (LR, XGBoost, LightGBM, TabPFN) on DHS tabular data under LOCO, reverse-LOCO, and few-shot protocols, reporting AUC, Brier, ECE, and SHAP values. No equations, first-principles derivations, fitted parameters renamed as predictions, or self-citation chains appear anywhere in the provided text. All performance claims reduce directly to measured outcomes on held-out country subsets rather than to any internal definition or prior author result, so the analysis is self-contained.
Axiom & Free-Parameter Ledger
free parameters (1)
- model hyperparameters
axioms (1)
- domain assumption DHS survey responses provide accurate labels for anemia status and risk factors across the sampled countries
Reference graph
Works this paper leans on
-
[1]
Anaemia; 2025
World Health Organization. Anaemia; 2025. Fact sheet, updated 10 February 2025.https://www.who. int/news-room/fact-sheets/detail/anaemia
2025
-
[2]
Prevalence, years lived with disability, and trends in anaemia burden by severity and cause, 1990–2021: findings from the Global Burden of Disease Study 2021
Gardner WM, Razo C, McHugh TA, Hagins H, Vilchis-Tella VM, Hennessy C, et al. Prevalence, years lived with disability, and trends in anaemia burden by severity and cause, 1990–2021: findings from the Global Burden of Disease Study 2021. The Lancet Haematology. 2023;10(9):e713-34
1990
-
[3]
Application of machine learning methods for predicting childhood anaemia: Analysis of Ethiopian Demographic Health Survey of 2016
Tesfaye SH, Seboka BT, Sisay D. Application of machine learning methods for predicting childhood anaemia: Analysis of Ethiopian Demographic Health Survey of 2016. Plos one. 2024;19(4):e0300172
2016
-
[4]
Dataset Types; 2026
The DHS Program. Dataset Types; 2026. Accessed February 19, 2026.https://dhsprogram.com/ data/dataset-types.cfm
2026
-
[5]
Machine learning algorithms to predict the childhood anemia in Bangladesh
Khan JR, Chowdhury S, Islam H, Raheem E. Machine learning algorithms to predict the childhood anemia in Bangladesh. Journal of Data Science. 2019;17(1):195-218
2019
-
[6]
Optimizing Predictive Analytics for Childhood Anaemia: A Machine Learning Model Approach
Das B, Barman MP, Kotoky MJ. Optimizing Predictive Analytics for Childhood Anaemia: A Machine Learning Model Approach. Clinical Epidemiology and Global Health. 2025:102275
2025
-
[7]
Predicting Childhood Anaemia in Nigeria: A Machine Learning Approach to Uncover Key Risk Factors
Ja’afar IK, Uthman OA. Predicting Childhood Anaemia in Nigeria: A Machine Learning Approach to Uncover Key Risk Factors. Public Health Challenges. 2025;4(4):e70135
2025
-
[8]
Predicting childhood anaemia in Ghana with ex- plainable machine learning: A national survey analysis
Hassan YSA, Omar MA, Karikari JK, Ali AS, Ahmed MM. Predicting childhood anaemia in Ghana with ex- plainable machine learning: A national survey analysis. Digital Health. 2026;12:20552076261437179
2026
-
[9]
Accurate predictions on small data with a tabular foundation model
Hollmann N, Müller S, Purucker L, Krishnakumar A, Körfer M, Hoo SB, et al. Accurate predictions on small data with a tabular foundation model. Nature. 2025;637(8045):319-26
2025
-
[10]
A closer look at TabPFN v2: Understanding its strengths and extending its capabilities
Ye HJ, Liu SY , Chao WL. A closer look at TabPFN v2: Understanding its strengths and extending its capabilities. arXiv preprint arXiv:250217361. 2025. 19
2025
-
[11]
Robustness and Scalability Of Machine Learning for Imbalanced Clinical Data in Emer- gency and Critical Care
Brima Y , Atemkeng M. Robustness and Scalability Of Machine Learning for Imbalanced Clinical Data in Emer- gency and Critical Care. arXiv preprint arXiv:251221602. 2025
2025
-
[12]
TRIPOD+ AI statement: up- dated guidance for reporting clinical prediction models that use regression or machine learning methods
Collins GS, Moons KG, Dhiman P, Riley RD, Beam AL, Van Calster B, et al. TRIPOD+ AI statement: up- dated guidance for reporting clinical prediction models that use regression or machine learning methods. bmj. 2024;385
2024
-
[13]
health surveys (various)[Datasets]
Demographic I. health surveys (various)[Datasets]. Funded by USAID. 2017:2014-8
2017
-
[14]
Using Datasets for Analysis; 2026
The DHS Program. Using Datasets for Analysis; 2026. Accessed February 19, 2026.https:// dhsprogram.com/data/using-datasets-for-analysis.cfm
2026
-
[15]
Anaemia, children aged 6–59 months with haemoglobin concen- tration less than 110 g/L, adjusted for altitude; n.d
World Health Organization. Anaemia, children aged 6–59 months with haemoglobin concen- tration less than 110 g/L, adjusted for altitude; n.d. Accessed 2026-02-25. Available from: https://www.who.int/data/gho/indicator-metadata-registry/imr-details/ number-of-children-aged-6-59-months-with-anaemia
2026
-
[16]
Guideline on Haemoglobin Cutoffs to Define Anaemia in Individuals and Pop- ulations; 2024
World Health Organization. Guideline on Haemoglobin Cutoffs to Define Anaemia in Individuals and Pop- ulations; 2024. Accessed February 25, 2026.https://www.who.int/publications/i/item/ 9789240088542
2024
-
[17]
Guideline on haemoglobin cutoffs to define anaemia in individuals and populations
Organization WH. Guideline on haemoglobin cutoffs to define anaemia in individuals and populations. World Health Organization; 2024
2024
-
[18]
Optimizing machine learning models for predicting anemia among under-five children in Ethiopia: insights from Ethiopian demographic and health survey data
Yimer A, Yesuf HA, Ahmed S, Zemariam AB, Mussa E, Sirage N, et al. Optimizing machine learning models for predicting anemia among under-five children in Ethiopia: insights from Ethiopian demographic and health survey data. BMC pediatrics. 2025;25(1):311
2025
-
[19]
Hybrid Machine Learning Model for the Prediction of Anaemia
Said RO, Tunga M. Hybrid Machine Learning Model for the Prediction of Anaemia. Machine Learning with Applications. 2025:100741
2025
-
[20]
Regression modeling strategies
Nunez E, Steyerberg EW, Nunez J. Regression modeling strategies. Revista Española de Cardiología (English Edition). 2011;64(6):501-7
2011
-
[21]
Xgboost: A scalable tree boosting system
Chen T, Guestrin C. Xgboost: A scalable tree boosting system. In: Proceedings of the 22nd acm sigkdd international conference on knowledge discovery and data mining; 2016. p. 785-94
2016
-
[22]
Lightgbm: A highly efficient gradient boosting decision tree
Ke G, Meng Q, Finley T, Wang T, Chen W, Ma W, et al. Lightgbm: A highly efficient gradient boosting decision tree. Advances in neural information processing systems. 2017;30
2017
-
[23]
Optuna: A next-generation hyperparameter optimization frame- work
Akiba T, Sano S, Yanase T, Ohta T, Koyama M. Optuna: A next-generation hyperparameter optimization frame- work. In: Proceedings of the 25th ACM SIGKDD international conference on knowledge discovery & data mining; 2019. p. 2623-31
2019
-
[24]
Statistical modeling: The two cultures (with comments and a rejoinder by the author)
Breiman L. Statistical modeling: The two cultures (with comments and a rejoinder by the author). Statistical science. 2001;16(3):199-231
2001
-
[25]
A unified approach to interpreting model predictions
Lundberg SM, Lee SI. A unified approach to interpreting model predictions. Advances in neural information processing systems. 2017;30
2017
-
[26]
shapiq: Shapley Interactions for Machine Learning
Muschalik M, Baniecki H, Fumagalli F, Kolpaczki P, Hammer B, Hüllermeier E. shapiq: Shapley Interactions for Machine Learning. In: Advances in Neural Information Processing Systems. vol. 37; 2024. p. 130324-57. Available from:https://openreview.net/forum?id=knxGmi6SJi
2024
-
[27]
Interpretable Machine Learning for TabPFN
Rundel D, Kobialka J, von Crailsheim C, Feurer M, Nagler T, Rügamer D. Interpretable Machine Learning for TabPFN. In: Explainable Artificial Intelligence; 2024. p. 465-76. Available from:https://link. springer.com/chapter/10.1007/978-3-031-63797-1_23
-
[28]
External validation of clinical predic- tion models using big datasets from e-health records or IPD meta-analysis: opportunities and challenges
Riley RD, Ensor J, Snell KI, Debray TP, Altman DG, Moons KG, et al. External validation of clinical predic- tion models using big datasets from e-health records or IPD meta-analysis: opportunities and challenges. bmj. 2016;353. 20
2016
-
[29]
Shortcut learning in deep neural networks
Geirhos R, Jacobsen JH, Michaelis C, Zemel R, Brendel W, Bethge M, et al. Shortcut learning in deep neural networks. Nature Machine Intelligence. 2020;2(11):665-73
2020
-
[30]
Ong Ly C, Unnikrishnan B, Tadic T, Patel T, Duhamel J, Kandel S, et al. Shortcut learning in medical AI hinders generalization: method for estimating AI model generalization without external data. NPJ digital medicine. 2024;7(1):124. 21 Appendix A. Preprocessing, modelling and evaluation Appendix A.1. Preprocessing pipeline Cohort derivation Records extra...
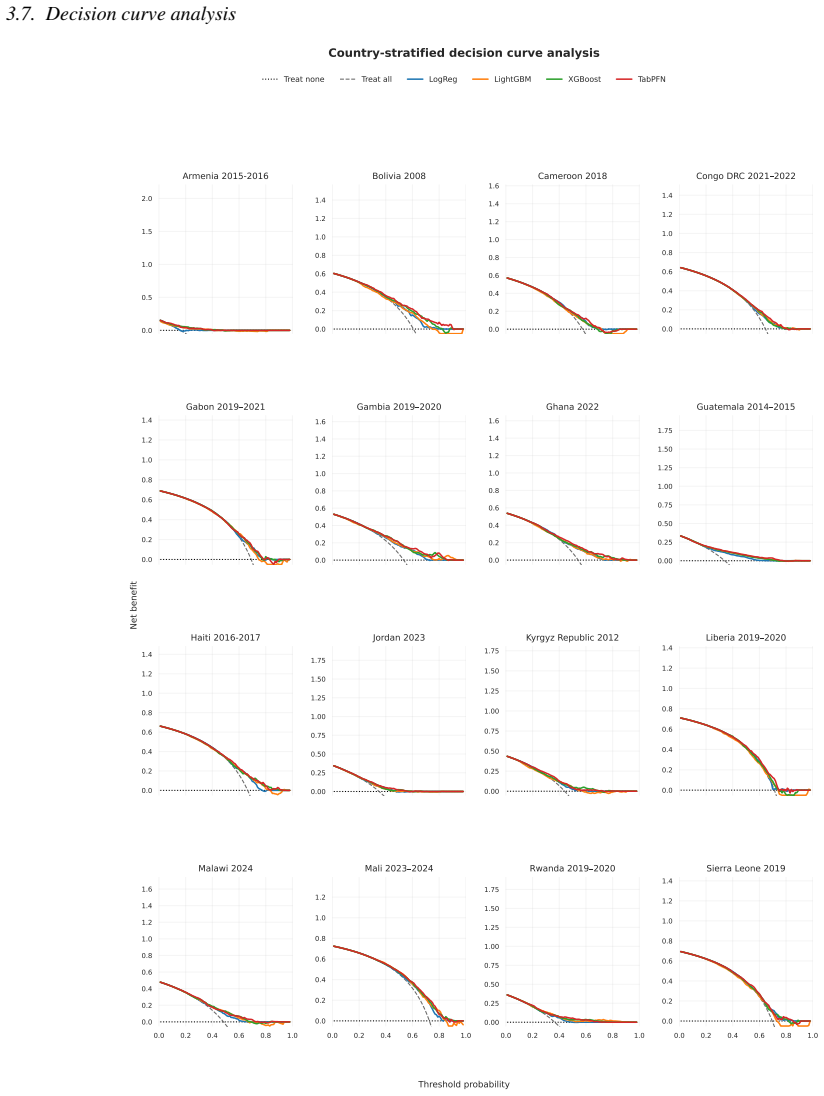
discussion (0)
Sign in with ORCID, Apple, or X to comment. Anyone can read and Pith papers without signing in.