ChartAct: A Benchmark for Dynamic Chart Understanding
Pith reviewed 2026-06-29 18:43 UTC · model grok-4.3
The pith
Existing multimodal models show clear limitations in dynamic chart understanding, with the best reaching 84.5% success on a new interactive benchmark.
A machine-rendered reading of the paper's core claim, the machinery that carries it, and where it could break.
Core claim
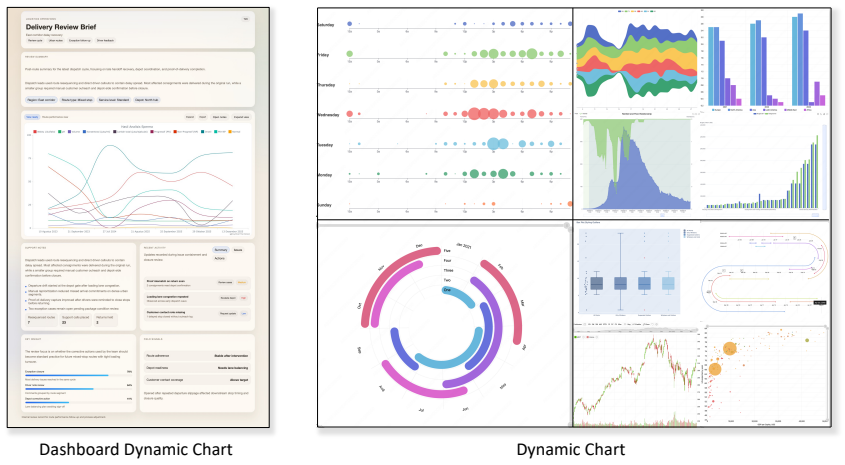
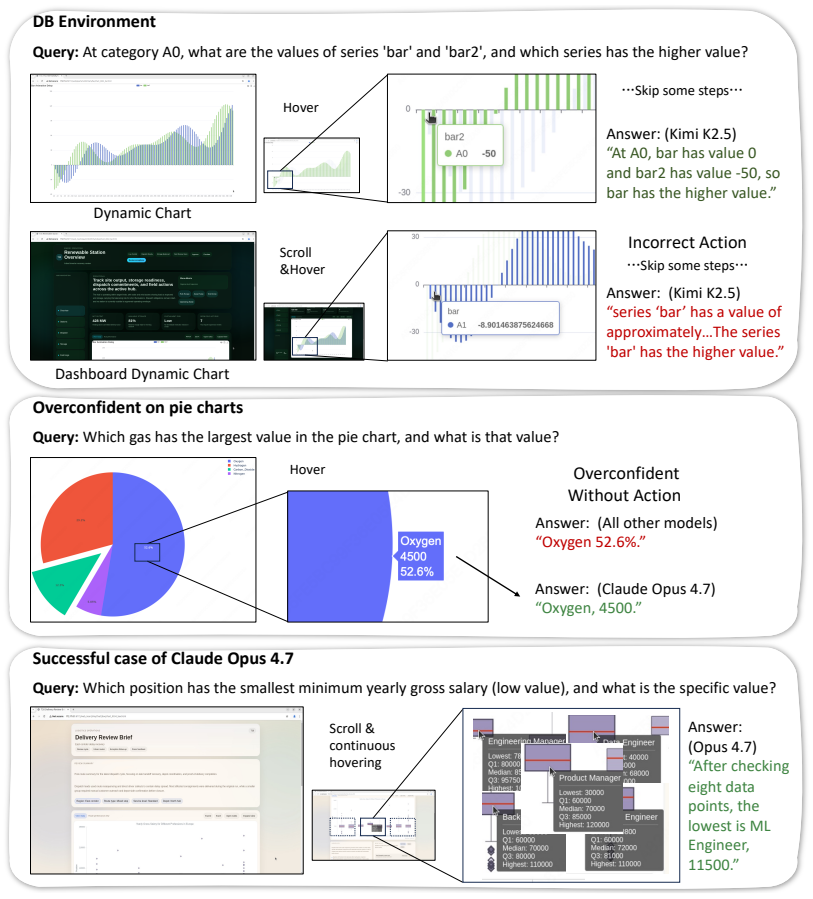
ChartAct collects and filters 673 dynamic charts from 8 real websites covering 7 chart types and constructs 1,440 high-quality question-answer samples, each instantiated in Dynamic Chart and Dashboard Chart environments. Systematic evaluation of 11 advanced multimodal models and GUI agents on this benchmark shows that existing models still have clear limitations in dynamic chart understanding, with the strongest model achieving an average success rate of 84.5% while most models remain below 60%. Detailed failure attribution and case analysis are also provided.
What carries the argument
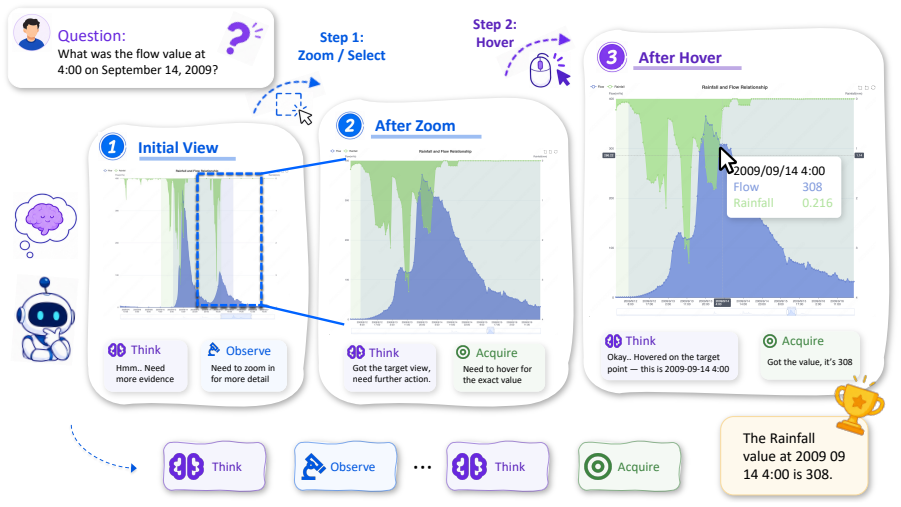
The ChartAct benchmark, which turns real dynamic charts into question-answer pairs that require models to choose and apply interactions to reach changing chart states.
If this is right
- Models must develop stronger mechanisms for detecting needed interactions and tracking state changes in charts.
- Training data for multimodal systems should include more examples of interactive chart manipulation.
- The benchmark enables systematic tracking of progress on dynamic visual reasoning tasks.
- Failure patterns identified can guide targeted improvements in chart-specific reasoning modules.
- Separate evaluation in standalone and dashboard contexts reveals context-dependent performance differences.
Where Pith is reading between the lines
- Success on ChartAct may serve as a proxy for readiness in building automated tools that analyze live business dashboards.
- Adding more interaction types or chart sources could expose additional model weaknesses not visible in the current set.
- Combining the benchmark with reinforcement learning on GUI actions might accelerate development of capable interactive agents.
- The two environments allow direct comparison of performance between isolated charts and integrated dashboard settings.
Load-bearing premise
The 1,440 high-quality question-answer samples from 673 dynamic charts accurately capture the requirements for dynamic chart understanding in real interactive environments.
What would settle it
A model that scores above 95% on ChartAct but fails to correctly interact with and interpret live dynamic charts on the original source websites would indicate the benchmark does not fully represent real requirements.
Figures
read the original abstract
Charts are widely used to present complex data for analysis and decision making. Existing chart understanding benchmarks mainly focus on static charts, but real-world charts are often dynamic and interactive. Key information may only appear after actions such as hovering, clicking, zooming, or dragging. Dynamic chart understanding therefore requires models to identify visible content, choose proper interactions, and reason over changing chart states. To evaluate this ability, we propose ChartAct, an interactive benchmark for dynamic chart understanding. ChartAct collects and filters 673 dynamic charts from 8 real chart websites, covers 7 common chart types, and constructs 1,440 high-quality question-answer samples. Each sample is instantiated in two environments, Dynamic Chart and Dashboard Chart, to evaluate dynamic chart understanding under different contexts. Based on ChartAct, we systematically evaluate 11 advanced multimodal models and GUI agents. Experimental results show that existing models still have clear limitations in dynamic chart understanding. The strongest model, Claude-Opus-4.7, achieves an average success rate of 84.5\%, while most models remain below 60\%. We also conduct detailed failure attribution and case analysis. ChartAct provides a new benchmark for studying chart understanding in real interactive environments. Codes at https://github.com/wulin-wulin/OSWorld_Chart
Editorial analysis
A structured set of objections, weighed in public.
Referee Report
Summary. The paper introduces ChartAct, a benchmark for dynamic chart understanding. It collects and filters 673 dynamic charts from 8 real websites covering 7 chart types, then constructs 1,440 QA samples. Each sample is instantiated in two environments (Dynamic Chart and Dashboard Chart). The authors evaluate 11 multimodal models and GUI agents, reporting that the strongest model (Claude-Opus-4.7) reaches 84.5% average success while most remain below 60%, and provide failure attribution and case analysis. Code is released at the provided GitHub link.
Significance. If the QA samples are shown to require genuine interaction-driven state changes rather than static visual reasoning, ChartAct would address a clear gap between existing static chart benchmarks and real-world interactive use cases. The public code release supports reproducibility and enables follow-up work on multimodal agents. The reported performance gap (best model at 84.5%, majority below 60%) would be a useful empirical signal for model development if the benchmark construction is adequately documented.
major comments (2)
- [Benchmark construction section] § on benchmark construction (methods for chart collection and QA creation): The manuscript states that 1,440 'high-quality' samples were constructed but supplies no concrete details on question validation procedures, filtering criteria, interaction logging protocol, or checks that answers cannot be obtained from static views alone. This information is load-bearing for the central claim that the benchmark measures dynamic chart understanding and that the reported model limitations are meaningful.
- [Evaluation and results section] Evaluation section (results and environments): The two environments (Dynamic Chart and Dashboard Chart) are introduced to test different contexts, yet no quantitative breakdown is given showing how success rates differ between them or how the environments enforce state changes. Without this, it is difficult to assess whether the 84.5% ceiling reflects true dynamic reasoning limits or environment-specific artifacts.
minor comments (2)
- [Abstract / Introduction] The abstract and introduction would benefit from a short table summarizing the 7 chart types, number of charts per type, and number of QA pairs per environment to improve readability.
- [Conclusion / Code availability] The GitHub link is provided, but the manuscript should explicitly state which components (chart collection scripts, QA templates, evaluation harness) are released to allow immediate reproduction.
Simulated Author's Rebuttal
We thank the referee for the constructive comments highlighting areas where additional documentation would strengthen the paper. We address each major comment below and will incorporate the requested details in the revision.
read point-by-point responses
-
Referee: [Benchmark construction section] § on benchmark construction (methods for chart collection and QA creation): The manuscript states that 1,440 'high-quality' samples were constructed but supplies no concrete details on question validation procedures, filtering criteria, interaction logging protocol, or checks that answers cannot be obtained from static views alone. This information is load-bearing for the central claim that the benchmark measures dynamic chart understanding and that the reported model limitations are meaningful.
Authors: We agree that the current manuscript lacks sufficient explicit documentation on these procedures. In the revised version, we will expand the benchmark construction section with a new subsection that details: (1) the multi-stage human validation process for the 1,440 QA pairs (including inter-annotator agreement metrics), (2) the precise filtering criteria applied to the 673 charts (e.g., minimum interaction complexity thresholds), (3) the interaction logging protocol used during collection from the eight websites, and (4) the static-view ablation checks performed to confirm that each question requires at least one state-changing action. These additions will be supported by references to the released code repository. revision: yes
-
Referee: [Evaluation and results section] Evaluation section (results and environments): The two environments (Dynamic Chart and Dashboard Chart) are introduced to test different contexts, yet no quantitative breakdown is given showing how success rates differ between them or how the environments enforce state changes. Without this, it is difficult to assess whether the 84.5% ceiling reflects true dynamic reasoning limits or environment-specific artifacts.
Authors: We acknowledge this gap in the presented results. The revised manuscript will include a new table reporting success rates separately for the Dynamic Chart and Dashboard Chart environments across all 11 models, plus a paragraph explaining the distinct interaction requirements in each environment (e.g., hover/zoom sequences that update tooltips in Dynamic Chart versus multi-panel navigation that alters visible data series in Dashboard Chart). This will demonstrate that the environments enforce different state transitions and allow readers to evaluate whether the 84.5% result is environment-dependent. revision: yes
Circularity Check
No significant circularity detected
full rationale
The paper is an empirical benchmark creation effort with no mathematical derivations, equations, predictions, or fitted parameters. Its central claims rest on data collection (673 charts, 1,440 QA samples) and model evaluations across two environments, which are presented as direct measurements rather than derived results. No steps reduce by construction to inputs, self-citations, or ansatzes; the work is self-contained as a dataset and evaluation protocol.
Axiom & Free-Parameter Ledger
Reference graph
Works this paper leans on
-
[1]
Qwen2.5-vl technical report.Preprint, arXiv:2502.13923. Ritwick Chaudhry, Sumit Shekhar, Utkarsh Gupta, Pranav Maneriker, Prann Bansal, and Ajay Joshi
work page internal anchor Pith review Pith/arXiv arXiv
-
[2]
InternVL: Scaling up Vision Foundation Models and Aligning for Generic Visual-Linguistic Tasks
LEAF-QA: locate, encode & attend for fig- ure question answering. InIEEE Winter Conference on Applications of Computer Vision, WACV 2020, Snowmass Village, CO, USA, March 1-5, 2020, pages 3501–3510. IEEE. Wentong Chen, Junbo Cui, Jinyi Hu, Yujia Qin, Junjie Fang, Yue Zhao, Chongyi Wang, Jun Liu, Guirong Chen, Yupeng Huo, Yuan Yao, Yankai Lin, Zhiyuan Liu,...
work page internal anchor Pith review Pith/arXiv arXiv 2020
-
[3]
InICCV, pages 22145–22156
Chartreader: A unified framework for chart derendering and comprehension without heuristic rules. InICCV, pages 22145–22156. Boyu Gou, Ruohan Wang, Boyuan Zheng, Yanan Xie, Cheng Chang, Yiheng Shu, Huan Sun, and Yu Su
-
[4]
Navigating the digital world as humans do: Universal visual grounding for GUI agents. InThe Thirteenth International Conference on Learning Representations, ICLR 2025, Singapore, April 24- 28, 2025. OpenReview.net. Yucheng Han, Chi Zhang, Xin Chen, Xu Yang, Zhibin Wang, Gang Yu, Bin Fu, and Hanwang Zhang. 2023. Chartllama: A multimodal LLM for chart under...
-
[5]
For every unselected case x, compute L(S∪ {x})
-
[6]
Rank all candidates by this objective value
-
[7]
Sample one case from the top eight candidates with probability proportional to1/r, wherer is the candidate rank
-
[8]
Add the sampled case toS
-
[9]
Answer":
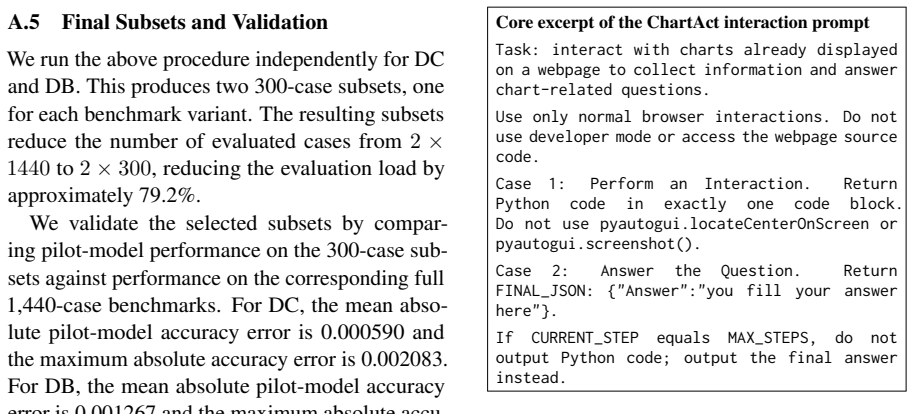
Repeat until|S|= 300. A.4 Local Swap Search The greedy stage constructs a strong initial subset, but greedy selection only optimizes the immediate next addition. A case selected early may become suboptimal after many later additions. To further improve the subset, we apply a local swap search after the greedy subset reaches 300 cases. Let S be the current...
discussion (0)
Sign in with ORCID, Apple, or X to comment. Anyone can read and Pith papers without signing in.