Digging into the Massive Protostar S255IR NIRS3: A Study of Nitrogen-Bearing Molecules and Their Prebiotic Chemistry
Pith reviewed 2026-06-29 17:27 UTC · model grok-4.3
The pith
Abundances of nitrogen-bearing molecules toward S255IR NIRS3 align closely with three-phase warm-up chemical model predictions.
A machine-rendered reading of the paper's core claim, the machinery that carries it, and where it could break.
Core claim
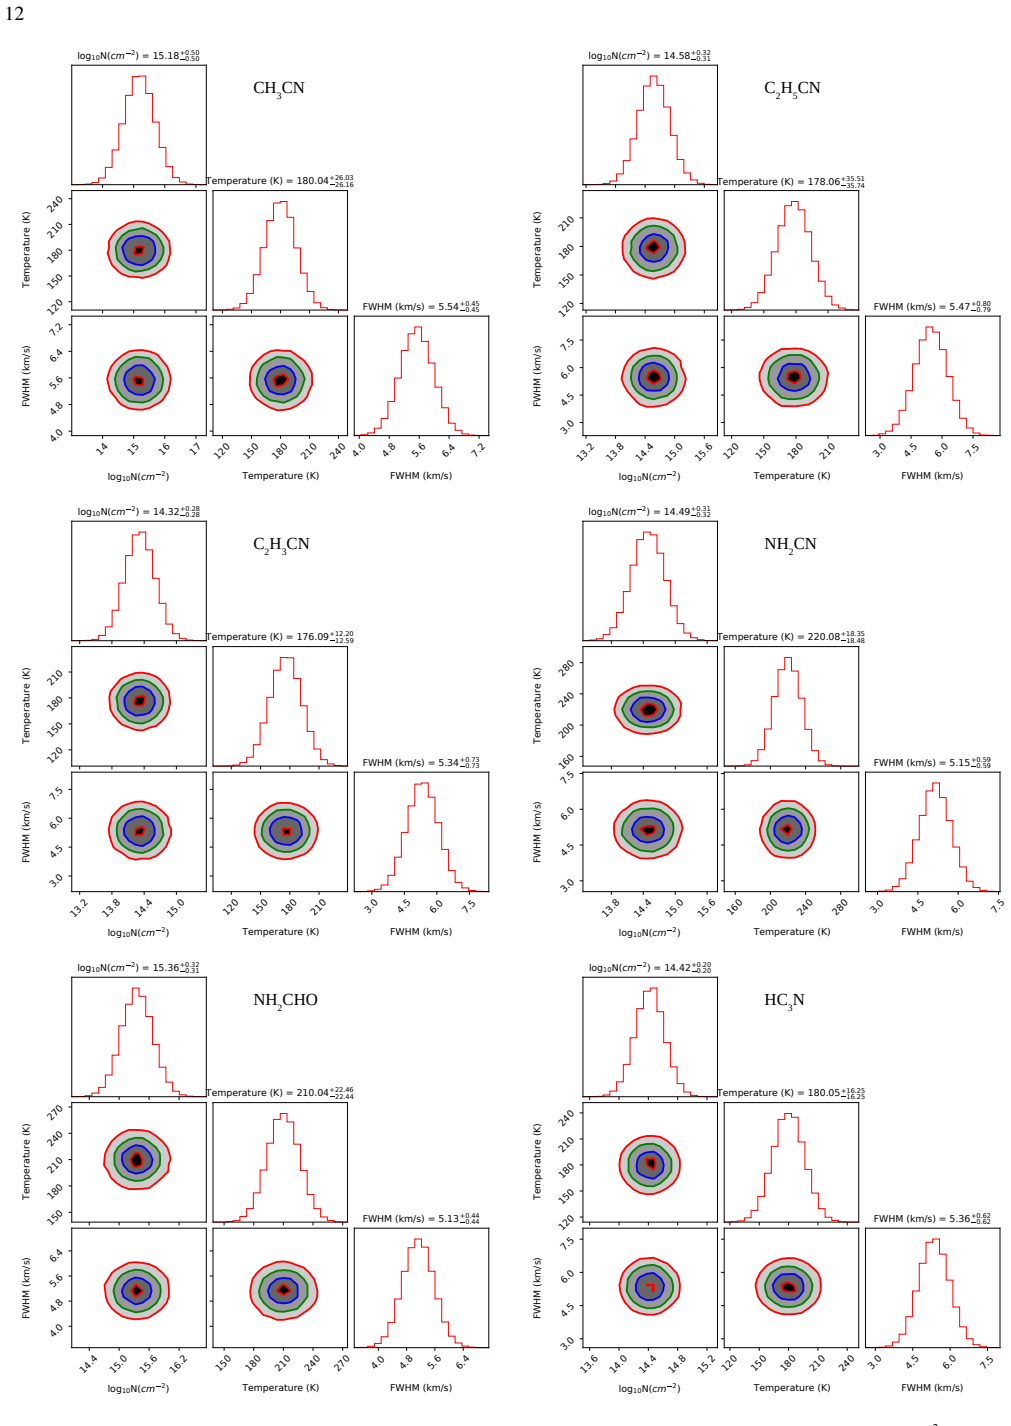
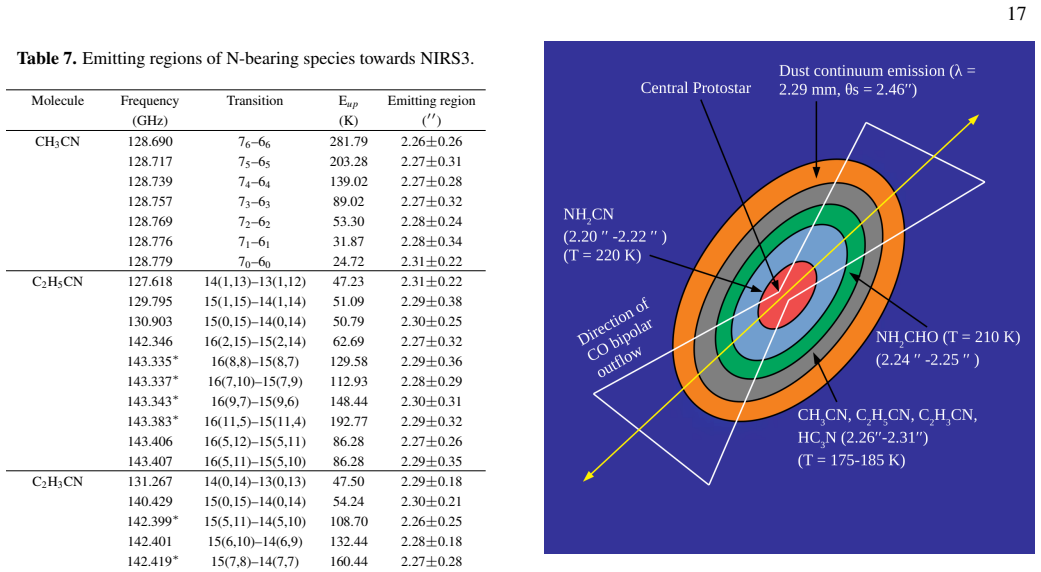
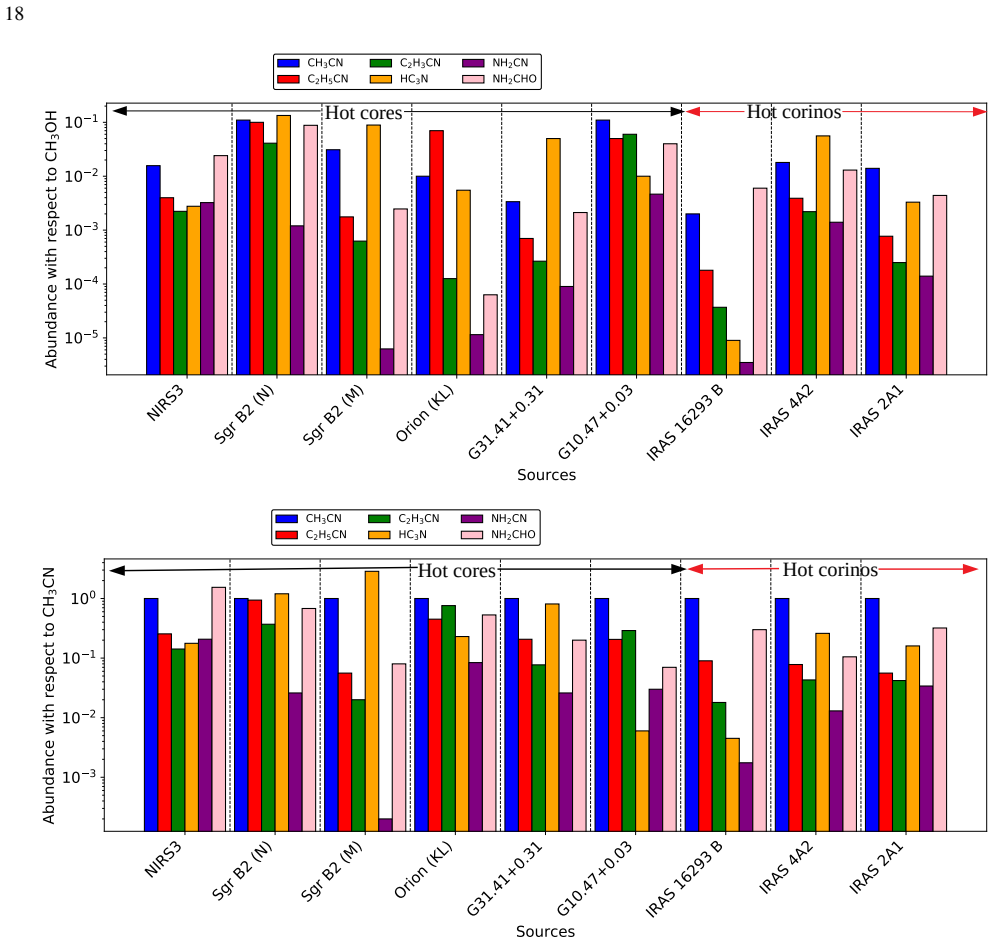
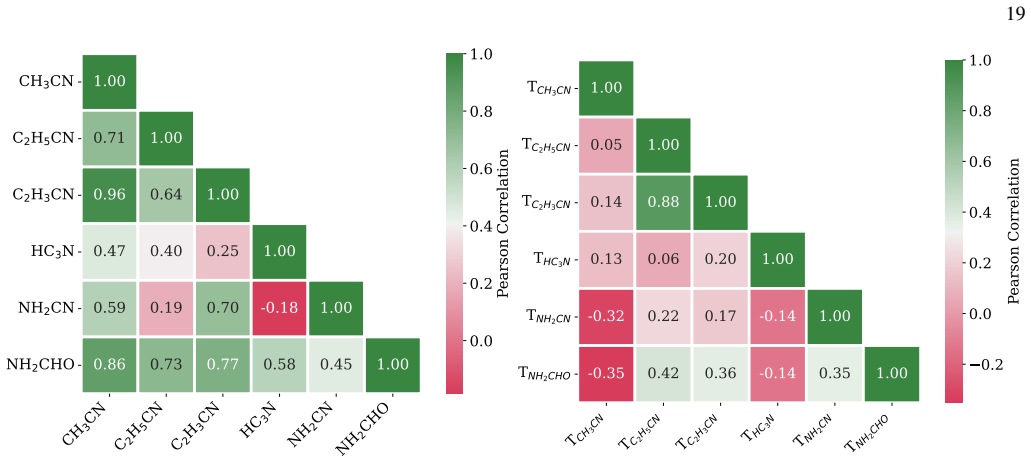
The observed abundances of CH₃CN, C₂H₅CN, C₂H₃CN, NH₂CN, NH₂CHO, and HC₃N (ν₇ = 2) relative to H₂ are consistent with model predictions within factors of 1.04, 0.67, 1.28, 0.76, 0.72, and 0.96, respectively. These molecules are detected via rotational emission lines, with excitation temperatures of 175-220 K pointing to origin in regions where T ≥ 100 K, and the cyanide species show chemical linkage through abundance correlations.
What carries the argument
LTE spectral modelling to extract column densities and excitation temperatures, followed by direct comparison of fractional abundances to three-phase warm-up chemical models.
If this is right
- The r > 0.7 correlation among CH₃CN, C₂H₃CN, and C₂H₅CN indicates these cyanide species share linked formation routes in the gas-grain network.
- Excitation temperatures of 175-220 K confirm the molecules trace the warm inner envelope rather than colder outer material.
- Model agreement supports gas-grain chemistry as the dominant production mechanism for these N-bearing species in high-mass protostellar environments.
- The same modelling and comparison approach can be applied to other massive star-forming regions to test the generality of the chemical networks.
Where Pith is reading between the lines
- If the abundance matches hold across sources, undetected N-bearing species could be predicted from the same models for targeted searches.
- Extending the correlation analysis to other molecular families might identify additional chemical linkages not examined here.
- The results suggest similar prebiotic molecule inventories could appear in lower-mass protostars once comparable warm-up conditions are reached.
Load-bearing premise
That local thermodynamic equilibrium (LTE) spectral modelling yields accurate column densities and excitation temperatures without significant optical-depth or non-LTE corrections for the detected lines.
What would settle it
Non-LTE radiative transfer calculations or higher-resolution spectra that revise the derived column densities by more than a factor of two, breaking the reported agreement with model predictions.
Figures
read the original abstract
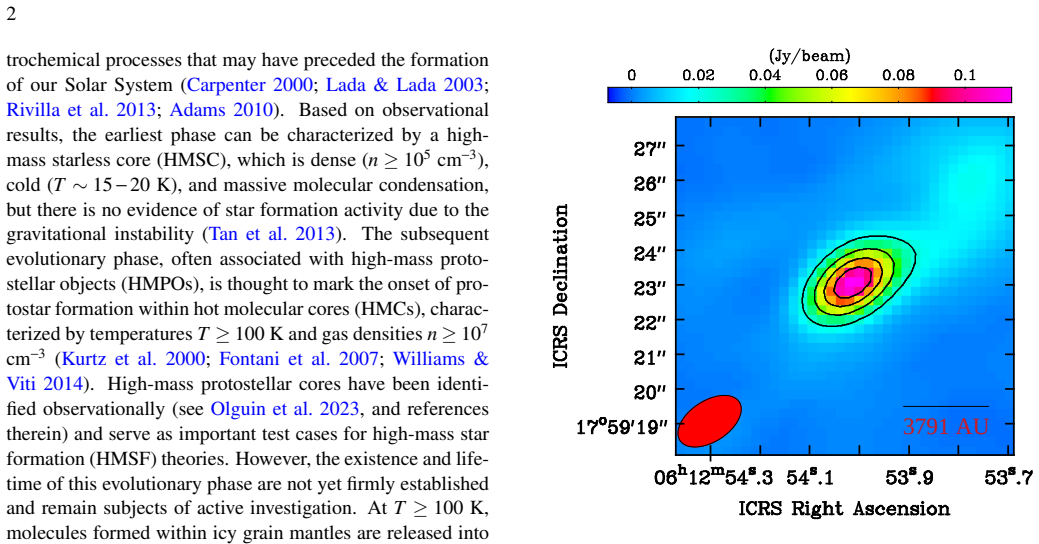
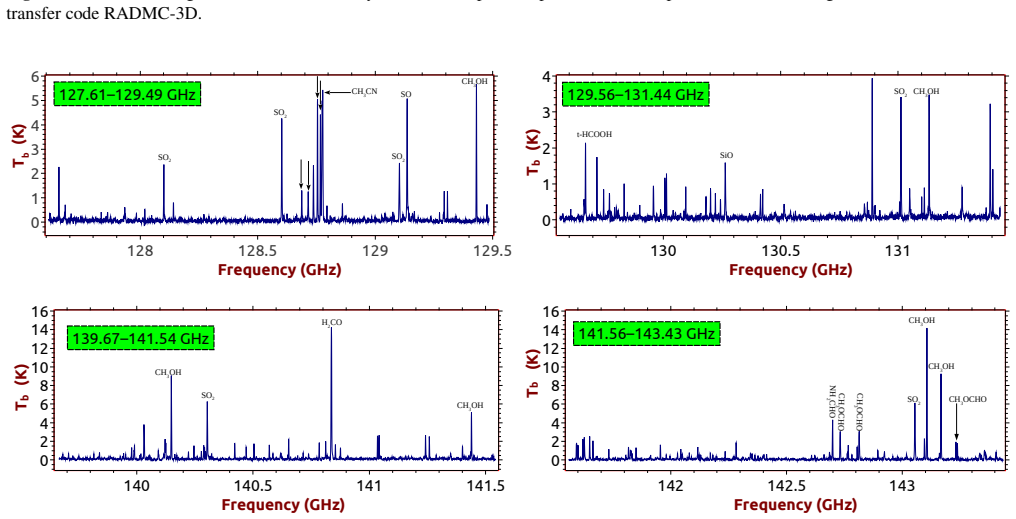
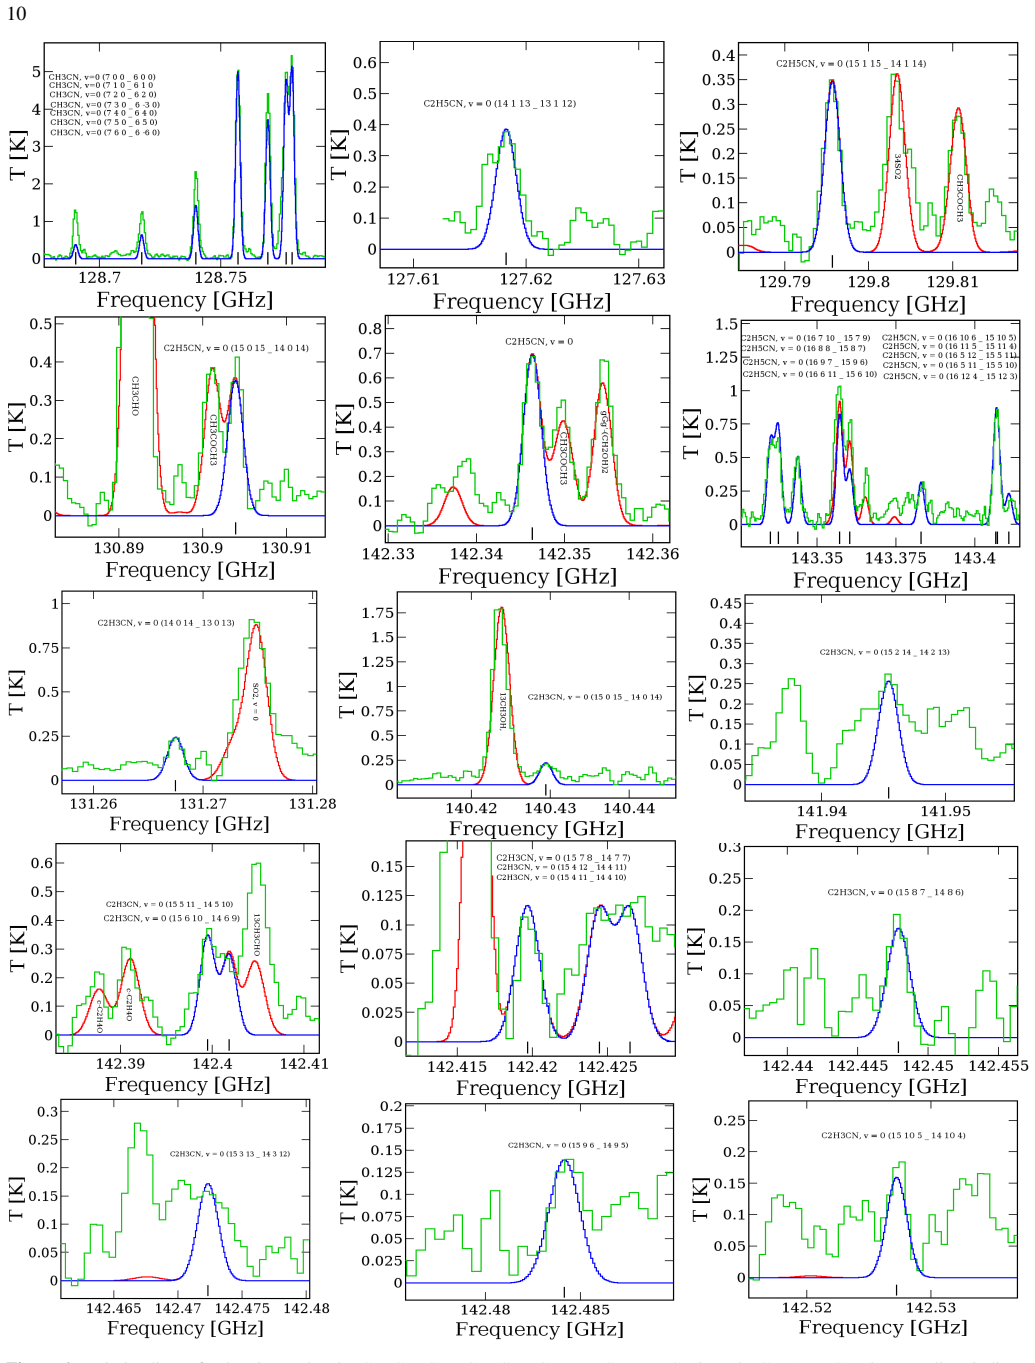
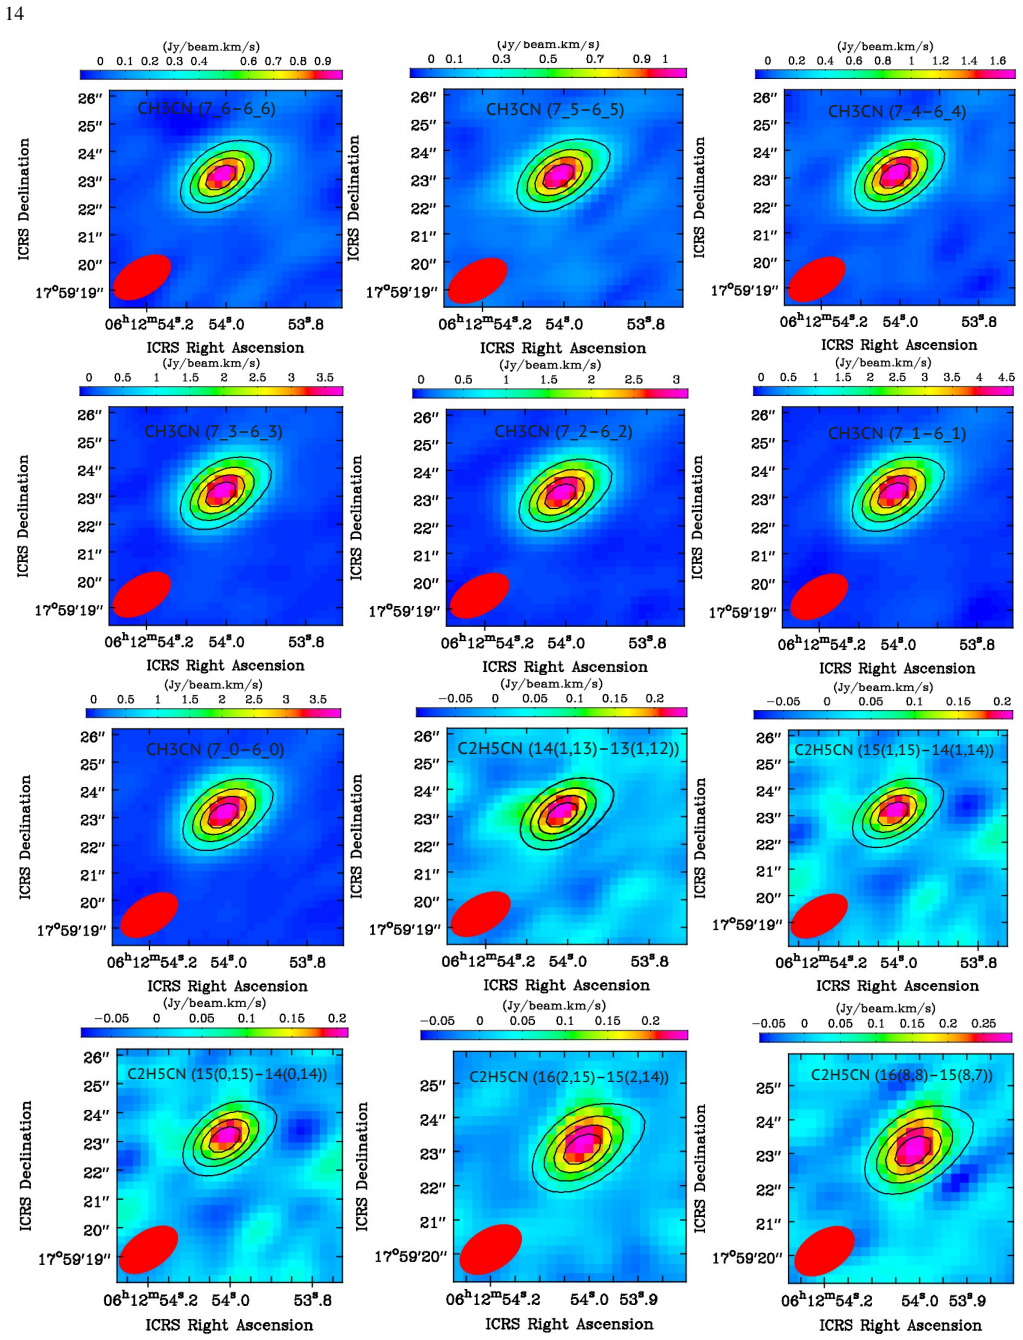
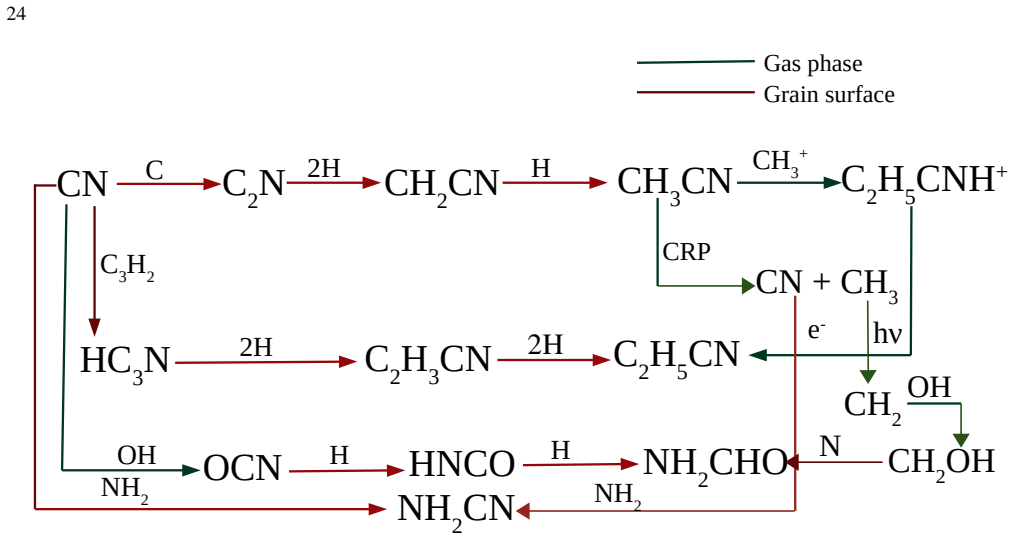
The study of complex nitrogen (N)-bearing molecules is essential for probing the physical and chemical evolution of star-forming regions. In this paper, we present the identification of rotational emission lines from several complex N-bearing species such as methyl cyanide (CH$_{3}$CN), ethyl cyanide (C$_{2}$H$_{5}$CN), vinyl cyanide (C$_{2}$H$_{3}$CN), cyanamide (NH$_{2}$CN), and formamide (NH$_{2}$CHO) toward the high-mass protostar S255IR NIRS3 using ALMA band 4 observations. In addition, the vibrationally excited transitions of cyanoacetylene (HC$_{3}$N, $\nu_{7}$ = 2) were detected. The column densities and excitation temperatures of these molecules were derived through LTE spectral modelling, yielding excitation temperatures in the range of 175$-$220 K. The high excitation temperatures (175$-$220 K) indicate that the identified N-bearing molecules arise from the warm inner regions ($T \geq 100$ K) of the source. The fractional abundances were further estimated relative to H$_{2}$, CH$_{3}$OH, and CH$_{3}$CN. A Pearson correlation heat map of the abundances reveals a strong positive correlation ($r > 0.7$) among three molecules in the cyanide family, such as CH$_{3}$CN, C$_{2}$H$_{3}$CN, and C$_{2}$H$_{5}$CN, suggesting that these N-bearing molecules may be chemically linked. Comparison with three-phase warm-up chemical models shows that the observed abundances of CH$_{3}$CN, C$_{2}$H$_{5}$CN, C$_{2}$H$_{3}$CN, NH$_{2}$CN, NH$_{2}$CHO, and HC$_{3}$N ($\nu_{7}$ = 2) relative to H$_{2}$ are consistent with model predictions within factors of 1.04, 0.67, 1.28, 0.76, 0.72, and 0.96, respectively. Finally, we discuss the potential formation pathways of the identified N-bearing molecules in the context of gas-grain chemistry within S255IR NIRS3.
Editorial analysis
A structured set of objections, weighed in public.
Referee Report
Summary. The manuscript reports ALMA Band 4 observations toward the high-mass protostar S255IR NIRS3, identifying rotational lines of CH₃CN, C₂H₅CN, C₂H₃CN, NH₂CN, NH₂CHO, and vibrationally excited HC₃N (ν₇=2). LTE spectral modeling yields excitation temperatures of 175–220 K and column densities that are converted to fractional abundances relative to H₂. These abundances are stated to match three-phase warm-up chemical model predictions within factors of 1.04, 0.67, 1.28, 0.76, 0.72, and 0.96, respectively. A Pearson correlation analysis shows strong positive correlations (r > 0.7) among the cyanide-family species, and the paper discusses possible gas-grain formation routes.
Significance. If the column densities are robust, the work supplies new observational constraints on nitrogen chemistry in a high-mass hot core and demonstrates quantitative consistency with published warm-up models for six species. The reported correlation among cyanides and the prebiotic context add value for chemical network validation.
major comments (2)
- [LTE spectral modelling section (implied by abstract and modelling description)] The central claim of model agreement (factors 0.67–1.28) rests entirely on column densities obtained from LTE modeling. The manuscript provides no quantitative optical-depth assessment (e.g., τ derived from line ratios, hyperfine intensity ratios, or isotopologue comparisons) for the detected transitions, particularly the stronger CH₃CN K-ladder lines that are known to reach τ ≳ 1 in similar sources at T ≈ 200 K and n(H₂) > 10⁷ cm⁻³. Without such checks, the derived N_col values—and therefore the abundance ratios fed to the model comparison—may be systematically underestimated.
- [LTE spectral modelling section] No non-LTE test (RADEX, LVG, or similar) is reported despite the high densities and temperatures involved. If even a subset of the lines used for the six species are moderately optically thick or depart from LTE, the claimed consistency with the three-phase models would no longer be diagnostic at the stated precision.
minor comments (2)
- [Abstract and results section] The abstract states that abundances are also given relative to CH₃OH and CH₃CN, but the model comparison is performed only relative to H₂; clarify whether the additional reference abundances are used quantitatively or only for qualitative discussion.
- [Results section] The Pearson correlation heat map is mentioned but the exact number of species and the statistical significance of r > 0.7 are not quantified in the provided text; add the correlation matrix or p-values for transparency.
Simulated Author's Rebuttal
We thank the referee for the constructive comments on our manuscript. The concerns regarding the robustness of the LTE-derived column densities are well taken, and we address them point by point below. We will revise the manuscript accordingly.
read point-by-point responses
-
Referee: The central claim of model agreement (factors 0.67–1.28) rests entirely on column densities obtained from LTE modeling. The manuscript provides no quantitative optical-depth assessment (e.g., τ derived from line ratios, hyperfine intensity ratios, or isotopologue comparisons) for the detected transitions, particularly the stronger CH₃CN K-ladder lines that are known to reach τ ≳ 1 in similar sources at T ≈ 200 K and n(H₂) > 10⁷ cm⁻³. Without such checks, the derived N_col values—and therefore the abundance ratios fed to the model comparison—may be systematically underestimated.
Authors: We acknowledge that the submitted manuscript did not contain an explicit optical-depth analysis. In the revised version we will add quantitative estimates of τ for the principal transitions of each species, using the derived excitation temperatures and column densities together with available isotopologue lines (where detected) and line-ratio checks for CH₃CN. If any lines prove moderately optically thick we will apply the appropriate corrections before re-comparing with the chemical models. revision: yes
-
Referee: No non-LTE test (RADEX, LVG, or similar) is reported despite the high densities and temperatures involved. If even a subset of the lines used for the six species are moderately optically thick or depart from LTE, the claimed consistency with the three-phase models would no longer be diagnostic at the stated precision.
Authors: We agree that an explicit non-LTE verification strengthens the analysis. Although the high densities (>10⁷ cm⁻³) in the hot core support the LTE assumption, we will include RADEX calculations for representative transitions of CH₃CN, C₂H₅CN and NH₂CHO in the revised manuscript to confirm that departures from LTE are negligible at the derived temperatures and densities. revision: yes
Circularity Check
No significant circularity; abundances compared to independent external chemical models
full rationale
The derivation proceeds as: (1) LTE spectral modelling of ALMA Band 4 lines yields column densities and Tex (175-220 K) for CH3CN, C2H5CN, etc.; (2) fractional abundances relative to H2 are computed from those columns; (3) the resulting numbers are compared post-hoc to published three-phase warm-up chemical model outputs, producing agreement factors 1.04, 0.67, 1.28, 0.76, 0.72, 0.96. No equation or step reduces the model predictions to the observed columns by construction, no parameters are fitted to force agreement, and the models are external literature results rather than self-citations or ansatzes imported from the authors' prior work. The LTE assumption is an input to step (1) but does not create a definitional loop with the model comparison. The Pearson correlation among cyanide-family abundances is likewise computed directly from the derived columns and is not presented as a prediction. This is a standard observational comparison against external benchmarks; the central claim therefore retains independent content.
Axiom & Free-Parameter Ledger
free parameters (2)
- Excitation temperature
- Column density
axioms (1)
- domain assumption Local thermodynamic equilibrium applies to the emitting gas
Reference graph
Works this paper leans on
-
[1]
thebibliography [1] 20pt to References -5pt =0pt \@twocolumntrue 12pt -12pt 10pt plus 3pt =0pt =0pt =1pt plus 1pt =0pt =0pt -12pt =10pt plus 1pt =20pt =10pt plus 1pt \@M =10000 =-1.0em =0pt =0pt 0pt =0pt =1.0em @enumiv\@empty 10000 10000 `\.\@m \@noitemerr \@latex@warning Empty `thebibliography' environment \@ifnextchar \@reference \@latexerr Missing key ...
-
[2]
Adams, F. C. 2010, ARA&A https://doi.org/10.1146/annurev-astro-081309-130830, 48, 47
-
[3]
Astropy Collaboration, 2022, ApJ https://iopscience.iop.org/article/10.3847/1538-4357/ac7c74, 935, 167
work page internal anchor Pith review doi:10.3847/1538-4357/ac7c74 2022
-
[4]
Ag \'u ndez, M., Fonfr \' a, J. P., Cernicharo, J., Pardo, J. R., & Gu \'e lin, M. 2008, A&A https://doi.org/10.1051/0004-6361:20078956, 479, 493
-
[5]
2010, A&A https://doi.org/10.1051/0004-6361/201015186, 517, L2
Ag \'u ndez, M., Cernicharo, J., Gu \'e lin, M., et al. 2010, A&A https://doi.org/10.1051/0004-6361/201015186, 517, L2
-
[6]
2015, A&A https://doi.org/10.1051/0004-6361/201526650, 579, L10
Ag \'u ndez, M., Cernicharo, J., de Vicente, P., et al. 2015, A&A https://doi.org/10.1051/0004-6361/201526650, 579, L10
-
[7]
A., 2019, ARA&A https://doi.org/10.1146/annurev-astro-091918-104409, 57, 113
Altwegg, K., Balsiger, H., Fuselier, S. A., 2019, ARA&A https://doi.org/10.1146/annurev-astro-091918-104409, 57, 113
-
[8]
A new look at the statistical model identification
Akaike H., 1974, ITAC, 19, 716. doi:10.1109/TAC.1974.1100705
-
[9]
Bonfand, M., Belloche, A., Garrod, R. T., et al. 2019, A&A https://doi.org/10.1051/0004-6361/201935523, 628, A27
-
[10]
M., 2022, A&A https://doi.org/10.1051/0004-6361/202140519, 662, A32
Bouscasse L., Csengeri T., Belloche A., Wyrowski F., Bontemps S., G \"u sten R., Menten K. M., 2022, A&A https://doi.org/10.1051/0004-6361/202140519, 662, A32
-
[11]
Balucani, N. 2009, Int. J. Mol. Sci. https://doi.org/10.3390/ijms10052304, 10, 2304
-
[12]
Belloche, A., et al., 2020, A&A https://doi.org/10.1051/0004-6361/201937352, 635, A198
-
[13]
Belloche, A., M \"u ller , H. S. P., Garrod , R. T. Menten , K. M., 2016, A&A https://doi.org/10.1051/0004-6361/201527268, 587, A91
-
[14]
Belloche, A., M \"u ller, H. S. P., Menten, K. M., Schilke, P., Comito, C., 2013, A&A https://doi.org/10.1051/0004-6361/201321096, 559, A47
-
[15]
Bianchi, E., et al., 2022, A&A https://doi.org/10.1051/0004-6361/202141893, 662, A103
-
[16]
et al., 2023, ApJ https://iopscience.iop.org/article/10.3847/1538-4357/acb5e8/meta, 944, 208
Bianchi, E. et al., 2023, ApJ https://iopscience.iop.org/article/10.3847/1538-4357/acb5e8/meta, 944, 208
-
[17]
2014, A&A https://doi.org/10.1051/0004-6361/201423890, 566, L5
Biver, N., Bockel \'e e-Morvan, D., Debout, V., et al. 2014, A&A https://doi.org/10.1051/0004-6361/201423890, 566, L5
-
[18]
2022, A&A https://doi.org/10.1051/0004-6361/202244970, 668, A171
Biver, N., Boissier, J., Bockel \'e e-Morvan D., et al. 2022, A&A https://doi.org/10.1051/0004-6361/202244970, 668, A171
-
[19]
Bottinelli, S., et al., 2004, ApJ https://iopscience.iop.org/article/10.1086/423952/meta, 615, 354
-
[20]
Burns, R. A., Handa, T., Nagayama, T., Sunada, K., & Omodaka, T., 2016, MNRAS https://doi.org/10.1093/mnras/stw958, 460, 283
-
[21]
Baek, G., Lee, J. -E., Evans, N. J., et al., 2023, ApJL https://iopscience.iop.org/article/10.3847/2041-8213/acef1d, 954, L25
-
[22]
A., Cernicharo, J., Viti, S., Marcelino, N., Palau, A., Esplugues, G
Bell, T. A., Cernicharo, J., Viti, S., Marcelino, N., Palau, A., Esplugues, G. B., Tercero, B., 2014, A&A https://doi.org/10.1051/0004-6361/201321872, 564, A114
-
[23]
S., Pearson, J
Brauer, C. S., Pearson, J. C., Drouin, B. J., Yu, S., 2009, ApJS https://ui.adsabs.harvard.edu/abs/2009ApJS..184..133B/abstract, 184, 133
2009
-
[24]
Burnham K. P., Anderson D. R., 2004, Sociol. Methods Res. https://journals.sagepub.com/doi/10.1177/0049124104268644, 33, 261
-
[25]
Calcutt, H., J rgensen, J. K., M \"u ller, H. S. P. et al., 2018, A&A https://doi.org/10.1051/0004-6361/201732289, 616, A90
-
[26]
J., Chandler C
Cacciapuoti L., Macias E., Maury A. J., Chandler C. J., Sakai N., Tychoniec ., Viti S., et al., 2023, https://ui.adsabs.harvard.edu/abs/2023A\
2023
-
[27]
Carpenter, J. M. 2000, AJ https://iopscience.iop.org/article/10.1086/316845/meta, 120, 3139
-
[28]
Ceccarelli, C., et al., 2017, ApJ https://iopscience.iop.org/article/10.3847/1538-4357/aa961d/meta, 850, 176
-
[29]
Cesaroni, R., Moscadelli, L., Neri, R., Sanna, A., Caratti o Garatti, A., Eisloffel, J., Stecklum, B., et al., 2018, https://ui.adsabs.harvard.edu/abs/2018A\
2018
-
[30]
2008, ApJ https://iopscience.iop.org/article/10.1086/595583/meta, 688, L83
Cernicharo, J., Gu \'e lin, M., Ag \'u ndez, M., et al. 2008, ApJ https://iopscience.iop.org/article/10.1086/595583/meta, 688, L83
-
[31]
2013, ApJL https://iopscience.iop.org/article/10.1088/2041-8205/771/1/L10/meta, 771, L10
Cernicharo, J., Tercero, B., Fuente, A., et al. 2013, ApJL https://iopscience.iop.org/article/10.1088/2041-8205/771/1/L10/meta, 771, L10
-
[32]
Coletta, A., Fontani, F., Rivilla, V. M., et al. 2020, A&A https://doi.org/10.1051/0004-6361/202038212, 641, A54
-
[33]
Colzi, L., Rivilla, V. M., Beltr \'a n, M. T., et al. 2021, A&A https://doi.org/10.1051/0004-6361/202141573, 653, A129
-
[34]
Cordiner, M. A., Palmer, M. Y., Nixon, C. A., et al. 2015, ApJL https://iopscience.iop.org/article/10.1088/2041-8205/800/1/L14/meta, 800, L14
-
[35]
Coutens, A., Willis, E. R., Garrod, R. T., et al. 2018, A&A https://doi.org/10.1051/0004-6361/201732346, 612, A107
-
[36]
Cox, A. N., & Pilachowski, C. A. 2000, Physics Today https://doi.org/10.1063/1.1325201, 53, 77
-
[37]
P., Juhasz, A., Pohl, A., et al
Dullemond, C. P., Juhasz, A., Pohl, A., et al. 2012, RADMC-3D: A multi-purpose radiative transfer tool. Astrophysics Source Code Library, record ascl:1202.015 https://ui.adsabs.harvard.edu/abs/2012ascl.soft02015D/abstract
2012
-
[38]
Duan, H. Y., Lai, S. P., Hirano, N., & Thieme, T. J. 2023, ApJ https://iopscience.iop.org/article/10.3847/1538-4357/acb531, 947(2), 48
-
[39]
Enrique-Romero, J., Rimola, A., Ceccarelli, C., et al. 2019, ACS Earth Space Chem. https://doi.org/10.1021/acsearthspacechem.9b00156, 3, 2158
-
[40]
Enrique-Romero, J., Ceccarelli, C., Rimola, A., et al., 2021, A&A https://doi.org/10.1051/0004-6361/202141531, 655, A9
-
[41]
2022, ApJs https://iopscience.iop.org/article/10.3847/1538-4365/ac480e/meta, 259, 39
Enrique-Romero, J., Rimola, A., Ceccarelli, C., et al. 2022, ApJs https://iopscience.iop.org/article/10.3847/1538-4365/ac480e/meta, 259, 39
-
[42]
2007, A&A https://doi.org/10.1051/0004-6361:20077485, 470, 639
Fontani, F., Pascucci, I., Caselli, P., et al. 2007, A&A https://doi.org/10.1051/0004-6361:20077485, 470, 639
-
[43]
Friedel, D. N., & Widicus Weaver, S. L. 2012, ApJS https://iopscience.iop.org/article/10.1088/0067-0049/201/2/17/meta, 201, 17
-
[44]
N., Snyder, L
Friedel, D. N., Snyder, L. E., 2008, ApJ https://ui.adsabs.harvard.edu/abs/2008ApJ...672..962F/exportcitation, 672, 962
2008
-
[45]
1997, ApJ https://iopscience.iop.org/article/10.1086/304782/meta, 489, 113
Fukuzawa, K., & Osamura, Y. 1997, ApJ https://iopscience.iop.org/article/10.1086/304782/meta, 489, 113
-
[46]
2016, The Journal of Open Source Software https://joss.theoj.org/papers/10.21105/joss.00024, 1, 24
Foreman-Mackey, D. 2016, The Journal of Open Source Software https://joss.theoj.org/papers/10.21105/joss.00024, 1, 24
-
[47]
Gardner, F. F. & Winnewisser, G. 1975, ApJ https://adsabs.harvard.edu/full/1975ApJ...195L.127G, 195, L127
1975
-
[48]
Garrod, R. T. 2013, ApJ https://iopscience.iop.org/article/10.1088/0004-637X/765/1/60/meta, 765, 60
-
[49]
Garrod, R. T., Jin, M., Matis, K. A., et al. 2022, ApJs https://iopscience.iop.org/article/10.3847/1538-4365/ac3131/meta, 259, 1
-
[50]
Garrod, R. T., Belloche, A., Müller, H. S. P., Menten, K. M. 2017, A&A https://doi.org/10.1051/0004-6361/201630254, 601, A48
-
[51]
T., Herbst E., 2006, A&A, 457, 927
Garrod R. T., Herbst E., 2006, A&A, 457, 927
2006
-
[52]
Goesmann, F., Rosenbauer, H., Bredeh\"oft, J. H., et al. 2015, Science https://doi.org/10.1126/science.aab0689, 349, 020689
-
[53]
Goldman, N., Reed, E. J., Fried, L. E., William Kuo, I. F., & Maiti, A. 2010, Nature Chem. https://doi.org/10.1038/nchem.827, 2, 949
-
[54]
2023, MNRAS https://doi.org/10.1093/mnras/stad2892, 526, 4535
Giani, L., Ceccarelli, C., Mancini, L., et al. 2023, MNRAS https://doi.org/10.1093/mnras/stad2892, 526, 4535
-
[55]
Hern \'a ndez-Hern \'a ndez, V., Zapata, L., Kurtz, S., Garay, G., 2014, ApJ https://ui.adsabs.harvard.edu/abs/2014ApJ...786...38H/abstract, 786, 38
2014
-
[56]
K., Juvela, M., Tej, A., Goldsmith, P
Hoque, A., Baug, T., Dewangan, L. K., Juvela, M., Tej, A., Goldsmith, P. F., Garc \' a, P., et al., 2025, ApJ https://ui.adsabs.harvard.edu/abs/2025ApJ...987..197H/abstract, 987, 197
2025
-
[57]
Hassel, G. E., Herbst, E., Garrod, R. T. 2008, ApJ https://iopscience.iop.org/article/10.1086/588185/meta, 681, 1385
-
[58]
Halfen, D. T., Ilyushin, V., Ziurys, L. M., 2011, ApJ https://iopscience.iop.org/article/10.1088/0004-637X/743/1/60/meta, 743, 60
-
[59]
Heise, H.M., Lutz, H., Dreizler, H., 1974, Z. Naturforsch. A https://doi.org/10.1515/zna-1974-0916, 29a, 1345
-
[60]
Herbst, E., & van Dishoeck, E. F. 2009, ARA&A https://doi.org/10.1146/annurev-astro-082708-101654, 47, 427
-
[61]
Hsieh T.-H., et al., 2023, A&A https://doi.org/10.1051/0004-6361/202244183, 669, A137
-
[62]
2021, A&A https://doi.org/10.1051/0004-6361/202039798, 647, A23
Hirota, T., Cesaroni, R., Moscadelli, L., et al. 2021, A&A https://doi.org/10.1051/0004-6361/202039798, 647, A23
-
[63]
V., Alekseev, E
Ilyushin, V. V., Alekseev, E. A., Dyubko, S. F., Motiyenko, R. A., Hougen, J. T., 2005, JMoSp https://ui.adsabs.harvard.edu/abs/2005JMoSp.229..170I/abstract, 229, 170
2005
-
[64]
Iino, T., Sagawa, H., Tsukagoshi, T., 2020, ApJ https://iopscience.iop.org/article/10.3847/1538-4357/ab66b0, 890, 95
-
[65]
D., et al., 2021, ApJs https://iopscience.iop.org/article/10.3847/1538-4365/ac1441/meta, 257, 9
Ilee J. D., et al., 2021, ApJs https://iopscience.iop.org/article/10.3847/1538-4365/ac1441/meta, 257, 9
-
[66]
Irvine, W. M. & Schloerb, F. 1984, ApJ https://adsabs.harvard.edu/full/record/seri/ApJ../0282/1984ApJ...282..516I.html, 282, 516
1984
-
[67]
Jacobsen, S. K., J rgensen, J. K., van der Wiel, M. H. D., et al. 2018, A&A https://doi.org/10.1051/0004-6361/201731668, 612, A72
-
[68]
2017, A&A https://doi.org/10.1051/0004-6361/201629506, 597, A40
Jaber Al-Edhari, A., Ceccarelli, C., Kahane, C., et al. 2017, A&A https://doi.org/10.1051/0004-6361/201629506, 597, A40
-
[69]
R., Lovas, F
Johnson, D. R., Lovas, F. J., Gottlieb, C. A., et al. 1977, ApJ https://adsabs.harvard.edu/full/1977ApJ...218..370J, 218, 370
1977
-
[70]
J rgensen, J. K., Belloche, A., Garrod, R. T., 2020, ARA&A https://doi.org/10.1146/annurev-astro-032620-021927, 58, 727
-
[71]
1992, ApJ https://adsabs.harvard.edu/full/record/seri/ApJ../0386/1992ApJ...386L..51K.html, 386, L51
Kawaguchi, K., Ohishi, M., Ishikawa, S.-I., & Kaifu, N. 1992, ApJ https://adsabs.harvard.edu/full/record/seri/ApJ../0386/1992ApJ...386L..51K.html, 386, L51
1992
-
[72]
1994, ApJ https://adsabs.harvard.edu/full/1994ApJ...420L..95K, 420, L95
Kawaguchi, K., Kasai, Y., Ishikawa, S.-I., et al. 1994, ApJ https://adsabs.harvard.edu/full/1994ApJ...420L..95K, 420, L95
1994
-
[73]
Kurtz, S., Cesaroni, R., Churchwell, E., Hofner, P., & Walmsley, C. M. 2000, in Protostars and Planets IV https://ui.adsabs.harvard.edu/abs/2000prpl.conf..299K/abstract, eds. V. Mannings, A. P. Boss, & S. S. Russell (Tucson: University of Arizona Press), 299
2000
-
[74]
G., Nelson, A
Kukolich, S. G., Nelson, A. C., 1971, CPL https://ui.adsabs.harvard.edu/abs/1971CPL....11..383K/abstract, 11, 383
1971
-
[75]
H., Johnson, D
Kirchhoff, W. H., Johnson, D. R., Lovas, F. J., 1973, JPCRD https://ui.adsabs.harvard.edu/abs/1973JPCRD...2....1K/abstract, 2, 1
1973
-
[76]
Disentangling the independently controllable factors of variation by interacting with the world
Lada, C. J., & Lada, E. A. 2003, ARA&A https://doi.org/10.1146/annurev.astro.41.011802.094844, 41, 57
work page internal anchor Pith review Pith/arXiv arXiv doi:10.1146/annurev.astro.41.011802.094844 2003
-
[77]
Ligterink, N. F. W., Calcutt, H., Coutens, A., et al. 2018, A&A https://doi.org/10.1051/0004-6361/201731980, 619, A28
-
[78]
Ligterink, N. F. W., El-Abd, S. J., Brogan, C. L., et al. 2020, ApJ https://iopscience.iop.org/article/10.3847/1538-4357/abad38/meta, 901, 37
-
[79]
2020, ApJ https://iopscience.iop.org/article/10.3847/1538-4357/abc0ec/meta, 904, 181
Liu, S.-Y., Su, Y.-N., Zinchenko, I., et al. 2020, ApJ https://iopscience.iop.org/article/10.3847/1538-4357/abc0ec/meta, 904, 181
-
[80]
et al., 2014, A&A https://doi.org/10.1051/0004-6361/201423622, 572, A44
L \'o pez, A., Tercero, B., Kisiel, Z. et al., 2014, A&A https://doi.org/10.1051/0004-6361/201423622, 572, A44
discussion (0)
Sign in with ORCID, Apple, or X to comment. Anyone can read and Pith papers without signing in.