Chartographer: Counterfactual Chart Generation for Evaluating Vision-Language Models
Pith reviewed 2026-06-29 17:42 UTC · model grok-4.3
The pith
Counterfactual charts show vision-language models often fail to generalize after correctly answering the original chart.
A machine-rendered reading of the paper's core claim, the machinery that carries it, and where it could break.
Core claim
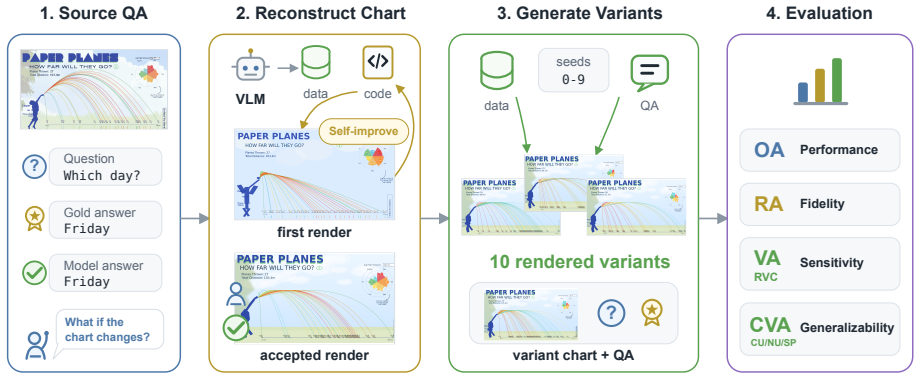
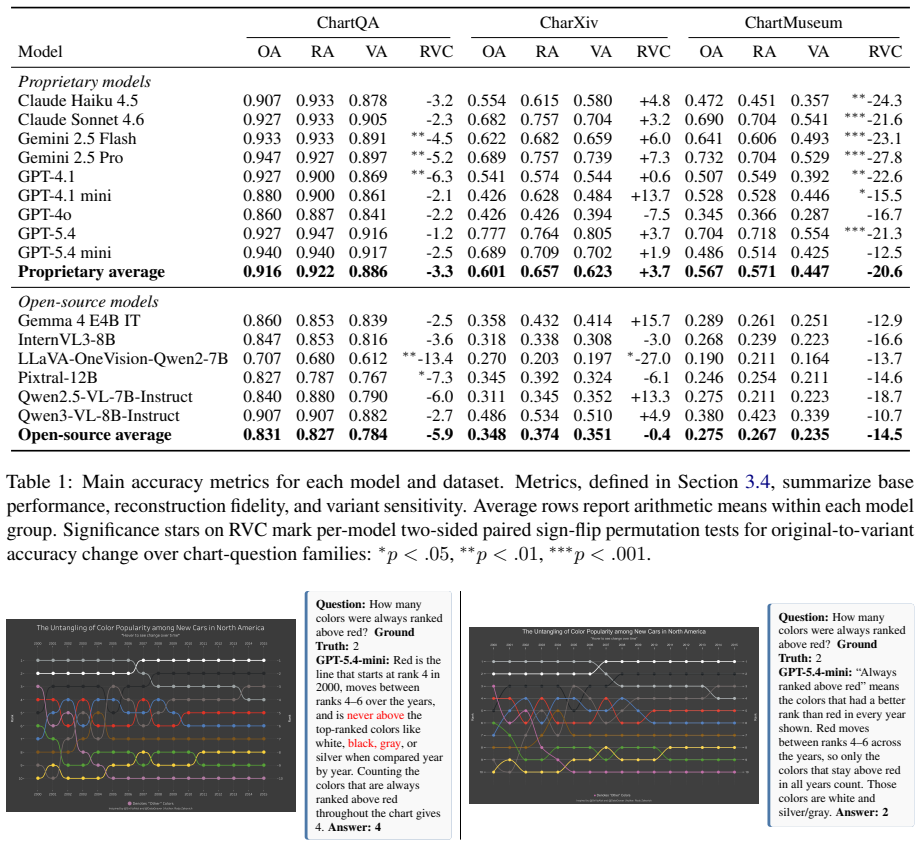
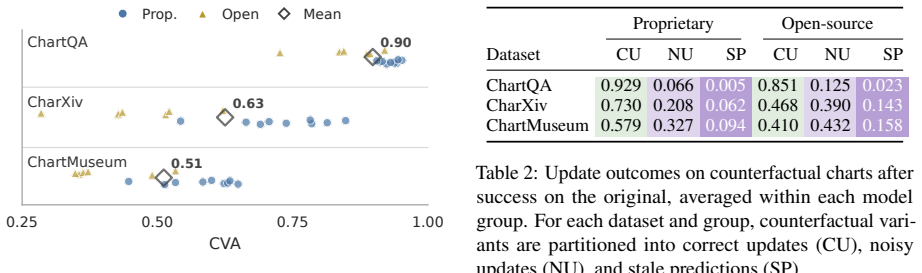
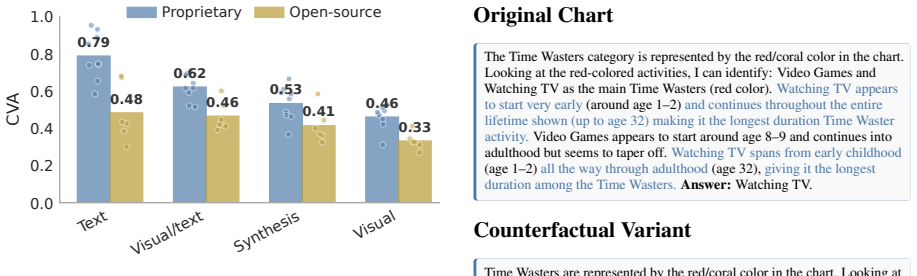
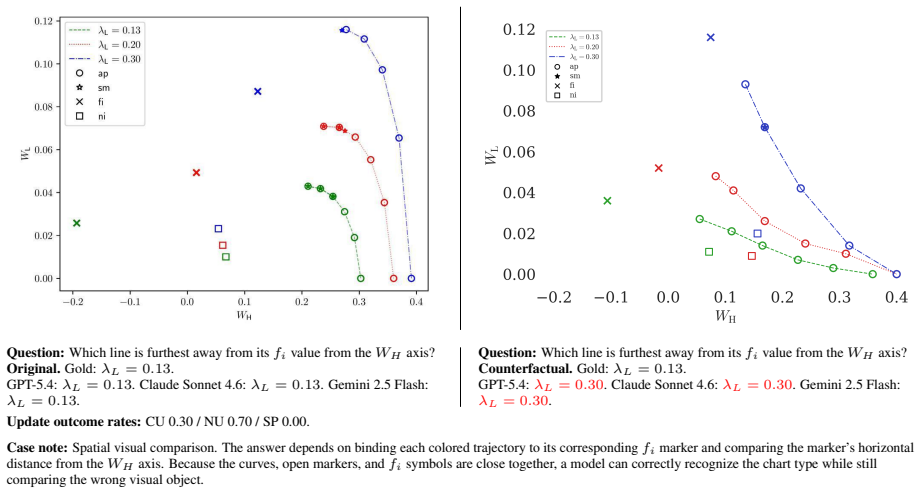
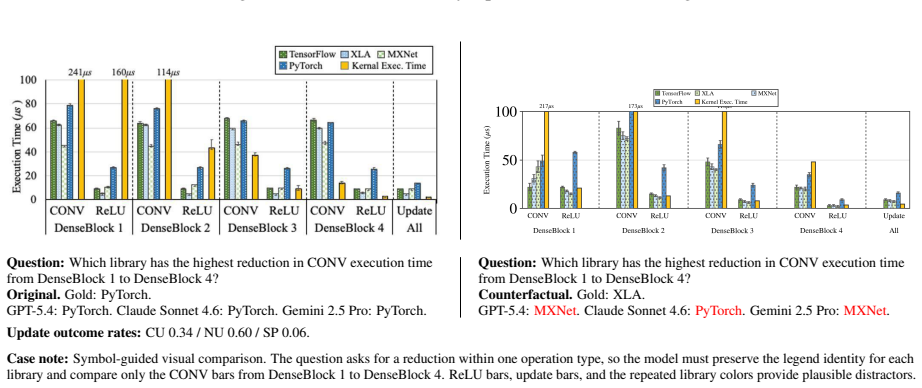
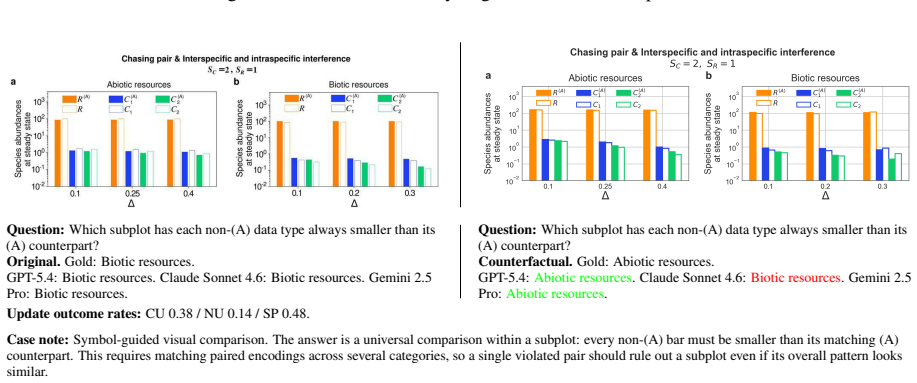
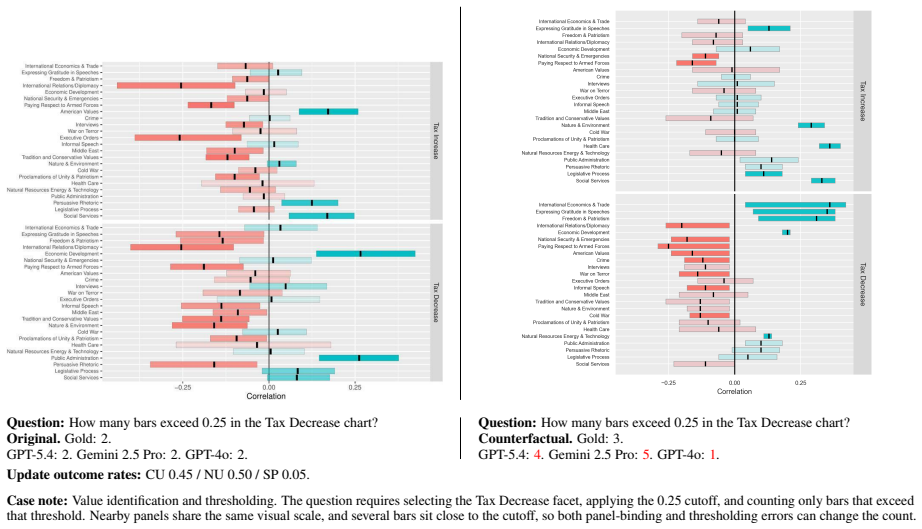
Chartographer reverse engineers charts into executable code, validates fidelity, generates seed-controlled counterfactual variants, and derives new answers; evaluations of proprietary and open-source VLMs show they often fail to generalize after answering the original chart correctly, with failures most common when updated charts require novel visual reasoning pathways.
What carries the argument
Chartographer framework that reverse-engineers charts into executable code to generate and validate counterfactual variants while preserving question validity.
If this is right
- Single-chart accuracy overestimates a model's ability to perform visual reasoning across chart variations.
- Failures concentrate on charts that demand reasoning pathways different from those used on the original.
- Existing chart QA benchmarks can be extended with counterfactual variants to isolate shortcut use from true generalization.
- Model robustness improves only when training or evaluation explicitly varies the visual elements while holding the question fixed.
Where Pith is reading between the lines
- Benchmark designers could embed counterfactual generation directly into dataset creation to reduce the chance of models learning fixed chart templates.
- The same reverse-engineering step might be applied to other visual domains, such as diagrams or maps, to create analogous generalization tests.
- If the performance gap persists across many model scales, it points to a structural limitation in how current VLMs encode chart structure rather than a simple data-coverage issue.
Load-bearing premise
The reverse-engineered code faithfully reconstructs the original chart and the generated variants preserve question validity while introducing genuinely new visual reasoning requirements without exploitable artifacts.
What would settle it
A controlled test where models that fail on counterfactual charts are re-tested on minimal chart edits that keep the same visual reasoning pathway and the same answer; consistent success on those minimal edits would indicate the original failures stem from something other than the intended new reasoning demand.
Figures
read the original abstract
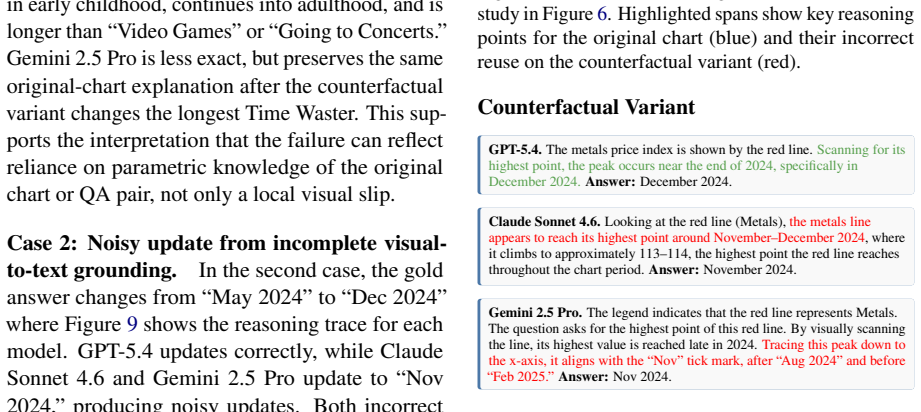
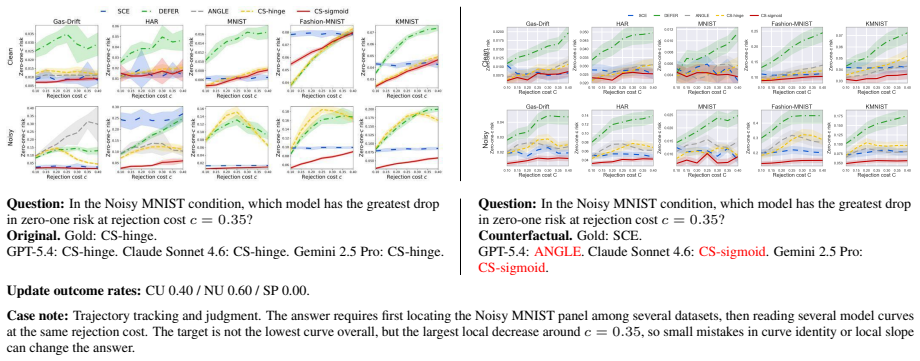
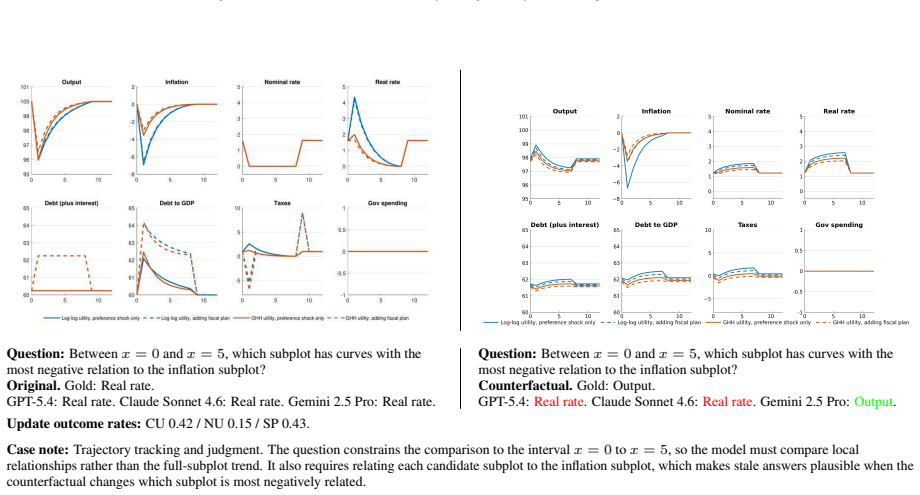
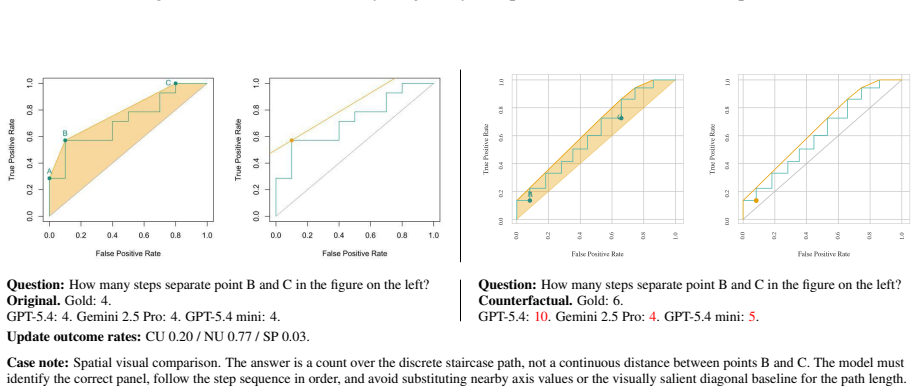
Chart question-answering (QA) benchmarks aim to pose questions that require visual reasoning to correctly answer, but models can often reach solutions through shortcuts or prior familiarity with a chart based on their own background knowledge. To strictly evaluate visual reasoning, we propose counterfactual charts where the chart-question task remains fixed, but underlying chart and the corresponding answer are varied. We introduce Chartographer, a framework to reverse engineer charts into executable code, validate reconstruction fidelity, generate seed-controlled counterfactual variants, and derive new answers from executable QA logic. We apply this framework to existing chart QA datasets and evaluate proprietary and open-source vision-language models (VLMs), measuring variation sensitivity and generalizability. Counterfactual charts reveal failures hidden by single-chart performance: VLMs often fail to generalize after answering the original chart correctly. We find failures are most prevalent when updated charts require novel visual reasoning pathways.
Editorial analysis
A structured set of objections, weighed in public.
Referee Report
Summary. The paper introduces Chartographer, a framework that reverse-engineers charts from existing QA datasets into executable code, validates reconstruction, generates seed-controlled counterfactual variants, and derives new answers via the code. It applies this to chart QA benchmarks and evaluates VLMs, claiming that counterfactuals expose generalization failures hidden by single-chart accuracy, with failures most common when variants require novel visual reasoning pathways.
Significance. If the fidelity of reverse-engineering and the substantive novelty of the introduced reasoning pathways can be demonstrated, the framework would strengthen evaluation of visual reasoning in VLMs by mitigating shortcut learning and background-knowledge exploitation. The executable-code approach for answer derivation is a positive feature for reproducibility and controlled variation.
major comments (2)
- [Chartographer framework] The Chartographer framework description states that reconstruction fidelity is validated, but no quantitative metrics (e.g., data-value extraction accuracy, structural similarity index, or perceptual distance between original and reconstructed charts) are reported. This is load-bearing for the central claim, as unquantified fidelity leaves open the possibility that observed VLM failures arise from generation artifacts rather than reasoning limitations.
- [Evaluation and results] The results on variation sensitivity claim that failures are most prevalent when updated charts require novel visual reasoning pathways, yet no metric, control condition, or analysis is provided to establish that the pathways are genuinely novel (as opposed to reordering of the same visual primitives). This directly affects the interpretation of the differential failure rates.
minor comments (2)
- [Abstract] The abstract summarizes high-level findings without any numerical results (e.g., failure rates or variation-sensitivity scores); including one or two key statistics would better ground the claims.
- Notation for the seed-controlled generation and the executable QA logic could be clarified with a small pseudocode example or explicit variable definitions to aid reproducibility.
Simulated Author's Rebuttal
We thank the referee for their detailed and constructive comments on our manuscript. We address each of the major comments below and indicate the revisions we plan to make.
read point-by-point responses
-
Referee: [Chartographer framework] The Chartographer framework description states that reconstruction fidelity is validated, but no quantitative metrics (e.g., data-value extraction accuracy, structural similarity index, or perceptual distance between original and reconstructed charts) are reported. This is load-bearing for the central claim, as unquantified fidelity leaves open the possibility that observed VLM failures arise from generation artifacts rather than reasoning limitations.
Authors: We agree that providing quantitative metrics for reconstruction fidelity is essential to substantiate our claims and rule out generation artifacts. Although the manuscript describes the validation process, specific numerical results were not included. In the revised manuscript, we will add quantitative metrics, including data-value extraction accuracy, structural similarity measures, and perceptual distance metrics, along with details on how they were computed. revision: yes
-
Referee: [Evaluation and results] The results on variation sensitivity claim that failures are most prevalent when updated charts require novel visual reasoning pathways, yet no metric, control condition, or analysis is provided to establish that the pathways are genuinely novel (as opposed to reordering of the same visual primitives). This directly affects the interpretation of the differential failure rates.
Authors: This is a valid concern. Our classification of novel visual reasoning pathways was based on examining the modifications to the underlying chart generation code and the resulting visual changes. We did not provide a formal quantitative metric or control condition in the original submission. We will expand the analysis section to include more detailed examples and a categorization of the types of changes (e.g., altering data distributions vs. changing chart types), which we believe supports the novelty claim. However, a fully objective metric for 'novel reasoning pathways' may require additional methodological development. revision: partial
Circularity Check
No circularity: methodological framework with no derivations or fitted predictions
full rationale
The paper introduces Chartographer as a procedural framework for reverse-engineering charts into code, generating counterfactual variants, and evaluating VLMs on them. No equations, parameters, or predictive models are defined or fitted. The central claims rest on empirical observations from applying the framework to existing datasets rather than any self-referential derivation, self-citation chain, or renaming of known results. The method is self-contained as a generation and evaluation pipeline whose validity can be checked externally via fidelity metrics or human inspection, with no load-bearing step reducing to its own inputs by construction.
Axiom & Free-Parameter Ledger
Reference graph
Works this paper leans on
-
[1]
Chimera: Diagnosing Shortcut Learning in Visual-Language Understanding.ArXiv preprint, abs/2509.22437. Google. 2025. We’re expanding our Gemini 2.5 fam- ily of models. https://blog.google/products/ gemini/gemini-2-5-model-family-expands/. Google. 2026. Gemma 4: Byte for byte, the most capable open models. https://blog. google/innovation-and-ai/technology/...
-
[2]
LLaVA-OneVision: Easy Visual Task Transfer
Annotation artifacts in natural language infer- ence data. InProceedings of the 2018 Conference of the North American Chapter of the Association for Computational Linguistics: Human Language Tech- nologies, V olume 2 (Short Papers), pages 107–112, New Orleans, Louisiana. Association for Computa- tional Linguistics. Wei He, Zhiheng Xi, Wanxu Zhao, Xiaoran ...
work page internal anchor Pith review Pith/arXiv arXiv 2018
discussion (0)
Sign in with ORCID, Apple, or X to comment. Anyone can read and Pith papers without signing in.