REVIEW 2 major objections 4 references
Spatially resolved data show multiple quenching pathways in ultra-massive galaxies at z approximately 3.5
Reviewed by Pith at T0; open to challenge. T0 means a machine referee read the full paper against a public rubric. the ladder, T0–T4 →
T0 review · grok-4.3
2026-06-29 15:21 UTC pith:URODCNCM
load-bearing objection First spatially resolved [α/Fe] at z~3.5 for three galaxies is the actual advance, but the quenching mechanism mapping is preliminary. the 2 major comments →
MAGAZ3NE: Spatially Resolved Ages and Chemical Abundances of Ultra-Massive Quiescent Galaxies at z sim 3.5 using JWST/NIRSpec IFU
The pith
A machine-rendered reading of the paper's core claim, the machinery that carries it, and where it could break.
Core claim
The authors find that the central regions of the three galaxies are uniformly young at 0.6 to 0.7 billion years with elevated alpha to iron ratios of 0.2 to 0.5. Two galaxies show positive age gradients and negative alpha gradients outward, consistent with rapid merger-driven quenching, while the third has a flat age profile. Metallicities differ by 0.2 to 0.4 dex depending on whether alpha-enhanced models are used, underscoring the need for such models when studying these early systems.
What carries the argument
Spatially resolved stellar population parameters including age, [Fe/H], and [α/Fe] derived from JWST/NIRSpec IFU spectra, which preserve chemical signatures before mergers can erase them.
Load-bearing premise
The gradients in age and alpha-enhancement are caused by the quenching mechanisms themselves and not by choices in spectral modeling, dust, or post-quenching changes.
What would settle it
Repeating the analysis with solar-scaled templates or different dust corrections that removes the positive age gradients and negative alpha gradients would falsify the link to merger-driven quenching.
If this is right
- Quenching pathways were diverse already at z~3.5
- Rapid merger-driven quenching operated in some massive galaxies within the first two billion years
- Alpha-enhancement must be treated explicitly to interpret star-formation histories correctly
- The data provide the first spatially-resolved alpha-enhancement constraints at this epoch
Where Pith is reading between the lines
- If confirmed in larger samples, this would mean merger activity played a role in galaxy quenching very early on
- Incorrect model choices could systematically bias age and metallicity estimates for high-redshift quiescent galaxies
- Similar observations at even higher redshifts could trace the onset of these processes
Editorial analysis
A structured set of objections, weighed in public.
Referee Report
Summary. The paper presents the first spatially-resolved stellar population measurements (age, [Fe/H], [α/Fe]) for three ultra-massive (log M*/M⊙ > 11), compact (Re ≲ 2 kpc) quiescent galaxies at z ∼ 3.5 using JWST/NIRSpec IFU spectroscopy. All three show young (≈0.6–0.7 Gyr), α-enhanced (≈0.2–0.5) cores. Two exhibit positive age gradients and negative [α/Fe] gradients, interpreted as rapid merger-driven quenching; the third has a flat age profile, interpreted as uniform quenching. [Fe/H] gradients are noted as consistent with these trends, but metallicities differ by 0.2–0.4 dex between α-enhanced and solar-scaled models. The work concludes that quenching pathways are already diverse by z ∼ 3.5 and that explicit α-enhancement treatment is required for early quenched systems.
Significance. If the gradient-to-mechanism mapping and model comparisons are robust, the results would provide the first direct spatially-resolved α-enhancement constraints at this epoch, supporting early diversity in quenching and the necessity of α-enhanced templates. The N=3 sample and lack of quantitative robustness tests limit the strength of the diversity claim, but the observational advance on α at z∼3.5 would still be notable if the central interpretations hold after addressing systematics.
major comments (2)
- [Abstract] Abstract: The central claim that positive age + negative [α/Fe] gradients indicate rapid merger-driven quenching (while flat profiles indicate uniform quenching) is load-bearing for the diversity conclusion, yet the text provides no quantitative mapping, comparison to hydrodynamical simulations, or tests against alternatives (spectral-fitting degeneracies, dust, radial IMF variations, or post-quenching migration). The 0.2–0.4 dex [Fe/H] offset between model sets is noted but not propagated into gradient uncertainties or sign stability.
- [Abstract] Abstract: No error budgets, data-reduction details, or robustness tests (e.g., alternative fitting setups, different SSP libraries) are described for the reported gradients or the N=3 diversity statement; with such a small sample these omissions directly affect whether the quenching-pathway conclusions can be drawn from the observations.
Simulated Author's Rebuttal
We thank the referee for their thoughtful and constructive report. The comments correctly identify areas where the manuscript's interpretive claims and robustness documentation can be strengthened. We address each point below and indicate the revisions that will be made.
read point-by-point responses
-
Referee: [Abstract] Abstract: The central claim that positive age + negative [α/Fe] gradients indicate rapid merger-driven quenching (while flat profiles indicate uniform quenching) is load-bearing for the diversity conclusion, yet the text provides no quantitative mapping, comparison to hydrodynamical simulations, or tests against alternatives (spectral-fitting degeneracies, dust, radial IMF variations, or post-quenching migration). The 0.2–0.4 dex [Fe/H] offset between model sets is noted but not propagated into gradient uncertainties or sign stability.
Authors: We agree that the gradient-to-mechanism mapping is currently qualitative and would benefit from more explicit support. In the revised manuscript we will (i) add a dedicated paragraph in the discussion section that compares the observed gradient signs and amplitudes to published expectations from hydrodynamical simulations (e.g., those that track α-enhancement), (ii) explicitly list the main systematics (dust, IMF gradients, post-quenching migration) and state why they are unlikely to reverse the reported gradient signs given the data quality, and (iii) propagate the 0.2–0.4 dex [Fe/H] model offset into the quoted gradient uncertainties and re-evaluate sign stability. A full quantitative mapping or exhaustive alternative-model grid is beyond the scope of this first IFU study but will be flagged as future work. revision: partial
-
Referee: [Abstract] Abstract: No error budgets, data-reduction details, or robustness tests (e.g., alternative fitting setups, different SSP libraries) are described for the reported gradients or the N=3 diversity statement; with such a small sample these omissions directly affect whether the quenching-pathway conclusions can be drawn from the observations.
Authors: The full manuscript already contains data-reduction procedures (Section 2) and per-spaxel error budgets derived from the spectral fits. However, we acknowledge that additional robustness checks were not presented. We will add a new subsection (or appendix) that reports results from (a) two independent SSP libraries, (b) alternative regularization choices in the fitting code, and (c) a Monte-Carlo resampling of the IFU cubes. The diversity statement will be rephrased to emphasize that it is based on the variety seen in this pilot sample of three galaxies and that larger samples are required to quantify the relative frequency of quenching pathways. revision: yes
Circularity Check
No circularity: purely observational fitting with no self-referential derivations
full rationale
The paper reports direct measurements of age, [Fe/H], and [α/Fe] gradients from JWST/NIRSpec IFU spectra of three galaxies using standard stellar-population synthesis fitting. No equations, predictions, or uniqueness theorems are presented that reduce fitted quantities back to input parameters by construction. The interpretive claims about quenching mechanisms (merger-driven vs. uniform) are post-hoc attributions based on observed gradient signs, not derived from any self-citation chain or ansatz that loops to the data. This is a standard observational analysis with no load-bearing self-referential steps.
Axiom & Free-Parameter Ledger
free parameters (1)
- stellar population model parameters (age, [Fe/H], [α/Fe])
axioms (1)
- domain assumption Stellar population synthesis models with alpha-enhanced isochrones accurately reproduce the spectra of z~3.5 quiescent galaxies
read the original abstract
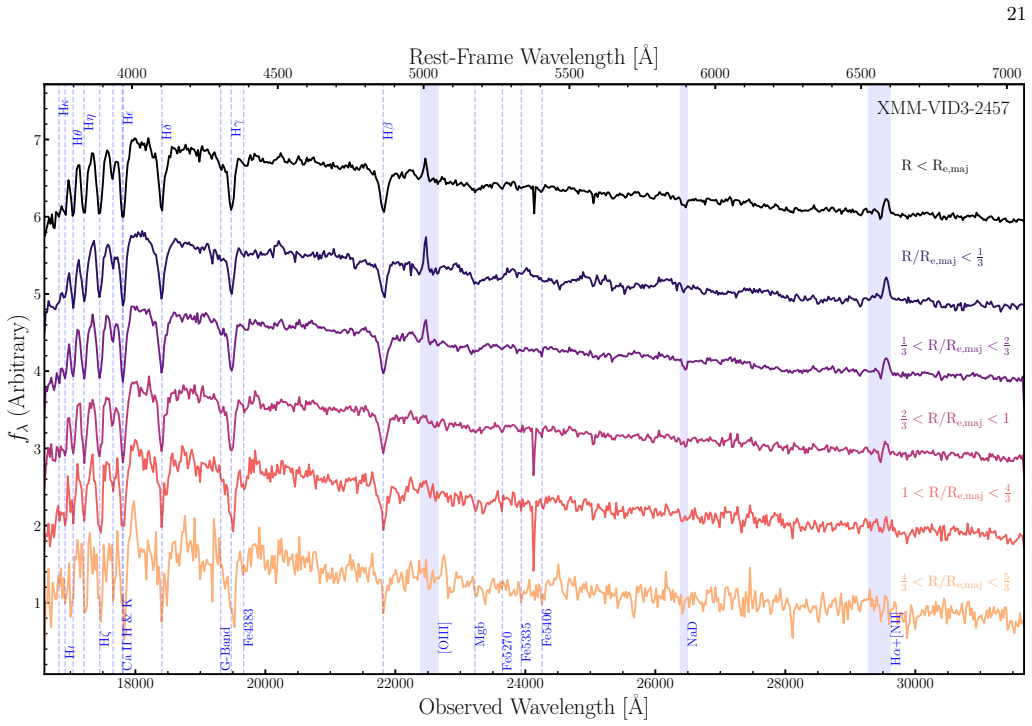
We present spatially-resolved measurements of stellar age, [Fe/H], and [$\alpha$/Fe] in three ultra-massive ($\rm{log(M_{\ast}/M_{\odot})>11}$), compact ($\rm{R_e} \lesssim 2$ kpc) quiescent galaxies at $z\sim3.5$ using JWST/NIRSpec IFU spectroscopy. These observations provide the first spatially-resolved constraints on $\alpha$-enhancement at this epoch, enabling a direct test of quenching mechanisms before late-time assembly processes such as mergers can erase chemical signatures. The central regions of all three galaxies show both uniformly young ages ($\approx0.6-0.7$ Gyr) and elevated [$\alpha$/Fe] ($\approx0.2-0.5$), indicating rapid, enhanced star formation shortly before recent quenching. Beyond the cores, two galaxies display positive age gradients and negative [$\alpha$/Fe] gradients, consistent with rapid merger-driven quenching, while the third shows a flat age profile indicative of uniform quenching. The [Fe/H] gradients are also consistent with these trends, though we note that the metallicities reported by codes using $\alpha$-enhanced models differ significantly ($\approx0.2-0.4$ dex) from those reported using solar-scaled templates. These data demonstrate that quenching pathways are diverse by $z\sim3.5$, with rapid, merger-driven quenching already operating in a subset of massive quiescent galaxies in the first two billion years of cosmic time. Furthermore, these results establish that explicit treatment of $\alpha$-enhancement is essential for interpreting the star-formation histories of the earliest quenched systems.
Figures




Reference graph
Works this paper leans on
-
[1]
Akhshik, M., Whitaker, K. E., Brammer, G., et al. 2020, ApJ, 900, 184, doi: 10.3847/1538-4357/abac62 Akhshik, M., Whitaker, K. E., Leja, J., et al. 2023, ApJ, 943, 179, doi: 10.3847/1538-4357/aca677 Antwi-Danso, J., Papovich, C., Esdaile, J., et al. 2025, ApJ, 978, 90, doi: 10.3847/1538-4357/ad8b30 Araya-Araya, P., Cochrane, R. K., Hayward, C. C., et al. ...
-
[2]
(2019) Non-parametric SFH SFR (M⊙ yr−1) (1×10 −8, 2×10
Iyer et al. (2019) Non-parametric SFH SFR (M⊙ yr−1) (1×10 −8, 2×10
2019
-
[3]
log 10 αλ<5000˚A (−2,4) Gaussian (µ=−1.5, σ= 0.5) αλ>5000˚A (−2,2) Gaussian (µ= 0.5, σ= 0.5) aOnly for XMM-VID3-2457. T able 3.Priors used inBagpipesspectral fitting. Asplund, M., Grevesse, N., & Sauval, A. J. 2005, in Astronomical Society of the Pacific Conference Series, Vol. 336, Cosmic Abundances as Records of Stellar Evolution and Nucleosynthesis, ed...
work page internal anchor Pith review doi:10.3847/1538-4357/ac7c74 2005
-
[4]
Fast and scalable Gaussian process modeling with applications to astronomical time series
(blue) for age (top left), [Fe/H] (top right), metallicity (bottom left), and [α/Fe] (bottom right). Posterior fitting distributions are presented as probability density functions. The model galaxy is made with an age of 1.1 Gyr, Z ∗ = Z⊙, [α/Fe] = 0, andσ ∗ = 200 km/s. These values are indicated by a black dashed line. Foreman-Mackey, D., Agol, E., Ambik...
work page internal anchor Pith review doi:10.3847/1538-3881/aa9332 2017
discussion (0)
Sign in with ORCID, Apple, or X to comment. Anyone can read and Pith papers without signing in.