Evaluating Local Explainability Metrics for Machine Learning Models on Tabular Data
Pith reviewed 2026-06-29 18:19 UTC · model grok-4.3
The pith
Local explanations on tabular data track dataset complexity more than model performance.
A machine-rendered reading of the paper's core claim, the machinery that carries it, and where it could break.
Core claim
The obtained results demonstrate that the explanations are not always correlated with a model's predictive performance. Instead, dataset complexity and feature distributions seem to be the main factors affecting explanation quality and reliability.
What carries the argument
The comparison of faithfulness, robustness, and complexity metrics for LIME, Kernel SHAP, and Feature Ablation explanations on consensus-correct versus consensus-wrong samples.
Load-bearing premise
The selected metrics for faithfulness, robustness, and complexity accurately measure whether an explanation reflects the model's true reasoning process.
What would settle it
Observing consistent correlation between the explanation quality metrics and model accuracy on a new set of tabular datasets would falsify the finding that dataset complexity is the dominant factor.
Figures
read the original abstract
Despite the wide use of explainability techniques to attempt to understand the behavior of Artificial Intelligence (AI), the generated explanations may not always be reliable. An explanation can appear plausible to humans but fail to capture the internal reasoning of a model, particularly when dealing with complex tabular data. This paper studies the trustworthiness of local explainability techniques when applied to complex tabular classification tasks, considering evaluated metrics for three main properties: faithfulness to the model's predictions, robustness to input data variations, and complexity of the explanation itself. A benchmark was performed for Local Interpretable Model-Agnostic Explanations (LIME), Kernel SHapley Additive exPlanations (SHAP), and Feature Ablation techniques, across 32 datasets and different types of machine learning models. Model performance ranges were analyzed to identify two groups: consensus-correct, which are samples that all models predicted correctly, and consensus-wrong, samples that all models predicted incorrectly. The obtained results demonstrate that that the explanations are not always correlated with a model's predictive performance. Instead, dataset complexity and feature distributions seem to be the main factors affecting explanation quality and reliability.
Editorial analysis
A structured set of objections, weighed in public.
Referee Report
Summary. The paper benchmarks local explainability methods (LIME, Kernel SHAP, Feature Ablation) on tabular classification tasks across 32 datasets. It defines groups of consensus-correct and consensus-wrong samples based on agreement across multiple ML models, computes quantitative scores for faithfulness, robustness, and complexity of the explanations, and reports that these scores show no systematic difference between the two groups. The central claim is that explanation quality is uncorrelated with model predictive performance and is instead driven primarily by dataset complexity and feature distributions.
Significance. If the chosen metrics are shown to be valid proxies for fidelity to model reasoning, the result would indicate that local explanations on tabular data are more sensitive to data characteristics than to whether a model is accurate on a given sample. This has practical implications for when explanations can be trusted in high-stakes tabular settings and would add to the empirical literature on XAI reliability. The study uses a reasonably broad set of datasets and three distinct explanation techniques, which strengthens the scope if the analysis is statistically sound.
major comments (3)
- [Abstract, §4] Abstract and §4 (Results): the claim that explanations are uncorrelated with predictive performance rests on the absence of systematic differences between consensus-correct and consensus-wrong groups, yet the manuscript provides no definition or formulas for the faithfulness, robustness, or complexity metrics used to compute those differences. Without these definitions it is impossible to determine whether the metrics actually track the model's internal decision process rather than artifacts of the explanation methods themselves (e.g., LIME discretization or SHAP kernel approximations).
- [§3, §4] §3 (Methodology) and §4: no description is given of how the consensus-correct and consensus-wrong groups were formed (e.g., number of models, agreement threshold, handling of ties) nor of any statistical tests (paired t-tests, Wilcoxon, effect sizes, multiple-comparison correction) used to compare metric values between groups. The reported conclusion therefore lacks the quantitative support needed to rule out noise or selection effects.
- [§4] §4 and Table X (results tables): the manuscript does not report any independent validation that the chosen faithfulness/robustness metrics align with model behavior beyond their own definitions, such as synthetic-data checks, correlation with known ground-truth feature importances, or ablation studies on correlated features. This leaves the central claim vulnerable to the known limitations of the metrics on tabular data.
minor comments (2)
- [Abstract] The abstract contains a repeated word ('that that') and should be tightened to state the exact metrics and statistical criteria used.
- [§2, §3] Notation for the three explanation methods and the three metric families should be introduced once in §2 or §3 and used consistently thereafter.
Simulated Author's Rebuttal
We thank the referee for the constructive and detailed feedback. We agree that additional methodological details and clarifications are needed to strengthen the manuscript. Below we respond point-by-point to the major comments and indicate the revisions we will make.
read point-by-point responses
-
Referee: [Abstract, §4] Abstract and §4 (Results): the claim that explanations are uncorrelated with predictive performance rests on the absence of systematic differences between consensus-correct and consensus-wrong groups, yet the manuscript provides no definition or formulas for the faithfulness, robustness, or complexity metrics used to compute those differences. Without these definitions it is impossible to determine whether the metrics actually track the model's internal decision process rather than artifacts of the explanation methods themselves (e.g., LIME discretization or SHAP kernel approximations).
Authors: We agree that explicit definitions and formulas are required for reproducibility and to allow assessment of whether the metrics capture model reasoning. The faithfulness metric is defined as the correlation between the explanation weights and the change in model output under feature perturbations; robustness as the stability of explanations under small Gaussian noise added to inputs; and complexity as the number of non-zero features in the explanation (or equivalent sparsity measure). We will insert a new subsection in §3 with the precise mathematical formulations and references to their original definitions in the XAI literature. revision: yes
-
Referee: [§3, §4] §3 (Methodology) and §4: no description is given of how the consensus-correct and consensus-wrong groups were formed (e.g., number of models, agreement threshold, handling of ties) nor of any statistical tests (paired t-tests, Wilcoxon, effect sizes, multiple-comparison correction) used to compare metric values between groups. The reported conclusion therefore lacks the quantitative support needed to rule out noise or selection effects.
Authors: We acknowledge the omission of these procedural details. The groups were constructed from five distinct model families (logistic regression, random forest, gradient boosting, neural network, and SVM) by selecting samples on which all five models produced identical correct or incorrect predictions (unanimous agreement; ties were excluded). We will expand §3 to document the exact model count, agreement rule, tie handling, and the statistical procedure (paired Wilcoxon signed-rank tests with effect sizes and Bonferroni correction) used to compare metric distributions between groups. revision: yes
-
Referee: [§4] §4 and Table X (results tables): the manuscript does not report any independent validation that the chosen faithfulness/robustness metrics align with model behavior beyond their own definitions, such as synthetic-data checks, correlation with known ground-truth feature importances, or ablation studies on correlated features. This leaves the central claim vulnerable to the known limitations of the metrics on tabular data.
Authors: The metrics are drawn from established XAI literature that already includes synthetic-data and ground-truth validations; our contribution is their comparative application across 32 tabular datasets rather than re-validation. Nevertheless, we will add a paragraph in §4 that explicitly cites the original validation studies for each metric and discusses their known limitations on tabular data. If space permits, we will also include a short reference to a synthetic sanity check performed during our pilot experiments. revision: yes
Circularity Check
No circularity: purely empirical benchmark study
full rationale
This paper performs an empirical benchmark of LIME, SHAP, and Feature Ablation across 32 tabular datasets, reporting observed correlations (or lack thereof) between explanation metrics and model performance. No derivations, fitted parameters, predictions, or self-citations are invoked as load-bearing steps in any claimed chain. All reported findings rest on direct measurement against external datasets and models, making the study self-contained against external benchmarks with no reduction of results to author-defined quantities by construction.
Axiom & Free-Parameter Ledger
Reference graph
Works this paper leans on
-
[1]
Explainable ai (xai): A systematic meta-survey of current challenges and future opportunities,
W. Saeed and C. Omlin, “Explainable ai (xai): A systematic meta-survey of current challenges and future opportunities,”Knowledge- Based Systems, vol. 263, p. 110273, 2023. [Online]. Available: https://www.sciencedirect.com/science/article/pii/S0950705123000230
2023
-
[2]
Peeking inside the black-box: A survey on explainable artificial intelligence (xai),
A. Adadi and M. Berrada, “Peeking inside the black-box: A survey on explainable artificial intelligence (xai),”IEEE Access, vol. 6, pp. 52 138–52 160, 2018
2018
-
[3]
C. Rudin, “Stop explaining black box machine learning models for high stakes decisions and use interpretable models instead,” vol. 1, no. 5, pp. 206–215. [Online]. Available: https://doi.org/10.1038/s42256-019-0048-x
-
[4]
A survey on neural network interpretability,
Y . Zhang, P. Tino, A. Leonardis, and K. Tang, “A survey on neural network interpretability,”IEEE Transactions on Emerging Topics in Computational Intelligence, vol. 5, no. 5, p. 726–742, Oct. 2021. [Online]. Available: http://dx.doi.org/10.1109/TETCI.2021.3100641
-
[5]
European union regulations on algorithmic decision making and a “right to explanation
B. Goodman and S. Flaxman, “European union regulations on algorithmic decision making and a “right to explanation”,”AI Magazine, vol. 38, no. 3, pp. 50–57, 2017. [Online]. Available: https://onlinelibrary.wiley.com/doi/abs/10.1609/aimag.v38i3.2741
-
[6]
A survey of contrastive and counterfactual explanation generation methods for explainable artificial intelligence,
I. Stepin, J. M. Alonso, A. Catala, and M. Pereira-Fari ˜na, “A survey of contrastive and counterfactual explanation generation methods for explainable artificial intelligence,”IEEE Access, vol. 9, pp. 11 974–12 001, 2021
2021
-
[8]
"Why Should I Trust You?": Explaining the Predictions of Any Classifier
[Online]. Available: http://arxiv.org/abs/1602.04938
work page internal anchor Pith review Pith/arXiv arXiv
-
[9]
A unified approach to interpreting model predictions,
S. M. Lundberg and S.-I. Lee, “A unified approach to interpreting model predictions,” inAdvances in Neural Information Processing Systems, I. Guyon, U. V . Luxburg, S. Bengio, H. Wallach, R. Fergus, S. Vishwanathan, and R. Garnett, Eds., vol. 30. Curran Associates, Inc., 2017. [Online]. Available: https://proceedings.neurips.cc/paper files/paper/2017/file...
2017
-
[10]
Consistent Individualized Feature Attribution for Tree Ensembles
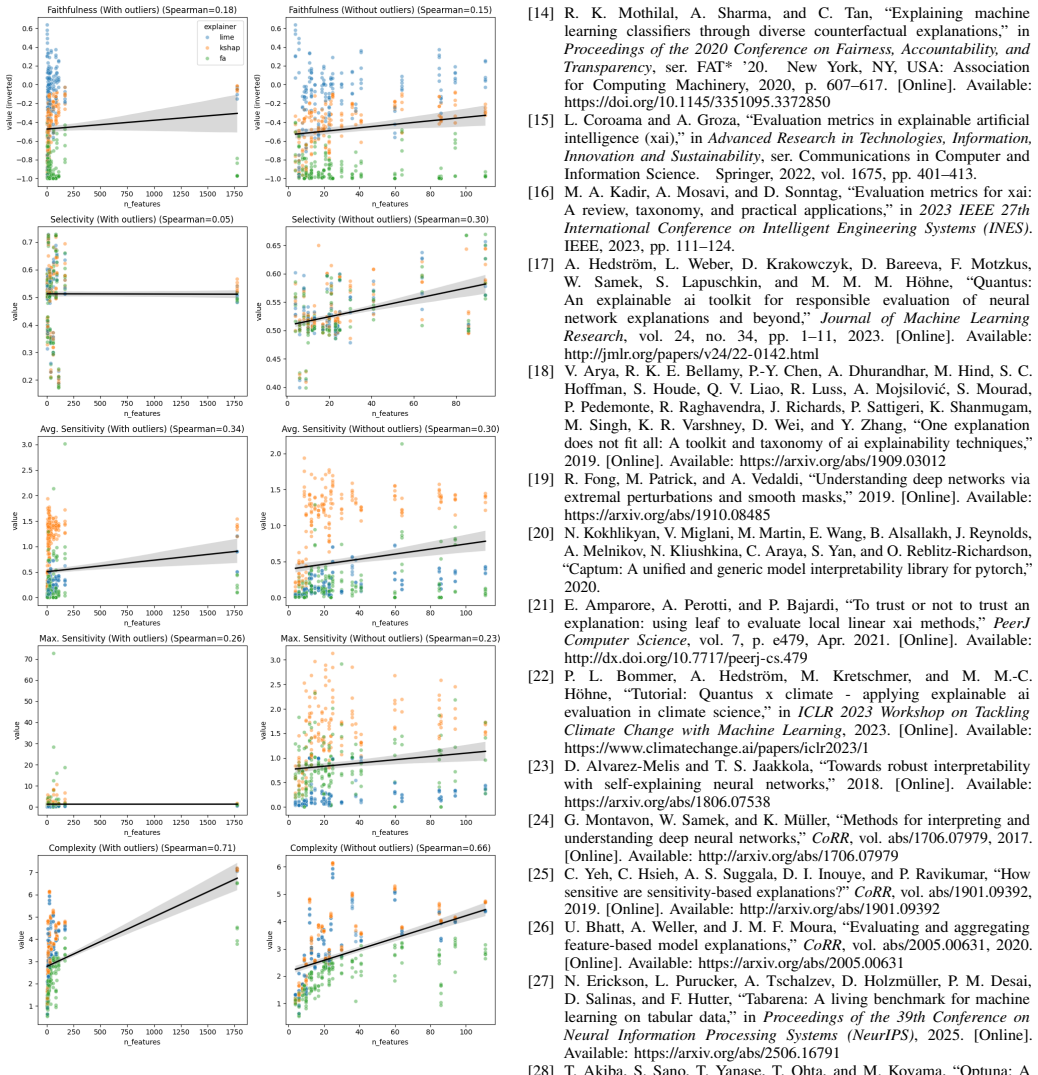
S. M. Lundberg, G. G. Erion, and S.-I. Lee, “Consistent individualized feature attribution for tree ensembles,” 2019. [Online]. Available: https://arxiv.org/abs/1802.03888 Fig. 1. Correlation of explainability metrics with number of features of a tabular dataset
work page internal anchor Pith review Pith/arXiv arXiv 2019
-
[11]
Feature ablation for preposition disambiguation,
K. Litkowski, “Feature ablation for preposition disambiguation,” 05 2016
2016
-
[12]
Axiomatic Attribution for Deep Networks
M. Sundararajan, A. Taly, and Q. Yan, “Axiomatic attribution for deep networks,” 2017. [Online]. Available: https://arxiv.org/abs/1703.01365
work page internal anchor Pith review Pith/arXiv arXiv 2017
-
[13]
Grad-cam: Visual explanations from deep networks via gradient-based localization,
R. R. Selvaraju, M. Cogswell, A. Das, R. Vedantam, D. Parikh, and D. Batra, “Grad-cam: Visual explanations from deep networks via gradient-based localization,”International Journal of Computer Vision, vol. 128, no. 2, p. 336–359, Oct. 2019. [Online]. Available: http://dx.doi.org/10.1007/s11263-019-01228-7
-
[14]
Greedy function approximation: A gradient boosting machine,
J. Friedman, “Greedy function approximation: A gradient boosting machine,”The Annals of Statistics, vol. 29, 11 2000
2000
-
[15]
Explaining machine learning classifiers through diverse counterfactual explanations,
R. K. Mothilal, A. Sharma, and C. Tan, “Explaining machine learning classifiers through diverse counterfactual explanations,” in Proceedings of the 2020 Conference on Fairness, Accountability, and Transparency, ser. FAT* ’20. New York, NY , USA: Association for Computing Machinery, 2020, p. 607–617. [Online]. Available: https://doi.org/10.1145/3351095.3372850
-
[16]
Evaluation metrics in explainable artificial intelligence (xai),
L. Coroama and A. Groza, “Evaluation metrics in explainable artificial intelligence (xai),” inAdvanced Research in Technologies, Information, Innovation and Sustainability, ser. Communications in Computer and Information Science. Springer, 2022, vol. 1675, pp. 401–413
2022
-
[17]
Evaluation metrics for xai: A review, taxonomy, and practical applications,
M. A. Kadir, A. Mosavi, and D. Sonntag, “Evaluation metrics for xai: A review, taxonomy, and practical applications,” in2023 IEEE 27th International Conference on Intelligent Engineering Systems (INES). IEEE, 2023, pp. 111–124
2023
-
[18]
Quantus: An explainable ai toolkit for responsible evaluation of neural network explanations and beyond,
A. Hedstr ¨om, L. Weber, D. Krakowczyk, D. Bareeva, F. Motzkus, W. Samek, S. Lapuschkin, and M. M. M. H ¨ohne, “Quantus: An explainable ai toolkit for responsible evaluation of neural network explanations and beyond,”Journal of Machine Learning Research, vol. 24, no. 34, pp. 1–11, 2023. [Online]. Available: http://jmlr.org/papers/v24/22-0142.html
2023
-
[19]
One explanation does not fit all: A toolkit and taxonomy of ai explainability techniques,
V . Arya, R. K. E. Bellamy, P.-Y . Chen, A. Dhurandhar, M. Hind, S. C. Hoffman, S. Houde, Q. V . Liao, R. Luss, A. Mojsilovi ´c, S. Mourad, P. Pedemonte, R. Raghavendra, J. Richards, P. Sattigeri, K. Shanmugam, M. Singh, K. R. Varshney, D. Wei, and Y . Zhang, “One explanation does not fit all: A toolkit and taxonomy of ai explainability techniques,”
-
[20]
Available: https://arxiv.org/abs/1909.03012
[Online]. Available: https://arxiv.org/abs/1909.03012
-
[21]
Understanding deep networks via extremal perturbations and smooth masks,
R. Fong, M. Patrick, and A. Vedaldi, “Understanding deep networks via extremal perturbations and smooth masks,” 2019. [Online]. Available: https://arxiv.org/abs/1910.08485
-
[22]
Captum: A unified and generic model interpretability library for pytorch,
N. Kokhlikyan, V . Miglani, M. Martin, E. Wang, B. Alsallakh, J. Reynolds, A. Melnikov, N. Kliushkina, C. Araya, S. Yan, and O. Reblitz-Richardson, “Captum: A unified and generic model interpretability library for pytorch,” 2020
2020
-
[23]
To trust or not to trust an explanation: using leaf to evaluate local linear xai methods,
E. Amparore, A. Perotti, and P. Bajardi, “To trust or not to trust an explanation: using leaf to evaluate local linear xai methods,”PeerJ Computer Science, vol. 7, p. e479, Apr. 2021. [Online]. Available: http://dx.doi.org/10.7717/peerj-cs.479
-
[24]
Tutorial: Quantus x climate - applying explainable ai evaluation in climate science,
P. L. Bommer, A. Hedstr ¨om, M. Kretschmer, and M. M.-C. H¨ohne, “Tutorial: Quantus x climate - applying explainable ai evaluation in climate science,” inICLR 2023 Workshop on Tackling Climate Change with Machine Learning, 2023. [Online]. Available: https://www.climatechange.ai/papers/iclr2023/1
2023
-
[25]
Towards Robust Interpretability with Self-Explaining Neural Networks
D. Alvarez-Melis and T. S. Jaakkola, “Towards robust interpretability with self-explaining neural networks,” 2018. [Online]. Available: https://arxiv.org/abs/1806.07538
work page internal anchor Pith review Pith/arXiv arXiv 2018
-
[26]
Methods for Interpreting and Understanding Deep Neural Networks
G. Montavon, W. Samek, and K. M ¨uller, “Methods for interpreting and understanding deep neural networks,”CoRR, vol. abs/1706.07979, 2017. [Online]. Available: http://arxiv.org/abs/1706.07979
work page internal anchor Pith review Pith/arXiv arXiv 2017
-
[28]
Available: http://arxiv.org/abs/1901.09392
[Online]. Available: http://arxiv.org/abs/1901.09392
-
[29]
Evaluating and aggregating feature-based model explanations,
U. Bhatt, A. Weller, and J. M. F. Moura, “Evaluating and aggregating feature-based model explanations,”CoRR, vol. abs/2005.00631, 2020. [Online]. Available: https://arxiv.org/abs/2005.00631
-
[30]
TabArena: A Living Benchmark for Machine Learning on Tabular Data
N. Erickson, L. Purucker, A. Tschalzev, D. Holzm ¨uller, P. M. Desai, D. Salinas, and F. Hutter, “Tabarena: A living benchmark for machine learning on tabular data,” inProceedings of the 39th Conference on Neural Information Processing Systems (NeurIPS), 2025. [Online]. Available: https://arxiv.org/abs/2506.16791
work page internal anchor Pith review Pith/arXiv arXiv 2025
-
[31]
Optuna: A Next-generation Hyperparameter Optimization Framework
T. Akiba, S. Sano, T. Yanase, T. Ohta, and M. Koyama, “Optuna: A next-generation hyperparameter optimization framework,”CoRR, vol. abs/1907.10902, 2019. [Online]. Available: http://arxiv.org/abs/1907. 10902
work page internal anchor Pith review Pith/arXiv arXiv 1907
-
[32]
Accelerating the machine learning lifecycle with mlflow,
M. A. Zaharia, A. Chen, A. Davidson, A. Ghodsi, S. A. Hong, A. Konwinski, S. Murching, T. Nykodym, P. Ogilvie, M. Parkhe, F. Xie, and C. Zumar, “Accelerating the machine learning lifecycle with mlflow,” IEEE Data Eng. Bull., vol. 41, pp. 39–45, 2018. [Online]. Available: https://api.semanticscholar.org/CorpusID:83459546
2018
discussion (0)
Sign in with ORCID, Apple, or X to comment. Anyone can read and Pith papers without signing in.