SmartIterator: Visual Analytics Workflows for Supervising Unsupervised Data Grouping
Pith reviewed 2026-06-29 10:16 UTC · model grok-4.3
The pith
SmartIterator supplies six-phase workflows that convert unsupervised grouping parameter sweeps into cumulative understanding of data structure.
A machine-rendered reading of the paper's core claim, the machinery that carries it, and where it could break.
Core claim
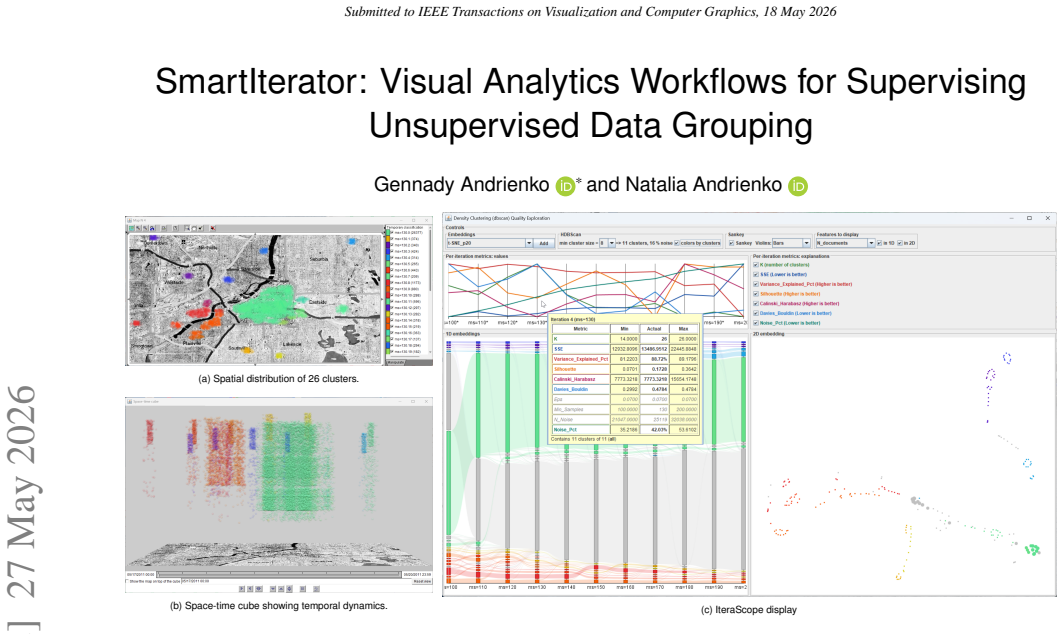
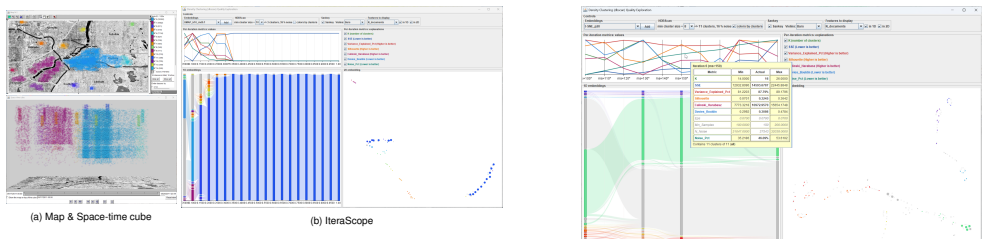
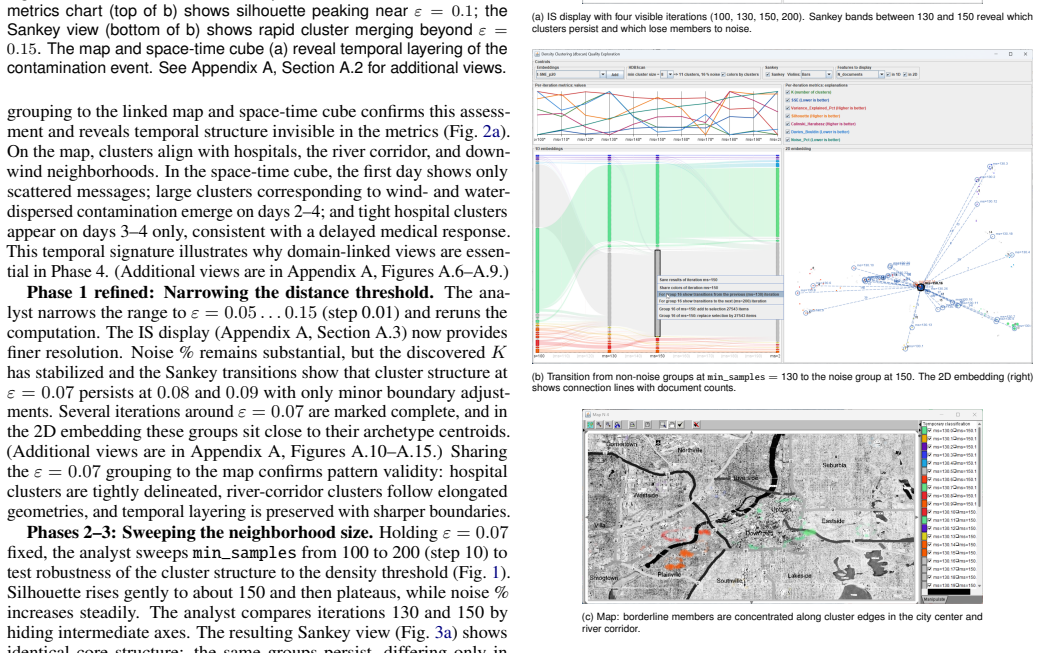
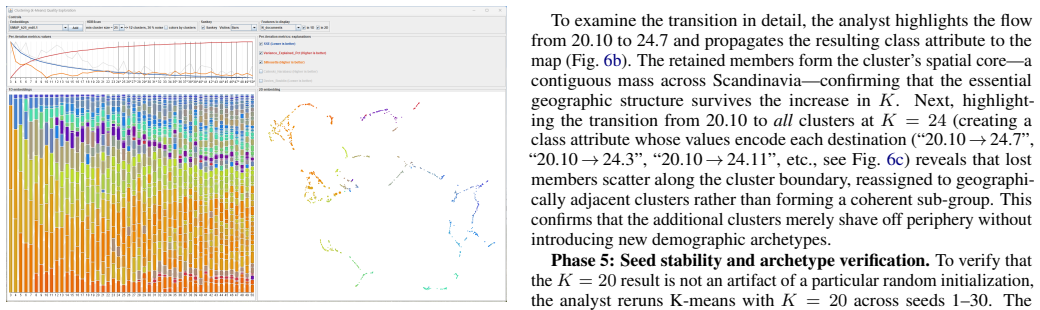
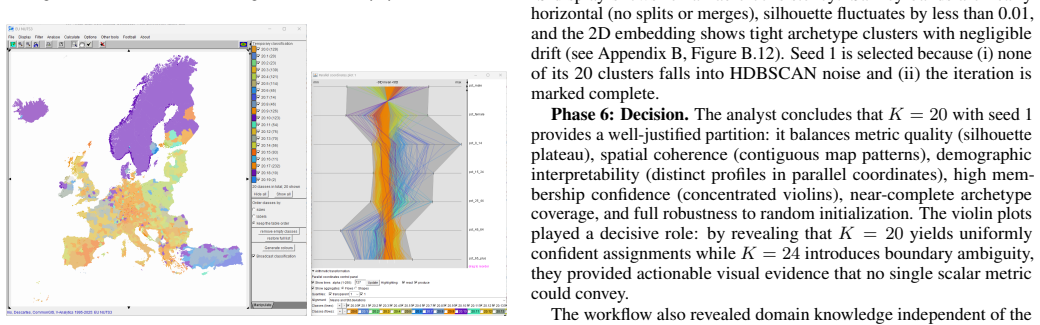
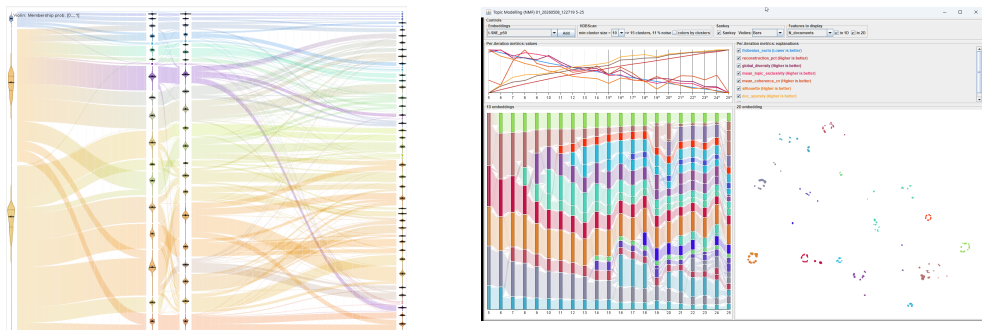
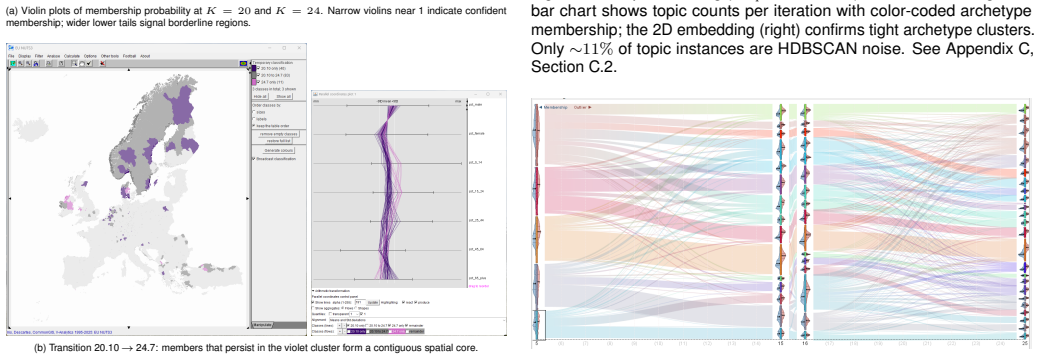
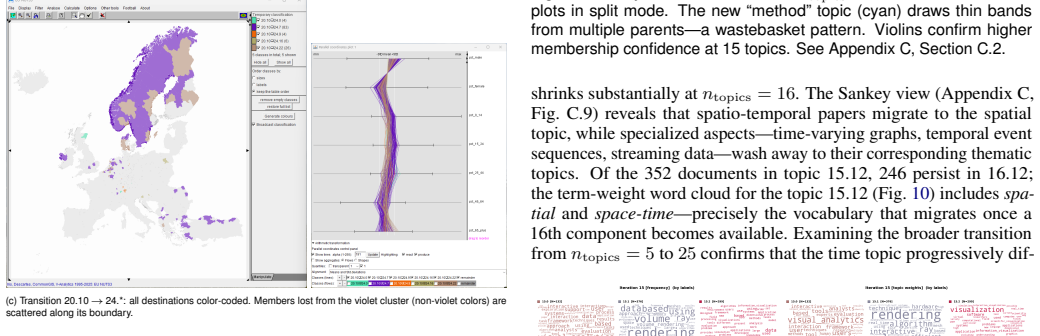
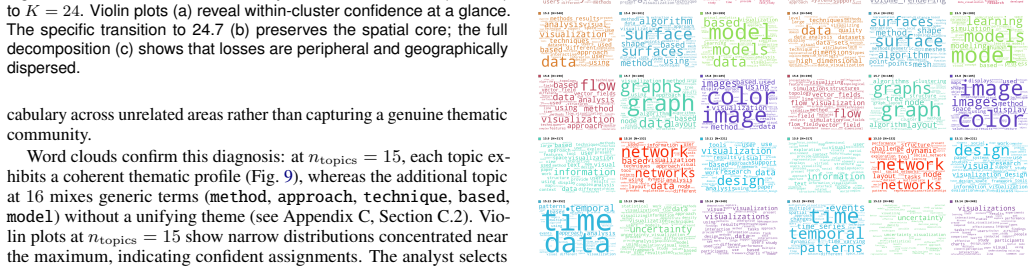
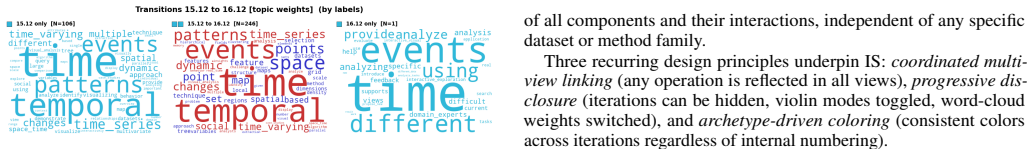
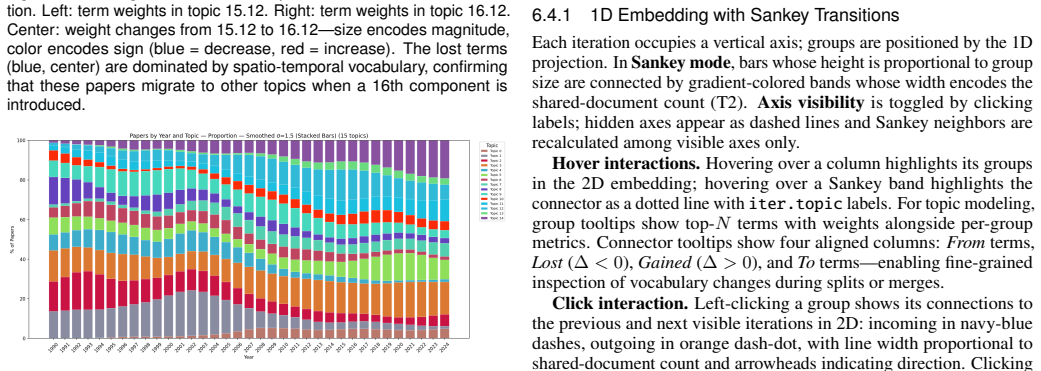
SmartIterator defines structured six-phase workflows for each of three unsupervised method families and operationalizes them in IteraScope, a coordinated visual system that combines quality-metric charts, 1D group embeddings with Sankey flows and confidence violins, 2D embeddings with HDBSCAN-detected recurrent archetypes, and domain-specific views. Demonstrations on simulated social-media messages, EU regional statistics, and thirty years of VIS papers show the workflows guiding analysts from metric overviews to informed choices while revealing how data structure evolves. The paper states that the workflows themselves constitute the main contribution because they yield knowledge about the d
What carries the argument
SmartIterator's six-phase workflows, realized through IteraScope's coordinated displays of quality metrics, transition flows, membership confidence, and recurrent archetypes.
If this is right
- Analysts obtain systematic guidance for navigating parameter spaces specific to each clustering or topic-modeling family.
- The process reveals how data groupings evolve, stabilize, or recur across configurations.
- Membership confidence and persistent archetypes become explicit objects of inspection rather than implicit judgments.
- Domain context is incorporated at each phase to ground interpretations.
- The outcome is knowledge of data organization that exceeds what any isolated grouping supplies.
Where Pith is reading between the lines
- The same phased structure could be adapted to other parameter-sensitive unsupervised tasks such as dimensionality reduction or anomaly detection.
- Visual analytics tools for machine learning might shift emphasis from single-result optimization toward explicit support for sequence exploration.
- The approach implies that interfaces should surface transition patterns and archetype recurrence as primary navigation aids.
- Deployment on streaming or very large collections would test whether the current visual encodings scale without loss of the claimed cumulative insight.
Load-bearing premise
That the six-phase workflow structure produces more reliable decisions about groupings than ad-hoc exploration of the same parameter sweeps.
What would settle it
A direct comparison in which one group of analysts follows the six-phase workflows on a shared dataset while another explores the same results without the structure, then measuring differences in the groupings they select or the justifications they provide.
Figures
read the original abstract
Unsupervised learning methods -- topic modeling, partition-based and density-based clustering -- produce data groupings without human guidance, yet choosing and evaluating those groupings should not itself be unsupervised. We present \emph{SmartIterator}~(SI), a visual analytics approach that treats the full sequence of grouping results across a parameter sweep as a first-class analytical object. For each method family, SI provides a structured six-phase workflow that guides the analyst through systematic exploration of grouping results -- from quality-metric overview through transition-stability assessment, membership-confidence evaluation, content and context inspection, and recurrent-archetype verification to an informed decision -- building cumulative understanding of data structure along the way. The workflows are operationalized through \emph{IteraScope}~(IS), a coordinated visual display combining quality-metric charts with semantic color encoding, a 1D group embedding with Sankey-style transition flows and violin plots of membership confidence, a 2D group embedding with HDBSCAN-detected recurrent archetypes that highlights iterations capturing all persistent patterns, and domain-specific linked views for contextualized interpretation. We demonstrate the three workflows on: (1)~simulated social-media messages from the VAST Challenge 2011 (density-based clustering, validated against ground truth), (2)~EU population statistics across ${\sim}1\,500$ NUTS-3 regions (partition-based clustering), and (3)~30 years of IEEE VIS papers (NMF topic modeling). The workflows constitute the main contribution: they provide actionable, method-specific guidance for navigating parameter spaces, studying how data structure evolves across configurations, and grounding analytical understanding in domain context -- yielding knowledge about the data that no single ``best'' result can provide.
Editorial analysis
A structured set of objections, weighed in public.
Referee Report
Summary. The paper claims to introduce SmartIterator (SI), a visual analytics approach that treats the full sequence of unsupervised grouping results (from topic modeling, partition-based and density-based clustering) across parameter sweeps as a first-class object. It defines structured six-phase workflows (quality overview, transition stability, membership confidence, content inspection, archetype verification, decision) operationalized in the IteraScope interface with coordinated views including quality charts, Sankey flows, violin plots, 2D embeddings with HDBSCAN archetypes, and domain views. These are demonstrated on three cases (VAST 2011 density clustering with ground truth, EU NUTS-3 partition clustering, 30-year IEEE VIS NMF topics) to show how the workflows yield cumulative, method-specific understanding of data structure beyond any single 'best' result.
Significance. If validated, the contribution of method-specific structured workflows for parameter-space navigation in unsupervised grouping could meaningfully advance visual analytics practice in HC by shifting focus from result selection to evolutionary understanding of groupings. The coordinated multi-view design and emphasis on recurrent archetypes and transition stability offer a concrete operationalization that addresses a common pain point in exploratory analysis of clustering and topic models.
major comments (2)
- [Abstract / Case studies] Abstract and demonstration sections: The central claim that the six-phase workflows 'provide actionable, method-specific guidance ... yielding knowledge about the data that no single "best" result can provide' and outperform ad-hoc exploration is load-bearing for the contribution, yet the three case studies supply only qualitative demonstrations with no user study, no controlled comparison against ad-hoc sweeps, and no quantitative metrics (e.g., insight quality, decision reliability, or time-to-insight) to support superiority.
- [Abstract] Abstract: The soundness assessment is limited because no error analysis, validation metrics, or quantitative results are reported even for the VAST 2011 case that has ground truth; without these, it is impossible to verify whether the workflows actually improve grouping supervision as asserted.
minor comments (2)
- The manuscript would benefit from explicit section numbering or subsection labels when referencing the six-phase workflow components and the three demonstration cases to aid navigation.
- Notation for the IteraScope views (e.g., how semantic color encoding is computed or how HDBSCAN archetypes are thresholded) could be clarified with a small table or pseudocode for reproducibility.
Simulated Author's Rebuttal
We thank the referee for the detailed and constructive feedback. We respond to each major comment below, focusing on the scope of our contribution as a design-oriented visual analytics paper.
read point-by-point responses
-
Referee: [Abstract / Case studies] Abstract and demonstration sections: The central claim that the six-phase workflows 'provide actionable, method-specific guidance ... yielding knowledge about the data that no single "best" result can provide' and outperform ad-hoc exploration is load-bearing for the contribution, yet the three case studies supply only qualitative demonstrations with no user study, no controlled comparison against ad-hoc sweeps, and no quantitative metrics (e.g., insight quality, decision reliability, or time-to-insight) to support superiority.
Authors: The primary contribution is the definition of the six-phase workflows themselves, which structure the supervision process for each method family and treat the full parameter sweep as the analytical object. The case studies illustrate the application of these workflows and the types of cumulative insights they enable (e.g., identifying recurrent archetypes and transition patterns). The manuscript does not assert quantitative superiority or 'outperform' claims via metrics; the language emphasizes guidance and knowledge beyond any single result. We agree a controlled comparison or user study would provide additional evidence but lies outside the current scope. We will revise the abstract and conclusion to remove any implication of outperformance and explicitly note the qualitative nature of the demonstrations. revision: partial
-
Referee: [Abstract] Abstract: The soundness assessment is limited because no error analysis, validation metrics, or quantitative results are reported even for the VAST 2011 case that has ground truth; without these, it is impossible to verify whether the workflows actually improve grouping supervision as asserted.
Authors: The VAST 2011 demonstration uses the ground truth to show how the workflow phases (particularly membership confidence, content inspection, and archetype verification) surface the parameter settings that recover the known structure. However, we acknowledge that no explicit quantitative validation (e.g., agreement metrics with ground truth or error rates across iterations) is reported. This omission weakens the soundness assessment. We will add a dedicated quantitative validation subsection for the VAST case in the revised manuscript, computing relevant metrics from the existing results. revision: yes
- Absence of a formal user study or controlled comparison against ad-hoc exploration, as this would require new empirical data collection and analysis beyond the scope of the current work.
Circularity Check
No circularity: workflows are design contributions with no derivations or fitted quantities
full rationale
The paper describes a visual analytics system and six-phase workflows for exploring parameter sweeps in unsupervised grouping methods. No equations, parameter fitting, predictions, or mathematical derivations appear in the abstract or described content. The central claim is that the structured workflows (quality overview through archetype verification) yield cumulative understanding superior to ad-hoc exploration, but this is presented as a methodological proposal demonstrated via case studies rather than derived from prior results. No self-citation chains, ansatzes, or renamings of known results are invoked as load-bearing steps. The contribution is self-contained as a design artifact; absence of comparative user studies is a validation gap, not a circularity issue.
Axiom & Free-Parameter Ledger
Reference graph
Works this paper leans on
-
[1]
E. Alexander and M. Gleicher. Task-driven comparison of topic models. IEEE Transactions on Visualization and Computer Graphics, 22(1):320– 329, 2016. doi: 10.1109/TVCG.2015.2467618 3, 11
-
[2]
B. Alsallakh, W. Aigner, S. Miksch, and H. Hauser. Reinventing the contingency wheel: Scalable visual analytics of large categorical data. IEEE Transactions on Visualization and Computer Graphics, 18(12):2849– 2858, 2012. doi: 10.1109/TVCG.2012.254 2
-
[3]
G. Andrienko, N. Andrienko, P. Bak, D. Keim, and S. Wrobel.Visual Analytics of Movement. Springer, 2013. doi: 10.1007/978-3-642-37583-5 4
-
[4]
N. Andrienko and G. Andrienko.Exploratory Analysis of Spatial and Temporal Data: A Systematic Approach. Springer, 2006. doi: 10.1007/3 -540-31190-4 3
work page doi:10.1007/3 2006
-
[5]
N. Andrienko, G. Andrienko, L. Adilova, and S. Wrobel. Visual analytics for human-centered machine learning.IEEE Computer Graphics and Applications, 42(1):123–133, 2022. doi: 10.1109/MCG.2021.3130314 3
-
[6]
M. Ankerst, M. M. Breunig, H.-P. Kriegel, and J. Sander. OPTICS: Ordering points to identify the clustering structure.ACM SIGMOD Record, 28(2):49–60, 1999. doi: 10.1145/304182.304187 4
-
[7]
S. Ben-David, U. von Luxburg, and D. Pál. A sober look at clustering stability. InProceedings of the 19th Annual Conference on Learning Theory (COLT), pp. 5–19. Springer, 2006. doi: 10.1007/11776420_4 1, 3
-
[8]
D. M. Blei, A. Y . Ng, and M. I. Jordan. Latent Dirichlet allocation.Journal of Machine Learning Research, 3:993–1022, 2003. 12
2003
-
[9]
R. J. G. B. Campello, D. Moulavi, and J. Sander. Density-based clustering based on hierarchical density estimates. InAdvances in Knowledge Discov- ery and Data Mining (PAKDD), vol. 7819 ofLecture Notes in Computer Science, pp. 160–172. Springer, 2013. doi: 10.1007/978-3-642-37456 -2_14 3
-
[10]
D. Cashman, S. R. Humayoun, F. Heber, K. Park, S. Das, and R. Chang. A user-based visual analytics workflow for exploratory model analysis. Computer Graphics Forum, 38(3):185–199, 2019. doi: 10.1111/cgf.13681 2
-
[11]
M. Cavallo and Ç. Demiralp. Clustrophile 2: Guided visual clustering analysis.IEEE Transactions on Visualization and Computer Graphics, 25(1):267–276, 2019. doi: 10.1109/TVCG.2018.2864477 2, 11
-
[12]
J. Choo, C. Lee, C. K. Reddy, and H. Park. UTOPIAN: User-driven topic modeling based on interactive nonnegative matrix factorization.IEEE Transactions on Visualization and Computer Graphics, 19(12):1992–2001,
1992
-
[13]
doi: 10.1109/TVCG.2013.212 2, 11
-
[14]
J. Chuang, C. D. Manning, and J. Heer. Termite: Visualization techniques for assessing textual topic models. InProceedings of the International Working Conference on Advanced Visual Interfaces (AVI), pp. 74–77, 2012. doi: 10.1145/2254556.2254572 2
-
[15]
J. Chuang, D. Ramage, C. Manning, and J. Heer. Interpretation and trust: Designing model-driven visualizations for text analysis. InProceedings of the SIGCHI Conference on Human Factors in Computing Systems (CHI), pp. 443–452. ACM, 2012. doi: 10.1145/2207676.2207738 2
- [16]
-
[17]
W. Cui, S. Liu, L. Tan, C. Shi, Y . Song, Z. Gao et al. TextFlow: Towards better understanding of evolving topics in text.IEEE Transactions on Visualization and Computer Graphics, 17(12):2412–2421, 2011. doi: 10. 1109/TVCG.2011.239 3
2011
-
[18]
M. El-Assady, R. Sevastjanova, F. Sperrle, D. Keim, and C. Collins. Progressive learning of topic modeling parameters: A visual analytics framework.IEEE Transactions on Visualization and Computer Graphics, 24(1):382–391, 2018. doi: 10.1109/TVCG.2017.2745080 2
-
[19]
Espadoto, R
M. Espadoto, R. M. Martins, A. Kerren, N. S. T. Hirata, and A. C. Telea. Toward a quantitative survey of dimensionality reduction techniques.IEEE Transactions on Visualization and Computer Graphics, 27(3):2153–2173,
-
[20]
doi: 10.1109/TVCG.2019.2944182 3
-
[21]
Ester, H.-P
M. Ester, H.-P. Kriegel, J. Sander, and X. Xu. A density-based algorithm for discovering clusters in large spatial databases with noise.Proceedings of the Second International Conference on Knowledge Discovery and Data Mining (KDD), pp. 226–231, 1996. 4
1996
-
[22]
N. Ferreira, J. Poco, H. T. V o, J. Freire, and C. T. Silva. Visual exploration of big spatio-temporal urban data: A study of New York City taxi trips. IEEE Transactions on Visualization and Computer Graphics, 19(12):2149– 2158, 2013. doi: 10.1109/TVCG.2013.226 3
-
[23]
A. L. N. Fred and A. K. Jain. Combining multiple clusterings using evi- dence accumulation.IEEE Transactions on Pattern Analysis and Machine Intelligence, 27(6):835–850, 2005. doi: 10.1109/TPAMI.2005.113 2, 3
-
[24]
M. Gleicher, D. Albers, R. Walker, I. Jusufi, C. D. Hansen, and J. C. Roberts. Visual comparison for information visualization.Information Visualization, 10(4):289–309, 2011. doi: 10.1177/1473871611416549 2
-
[25]
BERTopic: Neural topic modeling with a class-based TF-IDF procedure
M. Grootendorst. BERTopic: Neural topic modeling with a class-based TF-IDF procedure.arXiv preprint arXiv:2203.05794, 2022. doi: 10. 48550/arXiv.2203.05794 3, 12
work page internal anchor Pith review Pith/arXiv arXiv 2022
-
[26]
D. Guo, J. Chen, A. MacEachren, and K. Liao. A visualization system for space-time and multivariate patterns (vis-stamp).IEEE Transactions on Visualization and Computer Graphics, 12(6):1461–1474, 2006. doi: 10. 1109/TVCG.2006.84 3
2006
-
[27]
C. Hennig. Cluster-wise assessment of cluster stability.Computational Statistics & Data Analysis, 52(1):258–271, 2007. doi: 10.1016/j.csda. 2006.11.025 2, 3
-
[28]
Huang, Y
H. Huang, Y . Wang, and C. Rudin. Navigating the effect of parametrization for dimensionality reduction. InProceedings of the 38th International Conference on Neural Information Processing Systems, NIPS ’24, art. no. 413, 43 pages. Curran Associates Inc., Red Hook, NY , USA, 2024. 5
2024
-
[29]
P. Isenberg, F. Heimerl, S. Koch, T. Isenberg, P. Xu, C. D. Stolper et al. vispubdata.org: A metadata collection about IEEE visualization (VIS) publications.IEEE Transactions on Visualization and Computer Graphics, 23(9):2199–2206, 2017. doi: 10.1109/TVCG.2016.2615308 7
-
[30]
T. Isenberg, P. Isenberg, J. Chen, M. Sedlmair, and T. Möller. A systematic review on the practice of evaluating visualization.IEEE Transactions on Visualization and Computer Graphics, 19(12):2818–2827, Dec 2013. doi: 10.1109/TVCG.2013.126 12
-
[31]
D. A. Keim, G. Andrienko, J.-D. Fekete, C. Görg, J. Kohlhammer, and G. Melançon. Visual analytics: Definition, process, and challenges. In Information Visualization: Human-Centered Issues and Perspectives, pp. 154–175. Springer, 2008. doi: 10.1007/978-3-540-70956-5_7 3
-
[32]
M. Kim, K. Kang, D. Park, J. Choo, and N. Elmqvist. TopicLens: Efficient multi-level visual topic exploration of large-scale document collections. IEEE Transactions on Visualization and Computer Graphics, 23(1):151– 160, 2017. doi: 10.1109/TVCG.2016.2598445 2
-
[33]
R. Kosara, F. Bendix, and H. Hauser. Parallel sets: Interactive exploration and visual analysis of categorical data.IEEE Transactions on Visualization and Computer Graphics, 12(4):558–568, 2006. doi: 10.1109/TVCG.2006. 76 3
-
[34]
B. C. Kwon, B. Eysenbach, J. Verma, K. Ng, C. De Filippi, W. F. Stewart et al. ClusterVision: Visual supervision of unsupervised clustering.IEEE Transactions on Visualization and Computer Graphics, 24(1):142–151,
-
[35]
doi: 10.1109/TVCG.2017.2745085 2, 11
-
[36]
H. Lam, E. Bertini, P. Isenberg, C. Plaisant, and S. Carpendale. Empirical studies in information visualization: Seven scenarios.IEEE Transactions on Visualization and Computer Graphics, 18(9):1520–1536, Sep. 2012. doi: 10.1109/TVCG.2011.279 12
-
[37]
D. D. Lee and H. S. Seung. Learning the parts of objects by non-negative matrix factorization.Nature, 401:788–791, 1999. doi: 10.1038/44565 4
-
[38]
McInnes, J
L. McInnes, J. Healy, and S. Astels. hdbscan: Hierarchical density based clustering.Journal of Open Source Software, 2(11):205, 2017. doi: 10. 21105/joss.00205 3, 4, 5
2017
-
[39]
UMAP: Uniform Manifold Approximation and Projection for Dimension Reduction
L. McInnes, J. Healy, and J. Melville. UMAP: Uniform manifold ap- proximation and projection for dimension reduction.arXiv preprint arXiv:1802.03426, 2018. 5
work page internal anchor Pith review Pith/arXiv arXiv 2018
-
[40]
Monti, P
S. Monti, P. Tamayo, J. Mesirov, and T. Golub. Consensus clustering: A resampling-based method for class discovery and visualization of gene expression microarray data.Machine Learning, 52:91–118, 2003. doi: 10. 1023/A:1023949509487 2, 3
2003
-
[41]
L. G. Nonato and M. Aupetit. Multidimensional projection for visual ana- lytics: Linking techniques with distortions, tasks, and layout enrichment. IEEE Transactions on Visualization and Computer Graphics, 25(8):2650– 2673, 2019. doi: 10.1109/TVCG.2018.2846735 3
-
[42]
Pister, P
A. Pister, P. Buono, J.-D. Fekete, C. Plaisant, and P. Valdivia. Integrating prior knowledge in mixed-initiative social network clustering.IEEE Transactions on Visualization and Computer Graphics, 27(2):1775–1785,
-
[43]
doi: 10.1109/TVCG.2020.3030347 2
-
[44]
P. Riehmann, M. Hanfler, and B. Froehlich. Interactive Sankey diagrams. pp. 233–240, 2005. doi: 10.1109/INFVIS.2005.1532152 3
-
[45]
M. Röder, A. Both, and A. Hinneburg. Exploring the space of topic coherence measures. InProceedings of the Eighth ACM International Conference on Web Search and Data Mining (WSDM), pp. 399–408, 2015. doi: 10.1145/2684822.2685324 4
-
[46]
M. Rosvall and C. T. Bergstrom. Mapping change in large networks.PLoS ONE, 5(1):e8694, 2010. doi: 10.1371/journal.pone.0008694 3
-
[47]
P. J. Rousseeuw. Silhouettes: A graphical aid to the interpretation and validation of cluster analysis.Journal of Computational and Applied Mathematics, 20:53–65, 1987. doi: 10.1016/0377-0427(87)90125-7 4
- [48]
-
[49]
M. Sedlmair, C. Heinzl, S. Bruckner, H. Piringer, and T. Möller. Visual parameter space analysis: A conceptual framework.IEEE Transactions on Visualization and Computer Graphics, 20(12):2161–2170, 2014. doi: 10.1109/TVCG.2014.2346321 2
-
[50]
M. Sedlmair, A. Tatu, T. Munzner, and M. Tory. A taxonomy of visual cluster separation factors.Computer Graphics Forum, 31(3pt4):1335– 1344, 2012. doi: 10.1111/j.1467-8659.2012.03125.x 3
-
[51]
J. Seo and B. Shneiderman. A rank-by-feature framework for interactive exploration of multidimensional data.Information Visualization, 4(2):96– 113, 2005. doi: 10.1057/palgrave.ivs.9500091 12
-
[52]
Sievert and K
C. Sievert and K. Shirley. LDAvis: A method for visualizing and inter- preting topics. InProceedings of the Workshop on Interactive Language Learning, Visualization, and Interfaces, pp. 63–70, 2014. doi: 10.3115/ v1/W14-3110 2, 11
2014
- [53]
-
[54]
Strehl and J
A. Strehl and J. Ghosh. Cluster ensembles — a knowledge reuse frame- work for combining multiple partitions.Journal of Machine Learning Research, 3:583–617, 2002. 2, 3
2002
-
[55]
van der Maaten and G
L. van der Maaten and G. Hinton. Visualizing data using t-SNE.Journal of Machine Learning Research, 9:2579–2605, 2008. 5
2008
-
[56]
von Luxburg
U. von Luxburg. Clustering stability: An overview.Foundations and Trends in Machine Learning, 2(3):235–274, 2010. doi: 10.1561/ 2200000008 1, 2, 3
2010
-
[57]
Y . Wang, H. Huang, C. Rudin, and Y . Shaposhnik. Understanding how dimension reduction tools work: An empirical approach to deciphering t-SNE, UMAP, TriMap, and PaCMAP for data visualization.Journal of Machine Learning Research, 22(201):1–73, 2021. 3
2021
-
[58]
Y . Wang, Y . Sun, H. Huang, and C. Rudin. Dimension reduction with locally adjusted graphs. InProceedings of AAAI’25/IAAI’25/EAAI’25, art. no. 2382, 9 pages. AAAI Press, 2025. doi: 10.1609/aaai.v39i20.35436 5
-
[59]
J. Wenskovitch, I. Crandell, N. Ramakrishnan, L. House, S. Leman, and C. North. Towards a systematic combination of dimension reduction and clustering in visual analytics.IEEE Transactions on Visualization and Computer Graphics, 24(1):131–141, 2018. doi: 10.1109/TVCG.2017. 2745258 2
-
[60]
Z. Yu, X. Li, P. Liu, and J. Tao. Parallel clusters: Visual comparison of embeddings based on multi-scale neighborhood analysis.IEEE Transac- tions on Visualization and Computer Graphics, 32(3):2758–2772, 2026. doi: 10.1109/TVCG.2026.3654590 3, 11
discussion (0)
Sign in with ORCID, Apple, or X to comment. Anyone can read and Pith papers without signing in.