The Good, the Bad, and the Ugly of Markov Boundary for Tabular Prediction
Pith reviewed 2026-06-29 08:34 UTC · model grok-4.3
The pith
Restricting tabular regressors to the true Markov boundary improves accuracy, especially in large sparse tables, but causal discovery rarely recovers a useful boundary.
A machine-rendered reading of the paper's core claim, the machinery that carries it, and where it could break.
Core claim
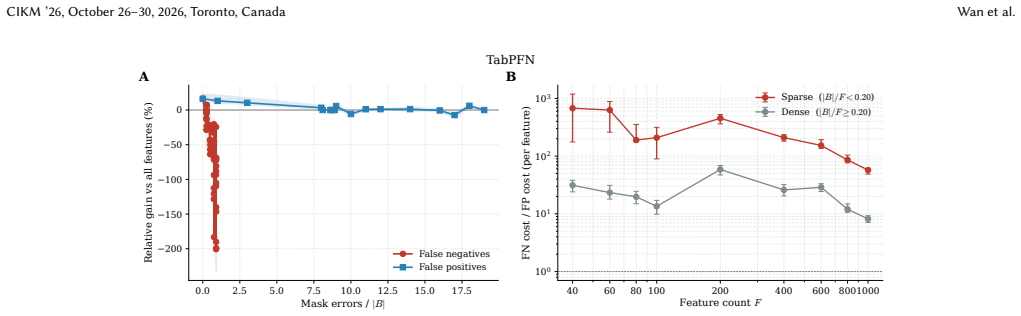
Under standard graphical assumptions the Markov boundary is the minimal feature set rendering the target conditionally independent of all remaining variables. On the SCM3K benchmark of 3450 tasks, training six regressors on the oracle boundary substantially improves prediction over the full feature set, and the improvement grows with feature count. Boundaries recovered by existing causal discovery methods produce masks that rarely improve upon the full feature set because discovery optimizes structural recovery rather than prediction, false negatives and positives incur asymmetric predictive costs, and the exact boundary is only one of many feature sets that beat all features.
What carries the argument
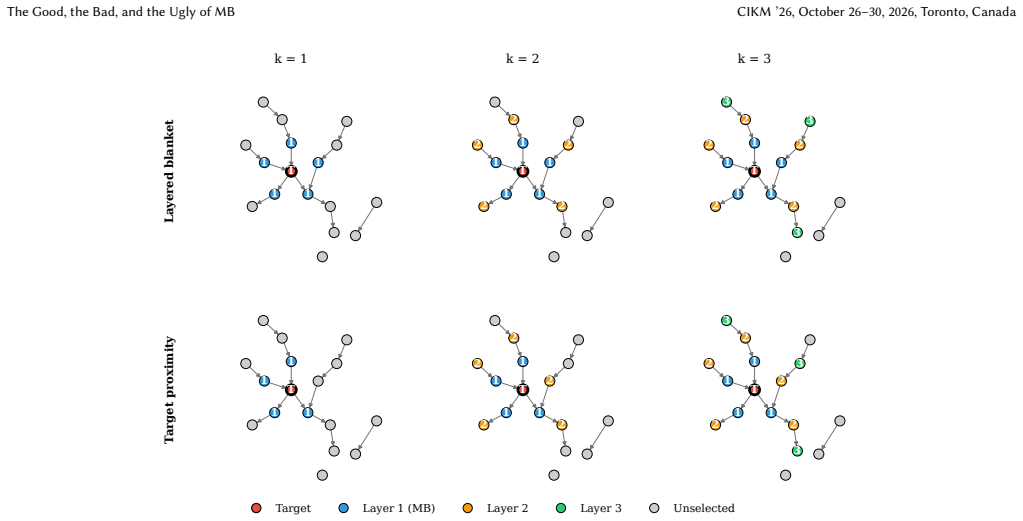
The Markov boundary: the smallest set of features that renders the target conditionally independent of all other features under standard graphical assumptions.
If this is right
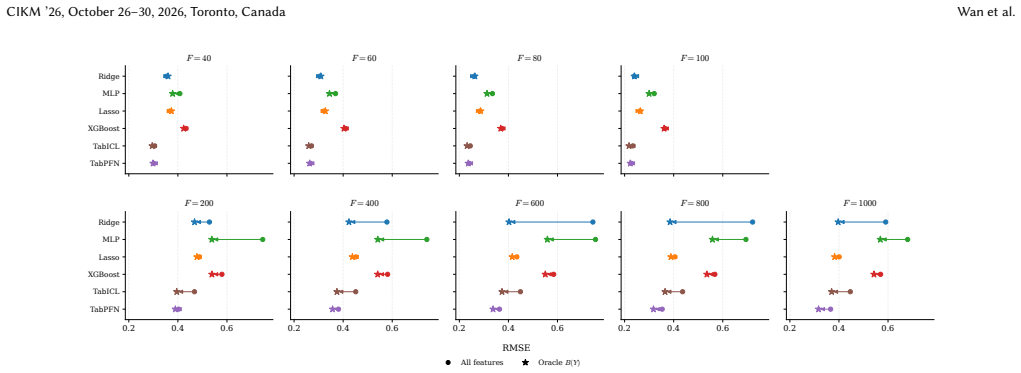
- Restricting regressors to the oracle Markov boundary improves prediction accuracy over full-feature training on high-dimensional tabular data.
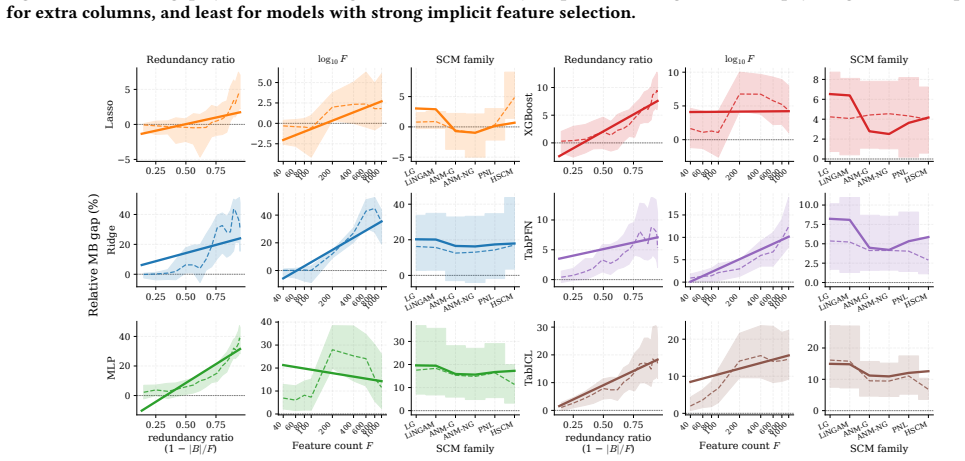
- The accuracy gain from the oracle boundary grows as the number of features increases and the table becomes sparser.
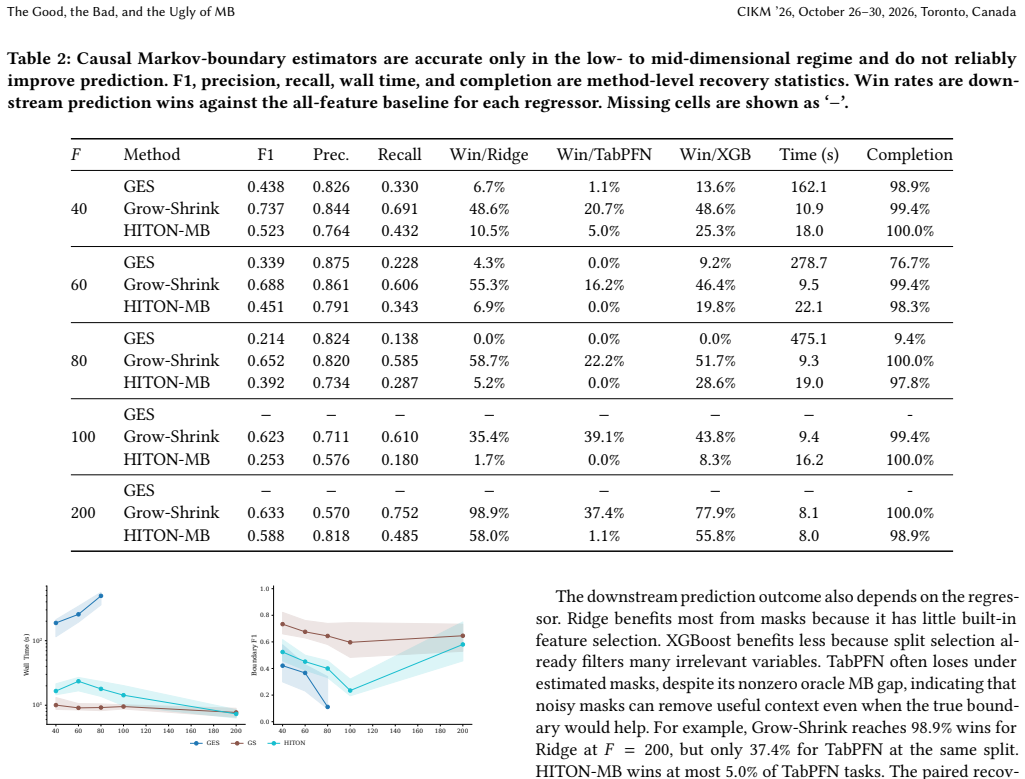
- Existing causal discovery estimators exhaust compute before reaching the high-dimensional regime where boundary use would help most.
- False negatives in boundary recovery carry higher predictive cost than false positives.
- Many feature sets besides the exact Markov boundary already outperform training on all columns.
Where Pith is reading between the lines
- Feature selection for prediction may need algorithms that optimize directly for downstream model error rather than graph recovery metrics.
- Tabular models could incorporate internal mechanisms to detect and ignore redundant features without recovering an explicit causal boundary.
- The existence of many sufficient feature sets suggests room for approximate or heuristic selection methods tuned to a specific regressor.
- Hybrid causal-predictive pipelines might close the gap between oracle and recovered boundaries on real tabular tasks.
Load-bearing premise
Standard graphical assumptions hold such that the Markov boundary is the minimal set of features rendering the target conditionally independent of all others.
What would settle it
On SCM3K tasks with 500 or more features, compare test error of regressors trained on boundaries recovered by standard causal discovery algorithms against the same regressors trained on the full feature set; if the recovered-mask models do not underperform the full set, the claim that discovery pipelines fail is falsified.
Figures
read the original abstract
Under standard graphical assumptions, the Markov boundary of a target variable is the smallest set of features that renders every other feature redundant. Once the boundary is observed, the target is conditionally independent of the rest of the table. This is a tempting object for tabular prediction, since it names exactly the columns a model should need. Yet modern regressors are still trained on the full feature set. We ask whether the Markov boundary is genuinely useful for prediction on SCM3K, a 3,450-task synthetic SCM benchmark with feature counts from 40 to 1000 and six SCM families, evaluated with six regressors. The answer is more nuanced than the theory suggests. Restricting a regressor to the oracle boundary often improves prediction substantially, and the improvement grows as the feature space becomes larger and sparser. But the natural pipeline of recovering the boundary with causal discovery and training on the recovered mask does not deliver. Existing estimators exhaust the compute budget before reaching the regime where the boundary helps most, and even where they run they rarely beat the full feature set. We trace this to three causes. Discovery optimizes structural recovery rather than prediction. False negatives and false positives carry sharply asymmetric predictive cost. The exact boundary is only one of many feature sets that beat all features. We then develop what these facts imply for prediction-aligned feature selection and for tabular models that learn to use causal structure.
Editorial analysis
A structured set of objections, weighed in public.
Referee Report
Summary. The paper claims that on the SCM3K synthetic benchmark (3,450 tasks from six SCM families, feature counts 40-1000), restricting regressors to the oracle Markov boundary often improves prediction substantially, with gains increasing in larger and sparser regimes. However, the pipeline of recovering the boundary via causal discovery and training on the recovered mask fails to deliver comparable gains. The authors trace the failure to three factors: discovery optimizing structural recovery rather than prediction, asymmetric predictive costs of false negatives versus positives, and the existence of multiple feature sets that outperform the full set.
Significance. If the results hold, this provides a controlled large-scale empirical demonstration of the gap between the theoretical utility of Markov boundaries for conditional independence and their practical value when recovered by existing causal discovery methods. The synthetic benchmark with known ground-truth SCMs is a clear strength, enabling direct oracle-vs-recovered comparisons and falsifiable observations about when boundaries help prediction. This can inform development of prediction-aligned rather than structure-aligned feature selection.
major comments (1)
- [Abstract] Abstract: the central claim that 'the improvement grows as the feature space becomes larger and sparser' is load-bearing for the headline result, yet the abstract provides no reference to a specific table, figure, or statistical test (e.g., trend across dimension bins or p-values) that would allow verification of the scaling behavior.
minor comments (2)
- [Abstract] Abstract: the six SCM families and six regressors are referenced but not named; naming them would improve immediate readability without requiring the reader to reach the methods section.
- [Abstract] Abstract: the sentence beginning 'Existing estimators exhaust the compute budget...' would be clearer if it quantified the budget (e.g., wall-clock or memory limits) or the dimension threshold at which the boundary becomes beneficial.
Simulated Author's Rebuttal
We thank the referee for the positive evaluation, the recognition of the benchmark's controlled nature, and the recommendation of minor revision. We address the single major comment below.
read point-by-point responses
-
Referee: [Abstract] Abstract: the central claim that 'the improvement grows as the feature space becomes larger and sparser' is load-bearing for the headline result, yet the abstract provides no reference to a specific table, figure, or statistical test (e.g., trend across dimension bins or p-values) that would allow verification of the scaling behavior.
Authors: We agree that the abstract claim would benefit from an explicit pointer to the supporting evidence for verifiability. The scaling behavior (larger gains in higher-dimensional and sparser regimes) is shown via binned results in Figure 5 (mean R2 improvement vs. feature count bins) and Table 4 (stratified by sparsity), with standard errors across the six SCM families. In the revised manuscript we will append a brief parenthetical '(see Figure 5)' to the relevant abstract sentence. This is a minor textual change that preserves abstract length while addressing the concern. revision: yes
Circularity Check
No significant circularity identified
full rationale
This paper presents an empirical evaluation on the external SCM3K synthetic benchmark rather than any derivation chain. The headline result (oracle Markov boundaries improve regressors while recovered ones do not) is measured directly on data generated from known SCMs, where the invoked graphical assumptions hold by construction. No equations, fitted parameters, or self-citations are used to derive the central claims; the three explanatory factors are presented as post-hoc observations. The study is therefore self-contained against external benchmarks with no load-bearing reductions to inputs or prior author work.
Axiom & Free-Parameter Ledger
axioms (1)
- domain assumption Standard graphical assumptions hold such that the Markov boundary is the minimal set rendering the target conditionally independent of all others
Reference graph
Works this paper leans on
-
[1]
Constantin F Aliferis, Alexander Statnikov, Ioannis Tsamardinos, Subramani Mani, and Xenofon D Koutsoukos. 2010. Local causal and Markov blanket in- duction for causal discovery and feature selection for classification part I: Algo- rithms and empirical evaluation.Journal of Machine Learning Research11 (2010), 171–234
2010
-
[2]
Constantin F Aliferis, Ioannis Tsamardinos, and Alexander Statnikov. 2003. HI- TON: a novel Markov Blanket algorithm for optimal variable selection. InAMIA annual symposium proceedings, Vol. 2003. 21
2003
-
[3]
Cresswell, and Rahul Krishnan
Vahid Balazadeh, Hamidreza Kamkari, Valentin Thomas, Junwei Ma, Bingru Li, Jesse C. Cresswell, and Rahul Krishnan. 2026. CausalPFN: Amortized Causal Effect Estimation via In-Context Learning. InThe Thirty-ninth Annual Confer- ence on Neural Information Processing Systems. https://openreview.net/forum? id=RblaNJGx8C
2026
-
[4]
Philippe Brouillard, Chandler Squires, Jonas Wahl, Konrad K"ording, Karen Sachs, Alexandre Drouin, and Dhanya Sridhar. 2025. The Landscape of Causal Discovery Data: Grounding Causal Discovery in Real-World Applications. In Proceedings of the Fourth Conference on Causal Learning and Reasoning (Proceed- ings of Machine Learning Research, Vol. 275), Biwei Hu...
2025
-
[5]
Tianqi Chen and Carlos Guestrin. 2016. XGBoost: A Scalable Tree Boosting Sys- tem. InProceedings of the 22nd ACM SIGKDD International Conference on Knowl- edge Discovery and Data Mining(San Francisco, California, USA)(KDD ’16). As- sociation for Computing Machinery, New York, NY, USA, 785–794. doi:10.1145/ 2939672.2939785
-
[6]
David Maxwell Chickering. 2003. Optimal structure identification with greedy search.J. Mach. Learn. Res.3, null (March 2003), 507–554. doi:10.1162/ 153244303321897717
2003
-
[7]
Paul Erdős and Alfréd Rényi. 1960. On the evolution of random graphs.Publica- tions of the Mathematical Institute of the Hungarian Academy of Sciences5 (1960), 17–61
1960
-
[8]
2024.causalAssembly: Generating Realistic Pro- duction Data for Benchmarking Causal Discovery
Konstantin Göbler, Tobias Windisch, Mathias Drton, Tim Pychynski, Martin Roth, and Steffen Sonntag. 2024.causalAssembly: Generating Realistic Pro- duction Data for Benchmarking Causal Discovery. InProceedings of the Third Conference on Causal Learning and Reasoning (Proceedings of Machine Learning Research, Vol. 236), Francesco Locatello and Vanessa Didel...
2024
-
[9]
https://proceedings.mlr.press/v236/gobler24a.html
-
[10]
The Elements of Statistical Learning: Data Mining, Inference, and Prediction
Trevor Hastie, Robert Tibshirani, and Jerome Friedman. 2009.The Elements of Statistical Learning: Data Mining, Inference, and Prediction(2 ed.). Springer, New York, NY. doi:10.1007/978-0-387-84858-7
-
[11]
Hoerl and Robert W
Arthur E. Hoerl and Robert W. Kennard. 1970. Ridge Regression: Biased Estimation for Nonorthogonal Problems.Technometrics12, 1 (1970), 55–
1970
-
[12]
arXiv:https://doi.org/10.1080/00401706.1970.10488634 doi:10.1080/00401706. 1970.10488634
-
[13]
Noah Hollmann, Samuel Müller, Katharina Eggensperger, and Frank Hutter
-
[14]
InThe Eleventh International Conference on Learning Representations
TabPFN: A Transformer That Solves Small Tabular Classification Problems in a Second. InThe Eleventh International Conference on Learning Representations. https://openreview.net/forum?id=cp5PvcI6w8_
-
[15]
Kurt Hornik, Maxwell Stinchcombe, and Halbert White. 1989. Multilayer feed- forward networks are universal approximators.Neural Networks2, 5 (1989), 359–366. doi:10.1016/0893-6080(89)90020-8
-
[16]
2009.Probabilistic Graphical Models: Principles and Techniques - Adaptive Computation and Machine Learning
Daphne Koller and Nir Friedman. 2009.Probabilistic Graphical Models: Principles and Techniques - Adaptive Computation and Machine Learning. The MIT Press
2009
-
[17]
Nan M. Laird and James H. Ware. 1982. Random-Effects Models for Longitudinal Data.Biometrics38, 4 (1982), 963–974. http://www.jstor.org/stable/2529876
-
[18]
Yuchen Ma, Dennis Frauen, Emil Javurek, and Stefan Feuerriegel. 2026. Foun- dation Models for Causal Inference via Prior-Data Fitted Networks. InThe Four- teenth International Conference on Learning Representations. https://openreview. net/forum?id=d2L1ndOKjq
2026
-
[19]
Daniel Marbach, James C Costello, Robert Küffner, Nicole M Vega, Robert J Prill, Diogo M Camacho, Kyle R Allison, Manolis Kellis, James J Collins, et al. 2012. Wisdom of crowds for robust gene network inference.Nature methods9, 8 (2012), 796–804
2012
-
[20]
Prill, Thomas Schaffter, Claudio Mat- tiussi, Dario Floreano, and Gustavo Stolovitzky
Daniel Marbach, Robert J. Prill, Thomas Schaffter, Claudio Mat- tiussi, Dario Floreano, and Gustavo Stolovitzky. 2010. Revealing strengths and weaknesses of methods for gene network inference.Pro- ceedings of the National Academy of Sciences107, 14 (2010), 6286–
2010
-
[21]
arXiv:https://www.pnas.org/doi/pdf/10.1073/pnas.0913357107 doi:10.1073/pnas.0913357107
-
[22]
Dimitris Margaritis and Sebastian Thrun. 1999. Bayesian Network Induction via Local Neighborhoods. InAdvances in Neural Informa- tion Processing Systems, S. Solla, T. Leen, and K. Müller (Eds.), Vol. 12. MIT Press. https://proceedings.neurips.cc/paper_files/paper/1999/file/ 5d79099fcdf499f12b79770834c0164a-Paper.pdf
1999
-
[23]
Christopher Meek. 1995. Causal inference and causal explanation with back- ground knowledge.Proceedings of the Eleventh Conference on Uncertainty in Artificial Intelligence(1995), 403–410
1995
-
[24]
Wang Miao, Zhi Geng, and Eric J Tchetgen Tchetgen. 2018. Identifying causal effects with proxy variables of an unmeasured confounder.Biometrika 105, 4 (12 2018), 987–993. arXiv:https://academic.oup.com/biomet/article- pdf/105/4/987/27121264/asy038.pdf doi:10.1093/biomet/asy038
-
[25]
Samuel Müller, Noah Hollmann, Sebastian Pineda Arango, Josif Grabocka, and Frank Hutter. 2022. Transformers Can Do Bayesian Inference. InInterna- tional Conference on Learning Representations. https://openreview.net/forum? id=KSugKcbNf9
2022
-
[26]
Samuel Müller, Arik Reuter, Noah Hollmann, David Rügamer, and Frank Hutter
-
[27]
InProceedings of the 42nd International Conference on Machine Learning (Proceedings of Machine Learning Research, Vol
Position: The Future of Bayesian Prediction Is Prior-Fitted. InProceedings of the 42nd International Conference on Machine Learning (Proceedings of Machine Learning Research, Vol. 267). PMLR, Vancouver, Canada. https://proceedings.mlr. press/v267/muller25d.html
-
[28]
Rainer Opgen-Rhein and Korbinian Strimmer. 2007. From correlation to causa- tion networks: a simple approximate learning algorithm and its application to high-dimensional plant gene expression data.BMC systems biology1, 1 (2007), 37
2007
-
[29]
1988.Probabilistic Reasoning in Intelligent Systems: Networks of Plau- sible Inference
Judea Pearl. 1988.Probabilistic Reasoning in Intelligent Systems: Networks of Plau- sible Inference. Morgan Kaufmann Publishers Inc., San Francisco, CA, USA
1988
-
[30]
2009.Causality: Models, Reasoning and Inference(2nd ed.)
Judea Pearl. 2009.Causality: Models, Reasoning and Inference(2nd ed.). Cam- bridge University Press, USA
2009
-
[31]
2017.Elements of Causal Inference: Foundations and Learning Algorithms
Jonas Peters, Dominik Janzing, and Bernhard Schölkopf. 2017.Elements of Causal Inference: Foundations and Learning Algorithms. MIT Press, Cambridge, MA
2017
-
[32]
Jingang Qu, David Holzmüller, Gaël Varoquaux, and Marine Le Morvan. 2025. TabICL: A Tabular Foundation Model for In-Context Learning on Large Data. In Proceedings of the 42nd International Conference on Machine Learning (Proceed- ings of Machine Learning Research, Vol. 267). PMLR, Vancouver, Canada, 50817– 50847. https://proceedings.mlr.press/v267/qu25d.html
2025
-
[33]
Jingang Qu, David Holzmüller, Gaël Varoquaux, and Marine Le Morvan
-
[34]
TabICLv2: A better, faster, scalable, and open tabular foundation model.arXiv:2602.11139, 2026
TabICLv2: A better, faster, scalable, and open tabular foundation model. arXiv:2602.11139 [cs.LG] https://arxiv.org/abs/2602.11139
-
[35]
Alexander Reisach, Christof Seiler, and Sebastian Weichwald. 2021. Beware of the simulated dag! causal discovery benchmarks may be easy to game.Advances in Neural Information Processing Systems34 (2021), 27772–27784
2021
- [36]
-
[37]
Marco Scutari. 2010. Learning Bayesian networks with the bnlearn R package. Journal of statistical software35 (2010), 1–22
2010
-
[38]
2000.Causation, Prediction, and Search(2 ed.)
Peter Spirtes, Clark Glymour, and Richard Scheines. 2000.Causation, Prediction, and Search(2 ed.). MIT Press, Cambridge, MA
2000
-
[39]
Robert Tibshirani. 1996. Regression Shrinkage and Selection Via the Lasso.Jour- nal of the Royal Statistical Society: Series B (Methodological)58, 1 (01 1996), 267–
1996
-
[40]
doi:10.1111/j.2517-6161.1996.tb02080.x
-
[41]
Aliferis, and Alexander Statnikov
Ioannis Tsamardinos, Constantin F. Aliferis, and Alexander Statnikov. 2003. Al- gorithms for Large Scale Markov Blanket Discovery. InProceedings of the Six- teenth International Florida Artificial Intelligence Research Society Conference (FLAIRS 2003). AAAI Press, Menlo Park, CA, 376–381. https://aaai.org/papers/ flairs-2003-073/
2003
-
[42]
Ioannis Tsamardinos, Laura E Brown, and Constantin F Aliferis. 2006. The max-min hill-climbing Bayesian network structure learning algorithm.Machine Learning65, 1 (2006), 31–78
2006
-
[43]
Tim Van den Bulcke, Koenraad Van Leemput, Bart Naudts, Piet van Remortel, Hongwu Ma, Alain Verschoren, Bart De Moor, and Kathleen Marchal. 2006. Syn- TReN: a generator of synthetic gene expression data for design and analysis of structure learning algorithms.BMC bioinformatics7, 1 (2006), 43
2006
-
[44]
Thomas Verma and Judea Pearl. 1990. Equivalence and synthesis of causal mod- els.Proceedings of the Sixth Conference on Uncertainty in Artificial Intelligence (1990), 220–227
1990
-
[45]
Wooldridge
Jefrey M. Wooldridge. 2010.Econometric Analysis of Cross Section and Panel Data. The MIT Press. http://www.jstor.org/stable/j.ctt5hhcfr
2010
-
[46]
Liyuan Xu, Heishiro Kanagawa, and Arthur Gretton. 2021. Deep Proxy Causal Learning and its Application to Confounded Bandit Policy Evaluation. InAd- vances in Neural Information Processing Systems, M. Ranzato, A. Beygelzimer, Y. Dauphin, P.S. Liang, and J. Wortman Vaughan (Eds.), Vol. 34. Curran As- sociates, Inc., 26264–26275. https://proceedings.neurips...
2021
-
[47]
Naiyu Yin, Hanjing Wang, Yue Yu, Tian Gao, Amit Dhurandhar, and Qiang Ji
-
[48]
InEuropean Conference on Computer Vision
Integrating Markov blanket discovery into causal representation learning for domain generalization. InEuropean Conference on Computer Vision. Springer, 271–288
-
[49]
Kui Yu, Lin Liu, Jiuyong Li, Weiping Ding, and Thuc Duy Le. 2020. Causality- based feature selection: Methods and evaluations.Comput. Surveys53, 5 (2020), 1–36
2020
discussion (0)
Sign in with ORCID, Apple, or X to comment. Anyone can read and Pith papers without signing in.