Spectral Reach: Understanding Neural Scaling as Progress into the Spectral Tail
Pith reviewed 2026-06-28 23:01 UTC · model grok-4.3
The pith
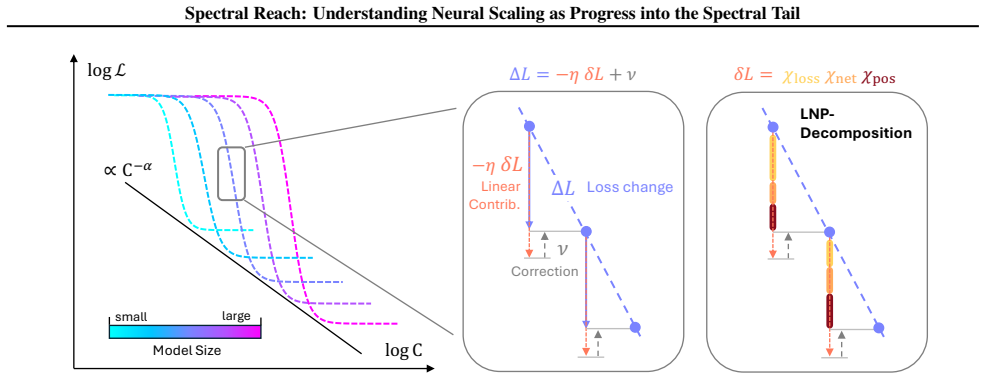
Larger models achieve lower losses by sustaining learning on weaker spectral signals inaccessible to smaller ones.
A machine-rendered reading of the paper's core claim, the machinery that carries it, and where it could break.
Core claim
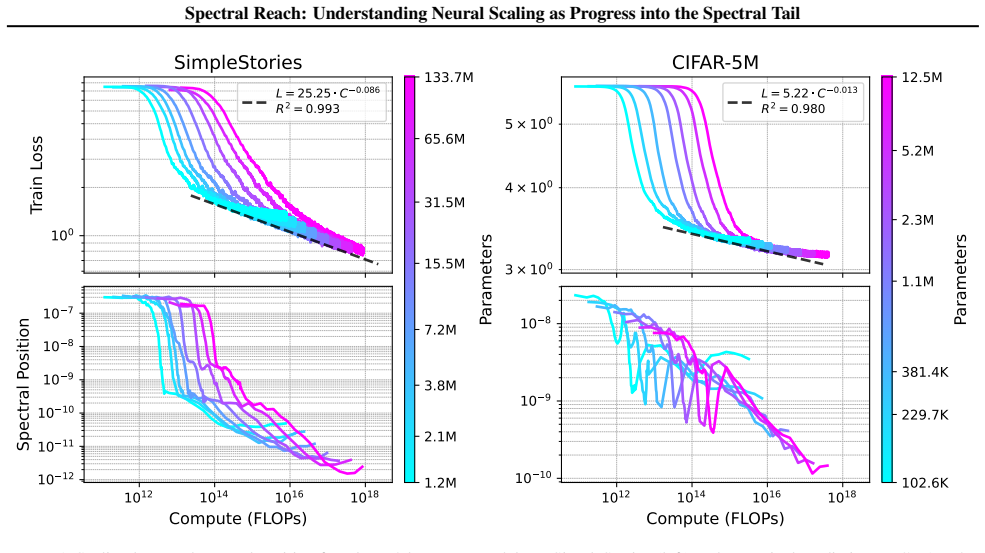
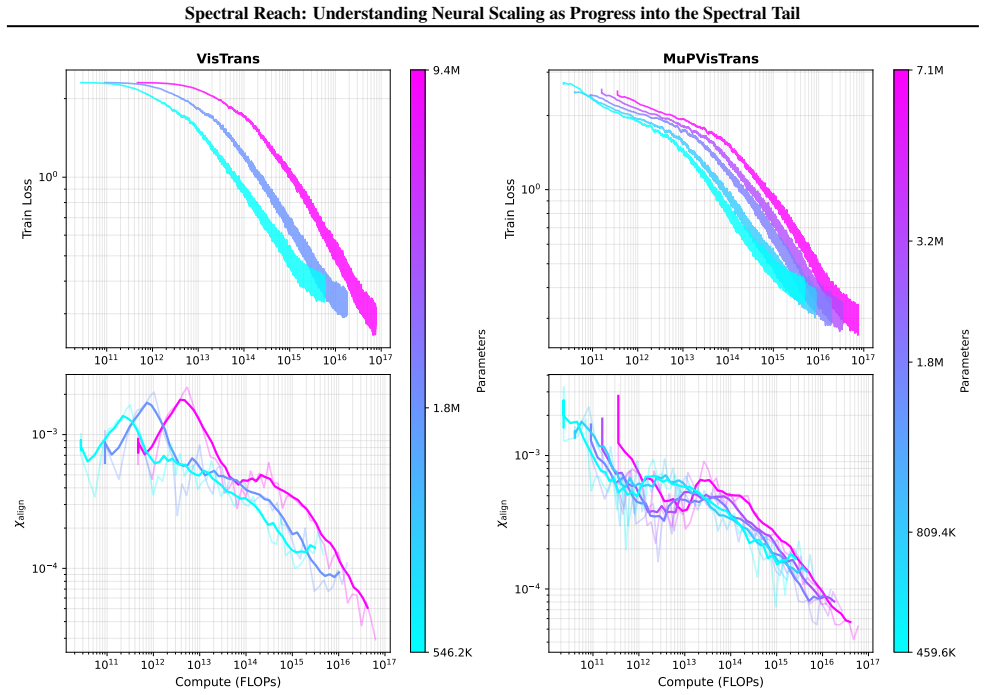
Larger models reach further into the spectral tail of the empirical neural tangent kernel than smaller models. This size-dependent spectral reach allows them to keep reducing loss on progressively weaker eigenmodes that remain inaccessible to smaller networks, providing a concrete account of why scaling improves performance.
What carries the argument
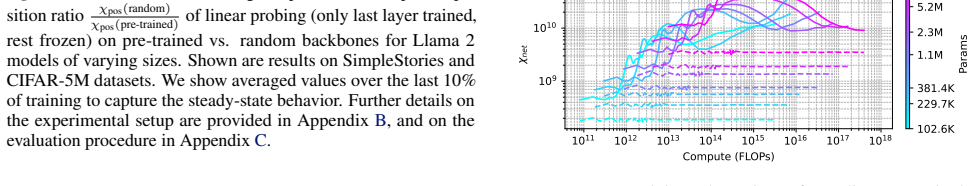
spectral position: a scalable scalar that identifies the current eigenmode of the empirical neural tangent kernel driving loss reduction; spectral reach is the model-size-dependent depth into weaker modes enabled by this position.
If this is right
- Training moves from dominant eigenmodes into weaker ones as loss decreases.
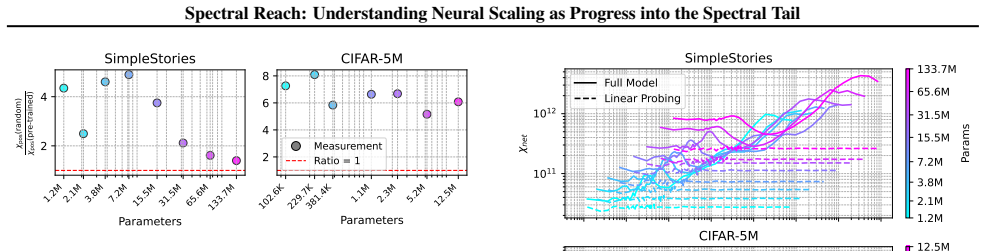
- Feature learning sustains gradient flow into the tail while frozen representations stall earlier.
- Architecture choices that preserve adaptive amplification of gradients should increase spectral reach.
- Optimizer modifications targeting tail modes could replicate scaling gains without increasing model size.
Where Pith is reading between the lines
- Spectral reach may serve as a diagnostic for whether a given architecture will continue scaling at a fixed compute budget.
- The same measurement could be applied to kernel methods outside neural networks to test whether tail access is a general requirement for continued improvement.
- If spectral position can be estimated cheaply, it might enable early stopping rules that predict final performance without full training.
Load-bearing premise
The ordering and magnitudes of eigenvalues of the empirical neural tangent kernel at successive training points correctly identify which directions are currently driving loss reduction.
What would settle it
An experiment that freezes updates along low-eigenvalue directions at the spectral position predicted for each model size and checks whether loss reduction halts at the same final loss value across different model scales.
Figures
read the original abstract
Neural scaling laws describe predictable power-law relationships between model size, dataset size, compute, and performance. While these laws guide the development of modern foundation models, the mechanisms underpinning them remain poorly understood, in part due to the absence of scalable analysis tools. To close this gap, we introduce "spectral position": a scalable measure of which eigenvalues of the empirical neural tangent kernel (eNTK) currently drive loss reduction. Applying this measure to scaling experiments, we find that spectral position decreases throughout training: learning shifts from dominant eigenmodes into the spectral tail. Larger models reach further into the tail than smaller models, revealing a size-dependent capacity we call "spectral reach". This suggests why larger models achieve lower losses: they sustain learning on weak spectral signals inaccessible to smaller models. We further identify feature learning as a key enabler of spectral reach. It adaptively amplifies gradient magnitudes as learning advances, sustaining progress where frozen representations stall. This points to concrete interventions through architecture and optimizer design.
Editorial analysis
A structured set of objections, weighed in public.
Referee Report
Summary. The paper introduces 'spectral position' as a scalable measure of which eigenvalues of the empirical neural tangent kernel (eNTK) drive loss reduction during training. It reports that spectral position decreases over the course of training as learning moves into the spectral tail, that larger models exhibit greater 'spectral reach' into weaker modes than smaller models, and that feature learning enables this reach by adaptively amplifying gradients on weak signals. These observations are offered as a mechanistic account of neural scaling laws.
Significance. If the central mapping from eNTK eigenvalue ordering to instantaneous loss-reducing directions can be substantiated, the work would supply a concrete spectral explanation for why larger models achieve lower loss and would suggest targeted interventions in architecture and optimization. The emphasis on feature learning as an enabler is a positive step toward connecting scaling phenomena to representation dynamics.
major comments (2)
- [Abstract] Abstract and introduction: no explicit equation or algorithmic definition is given for 'spectral position' (the quantity whose decrease is the central empirical finding). Without the formula relating eNTK eigenvalues at successive training points to the directions of loss reduction, it is impossible to assess whether the metric is independently grounded or tautological with respect to the observed loss curves.
- [Abstract] Abstract: the claim that larger models reach further into the tail because they sustain learning on weak spectral signals rests on the unverified assumption that the ordering and magnitudes of eNTK eigenvalues correctly identify the active loss-reducing subspace. No verification (e.g., explicit projection of per-step loss change onto the reported eigen-directions) is described, and this assumption is load-bearing for the 'spectral reach' interpretation, especially once feature learning alters the kernel.
minor comments (2)
- [Abstract] Abstract: dataset details, model architectures, number of runs, and error bars are not mentioned, making it difficult to evaluate the robustness of the reported scaling trends.
- [Abstract] Abstract: the phrase 'spectral position decreases throughout training' is stated without reference to a figure or table that would allow the reader to see the quantitative trend.
Simulated Author's Rebuttal
Thank you for the constructive feedback on our manuscript. We address each major comment below and outline the revisions we will make.
read point-by-point responses
-
Referee: [Abstract] Abstract and introduction: no explicit equation or algorithmic definition is given for 'spectral position' (the quantity whose decrease is the central empirical finding). Without the formula relating eNTK eigenvalues at successive training points to the directions of loss reduction, it is impossible to assess whether the metric is independently grounded or tautological with respect to the observed loss curves.
Authors: We agree that the abstract and introduction would benefit from an explicit definition. In Section 3 of the manuscript, spectral position is defined as the expectation of the eigenvalue index under the distribution induced by the normalized loss gradient projected onto the current eNTK eigenbasis. We will revise both the abstract and introduction to include this formula and a brief description of its computation from the eNTK and gradient at each training step. revision: yes
-
Referee: [Abstract] Abstract: the claim that larger models reach further into the tail because they sustain learning on weak spectral signals rests on the unverified assumption that the ordering and magnitudes of eNTK eigenvalues correctly identify the active loss-reducing subspace. No verification (e.g., explicit projection of per-step loss change onto the reported eigen-directions) is described, and this assumption is load-bearing for the 'spectral reach' interpretation, especially once feature learning alters the kernel.
Authors: Spectral position is constructed directly from the projection of the instantaneous gradient onto the eNTK eigenbasis, which supplies the grounding that the reported directions are those along which loss is reduced at each step. We nevertheless agree that an explicit additional check—such as measuring the correlation between per-step loss reduction and the change in spectral position—would strengthen the interpretation. We will add this verification analysis to the revised manuscript. revision: partial
Circularity Check
No circularity: metric definition and empirical application remain independent
full rationale
The paper defines spectral position directly from eNTK eigenvalues as a new scalable measure and reports its observed behavior across model sizes and training. No equations or steps reduce the reported findings (decreasing spectral position, size-dependent reach) to the inputs by construction, no fitted quantities are relabeled as predictions, and no self-citation chains carry the central claims. The derivation is self-contained; the metric functions as an external analysis tool whose application yields non-tautological observations.
Axiom & Free-Parameter Ledger
axioms (1)
- domain assumption Eigenvalues of the empirical neural tangent kernel identify the directions currently responsible for loss reduction
invented entities (1)
-
spectral reach
no independent evidence
Reference graph
Works this paper leans on
-
[1]
Tomasini, Alessandro Favero, and Matthieu Wyart
doi: 10.1103/PhysRevX.14.031001. URL https://link.aps.org/doi/10.1103/Phy sRevX.14.031001. Cagnetta, F., Kang, H., and Wyart, M. Learning curves theory for hierarchically compositional data with power- law distributed features. InForty-Second International Conference on Machine Learning, June 2025. URL ht tps://openreview.net/forum?id=Lw0kC7 5dY0&referrer...
-
[2]
URL https: //www.nature.com/articles/s41467-021 -23103-1
doi: 10.1038/s41467-021-23103-1. URL https: //www.nature.com/articles/s41467-021 -23103-1. Cao, Y ., Fang, Z., Wu, Y ., Zhou, D.-X., and Gu, Q. Towards Understanding the Spectral Bias of Deep Learning, Octo- ber 2020. URL http://arxiv.org/abs/1912.0 1198. Chizat, L., Oyallon, E., and Bach, F. On Lazy Training in Differentiable Programming. InAdvances in N...
-
[3]
Cristianini, N., Shawe-Taylor, J., Elisseeff, A., and Kandola, J
URL https://dl.acm.org/doi/10.55 55/2503308.2188413. Cristianini, N., Shawe-Taylor, J., Elisseeff, A., and Kandola, J. On Kernel-Target Alignment. InAdvances in Neural Information Processing Systems, volume 14. MIT Press,
-
[4]
cc/paper_files/paper/2001/hash/1f71e 393b3809197ed66df836fe833e5-Abstract
URL https://proceedings.neurips. cc/paper_files/paper/2001/hash/1f71e 393b3809197ed66df836fe833e5-Abstract. html. Dosovitskiy, A., Beyer, L., Kolesnikov, A., Weissenborn, D., Zhai, X., Unterthiner, T., Dehghani, M., Minderer, M., Heigold, G., Gelly, S., Uszkoreit, J., and Houlsby, N. An Image is Worth 16x16 Words: Transformers for Image Recognition at Sca...
-
[5]
ISSN 2632-2153. doi: 10.1088/2632-2153/ac87e9. URL https://dx.doi.org/10.1088/2632-2 153/ac87e9. Lee, J. and Kifer, D. Scaling up Differentially Private Deep Learning with Fast Per-Example Gradient Clipping, September 2020. URL http://arxiv.org/abs/ 2009.03106. Lee, J., Xiao, L., Schoenholz, S. S., Bahri, Y ., Novak, R., Sohl-Dickstein, J., and Pennington...
-
[6]
URL https://openreview.net/forum ?id=PH7sdEanXP&referrer=%5Bthe%20pro file%20of%20Jingfeng%20Wu%5D(%2Fprofi le%3Fid%3D˜Jingfeng_Wu1). Maloney, A., Roberts, D. A., and Sully, J. A Solvable Model of Neural Scaling Laws, October 2022. URL http://arxiv.org/abs/2210.16859. McCandlish, S., Kaplan, J., Amodei, D., and Team, O. D. An Empirical Model of Large-Batc...
arXiv 2022
-
[7]
URL http://arxiv.org/abs/1812.061 62. McKinney, W. Data Structures for Statistical Computing in Python. InPython in Science Conference, pp. 56–61, Austin, Texas, 2010. doi: 10.25080/Majora-92bf1922-0 0a. URL https://doi.curvenote.com/10.2 5080/Majora-92bf1922-00a. Nakkiran, P., Neyshabur, B., and Sedghi, H. The Deep Bootstrap Framework: Good Online Learne...
-
[8]
Novak, R., Sohl-Dickstein, J., and Schoenholz, S
URL http://arxiv.org/abs/1912.028 03. Novak, R., Sohl-Dickstein, J., and Schoenholz, S. S. Fast Finite Width Neural Tangent Kernel. InInternational Conference on Machine Learning, 2022. URL https: //github.com/google/neural-tangents. Ortiz-Jimenez, G., Moosavi-Dezfooli, S.-M., and Frossard, P. What can linearized neural networks actually say about general...
arXiv 1912
-
[9]
Llama 2: Open Foundation and Fine-Tuned Chat Models
URL http://arxiv.org/abs/2105.143 01. Sharma, U. and Kaplan, J. Scaling Laws from the Data Manifold Dimension.Journal of Machine Learning Re- search, 23(9):1–34, 2022. ISSN 1533-7928. URL http: //jmlr.org/papers/v23/20-1111.html. Touvron, H., Martin, L., Stone, K., Albert, P., Almahairi, A., Babaei, Y ., Bashlykov, N., Batra, S., Bhargava, P., Bhosale, S....
work page internal anchor Pith review Pith/arXiv arXiv doi:10.1088/2632- 2022
-
[10]
ISSN 2632-2153. doi: 10.1088/2632-2153/adee76. URL https://dx.doi.org/10.1088/2632-2 153/adee76. Worschech, R. and Rosenow, B. Analyzing Neural Scal- ing Laws in Two-Layer Networks with Power-Law Data Spectra. InThe Thirteenth International Conference on Learning Representations, October 2024. URL https: //openreview.net/forum?id=wFD16gwpze. Yang, G. and ...
-
[11]
Zandieh, A., Han, I., Avron, H., Shoham, N., Kim, C., and Shin, J
URL http://arxiv.org/abs/2109.122 98. Zandieh, A., Han, I., Avron, H., Shoham, N., Kim, C., and Shin, J. Scaling Neural Tangent Kernels via Sketch- ing and Random Features.Advances in Neural Informa- tion Processing Systems, 34:1062–1073, December 2021. URL https://proceedings.neurips.cc/p aper_files/paper/2021/hash/08ae6a26b 7cb089ea588e94aed36bd15-Abstr...
2021
-
[12]
Implementation details can be found in Section B.2.5
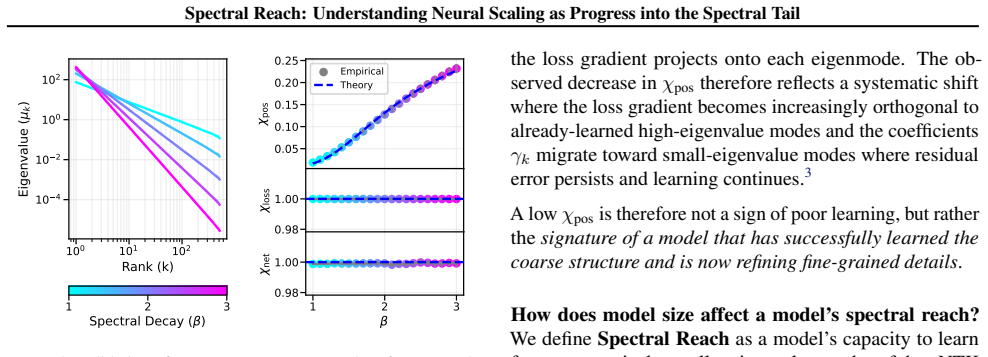
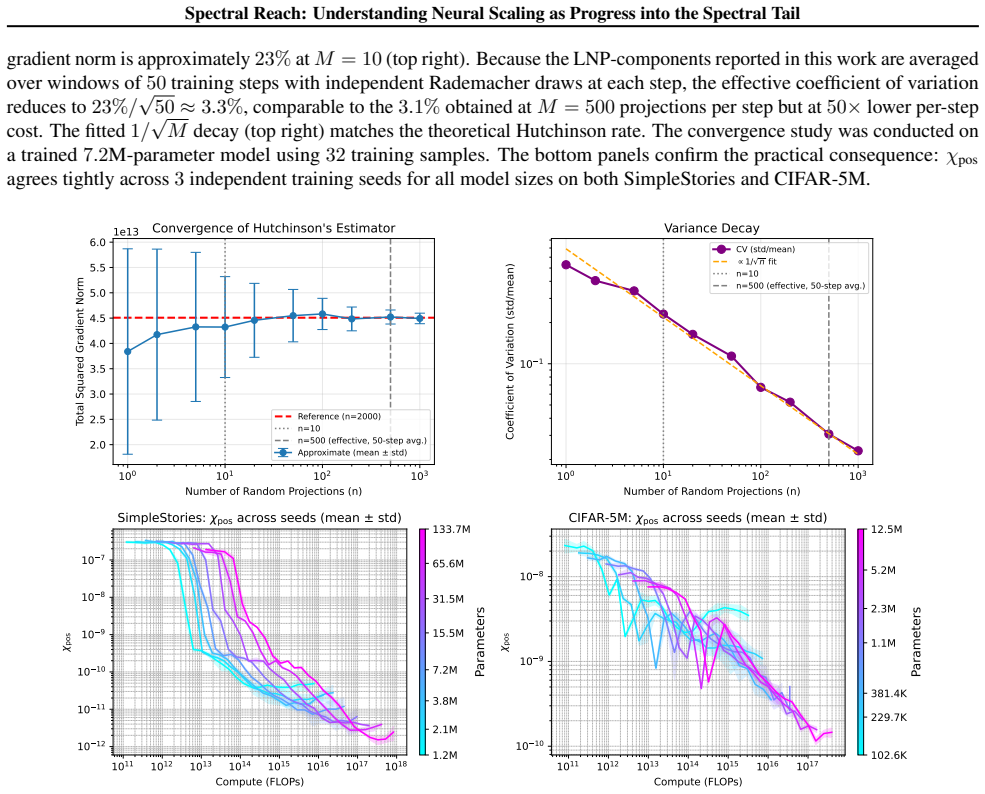
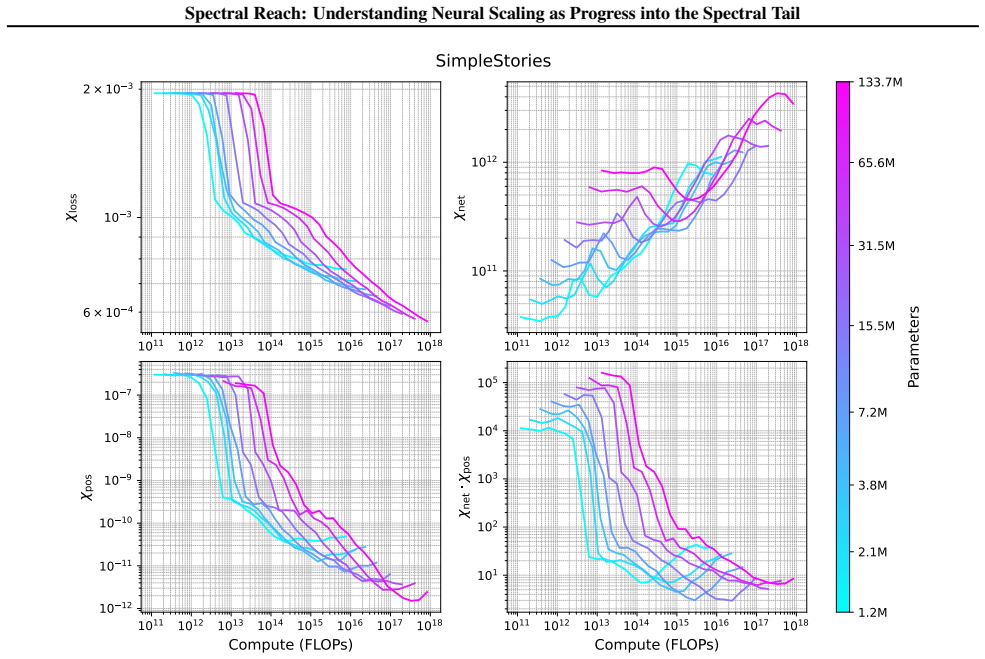
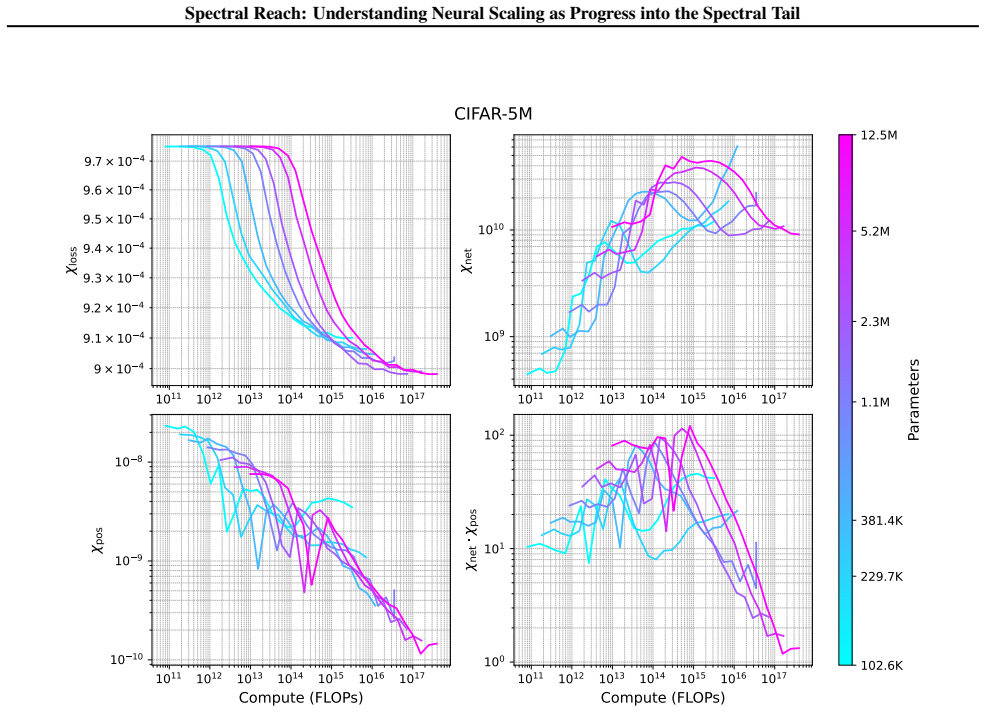
Loss Component (χloss).We construct targets to be standardized such that var(y) = 1. Implementation details can be found in Section B.2.5. Consequently, by the Law of Large Numbers: χloss = 1 n nX i=1 y2 i n→∞ − − − − →E[y2] = 1.(43) 18 Spectral Reach: Understanding Neural Scaling as Progress into the Spectral Tail
-
[13]
Network Component (χnet).The trace term averages the kernel diagonal: χnet = 1 n P i K(x i,x i). For ReLU features with normalized weightsw∼ N(0, d −1I)and data covariance Tr(Σ) =d: E[χnet] =E x,w[σ(w⊤x)2] = 1 2 E[(w⊤x)2]·2(symmetry of distribution around 0) =Tr E[xx⊤]E[ww⊤] =Tr Σ· 1 dI = 1.(44) Thus,χ net →1
-
[14]
We adopt aGaussian Process Teachersetting, where f ∗ ∼ GP(0, K)
Spectral Position Component (χpos).This component captures how the target energy is distributed across the kernel’s eigenmodes. We adopt aGaussian Process Teachersetting, where f ∗ ∼ GP(0, K) . This implies that the vector of targets on the training set follows y∼ N(0,K) . In the eigenbasis of K, the projection coefficients αk are independent Gaussian var...
2021
discussion (0)
Sign in with ORCID, Apple, or X to comment. Anyone can read and Pith papers without signing in.