The ALMA Survey of Gas Evolution of PROtoplanetary Disks (AGE-PRO): Formaldehyde (H₂CO) emission and its links to disk properties
Pith reviewed 2026-06-28 03:38 UTC · model grok-4.3
The pith
H2CO line luminosity in protoplanetary disks correlates strongly with disk radius, mass, and stellar properties, indicating brighter emission in extended massive disks via CO ice hydrogenation on grains.
A machine-rendered reading of the paper's core claim, the machinery that carries it, and where it could break.
Core claim
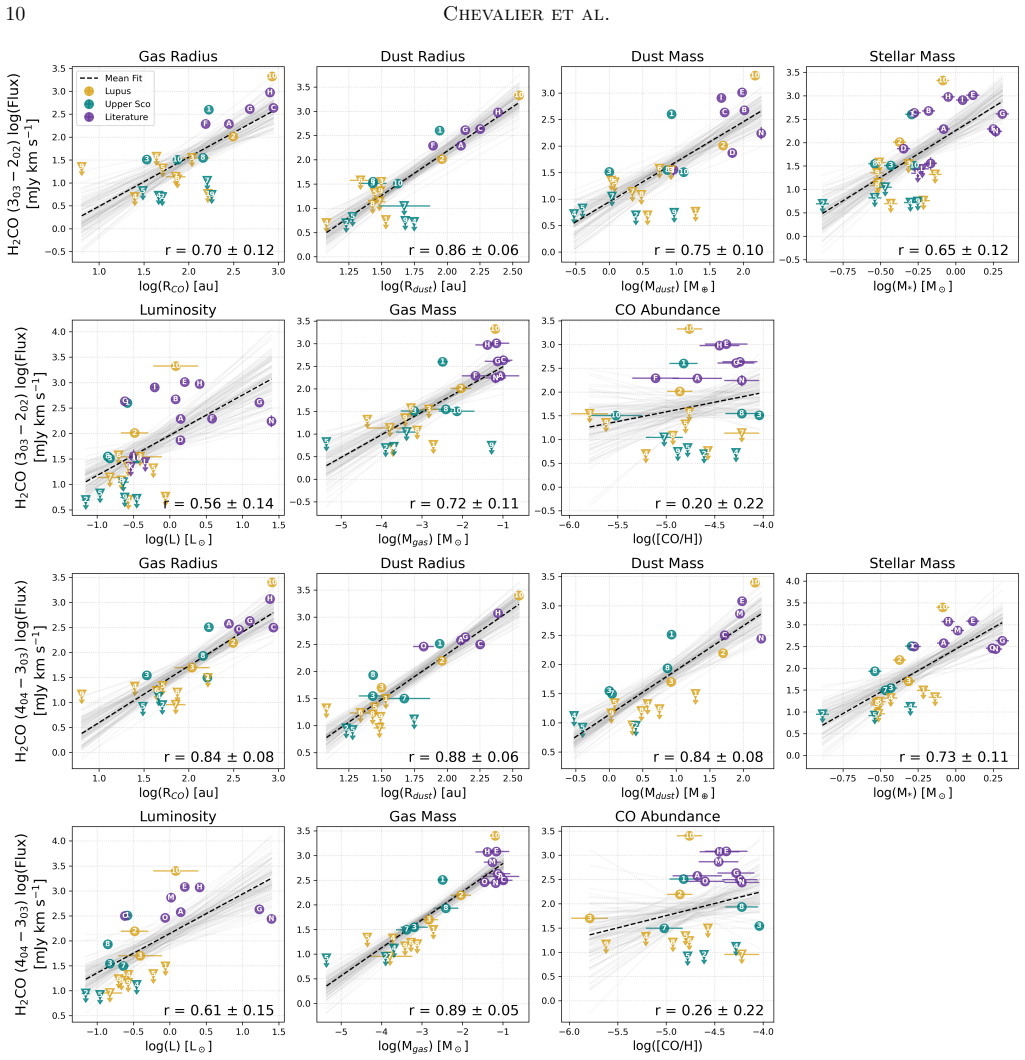
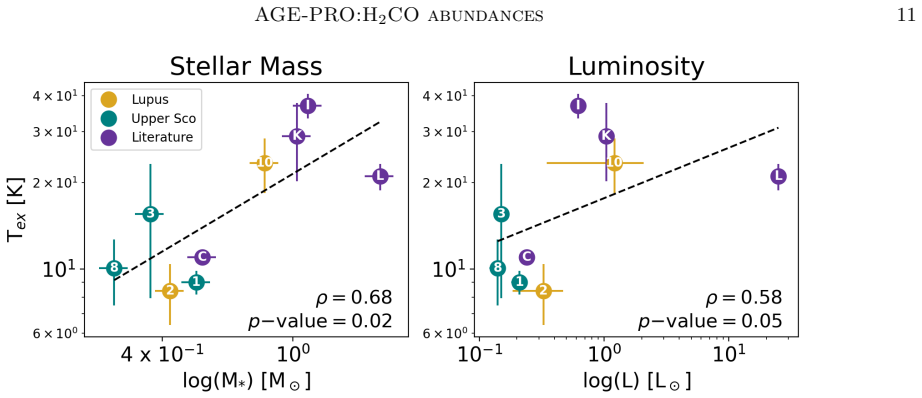
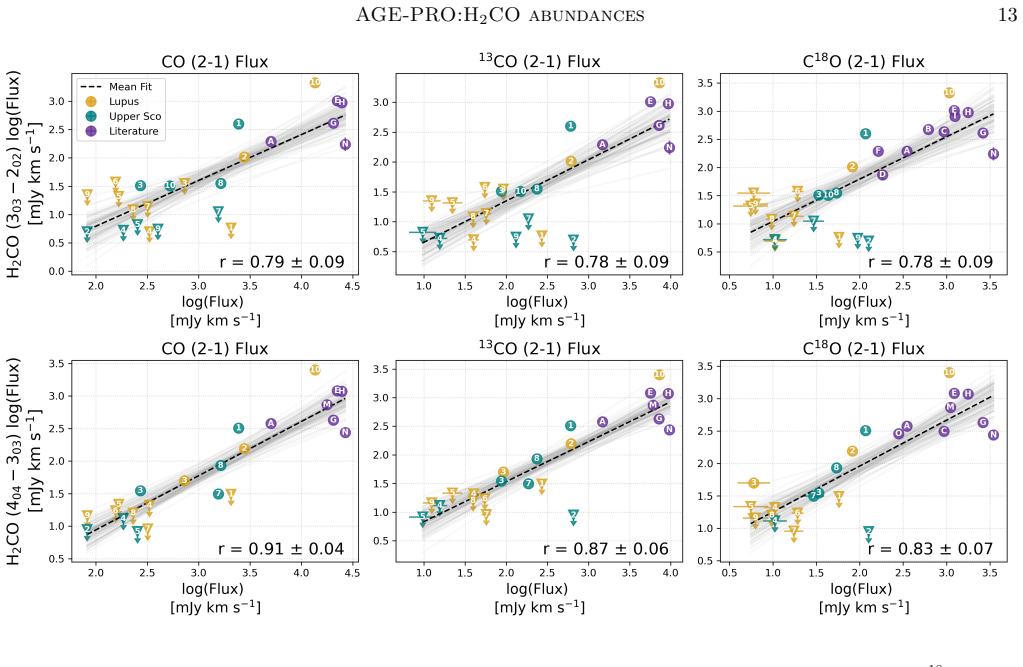
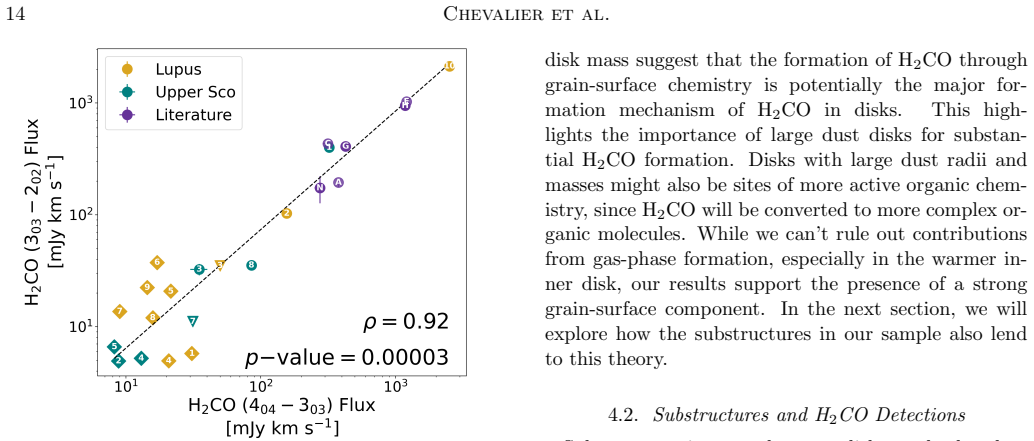
Across the combined sample of protoplanetary disks, H2CO line luminosity shows strong correlations with dust radius, gas radius, dust mass, gas mass, stellar mass, and stellar luminosity. This indicates that H2CO emission is brighter for extended massive dust disks where formation occurs via CO ice hydrogenation on grain surfaces. The H2CO excitation temperature correlates with stellar mass and stellar luminosity, suggesting more massive and luminous stars increase H2CO excitation.
What carries the argument
Correlations between H2CO line luminosity and disk/stellar parameters, used to link emission strength to grain-surface formation in extended disks.
If this is right
- H2CO serves as a tracer for the extent and mass of protoplanetary disks.
- Disks around more massive stars exhibit both brighter H2CO emission and higher excitation temperatures.
- Chemical models must account for enhanced grain-surface H2CO production in larger disks to match observations.
- The availability of H2CO for incorporation into planets depends on initial disk size and mass.
Where Pith is reading between the lines
- Similar correlations may exist for other grain-surface organics such as methanol, offering a way to map formation pathways across multiple species.
- Time evolution of disk radius and mass could reduce H2CO emission as disks disperse, affecting organic delivery to forming planets.
- Target selection for future ALMA surveys of complex organics could prioritize extended massive disks to maximize detection rates.
Load-bearing premise
The observed luminosity correlations primarily trace the grain-surface formation pathway rather than being driven by variations in excitation conditions, optical depth, or radial abundance profiles.
What would settle it
A larger sample of disks showing no correlations between H2CO luminosity and disk radius or mass, or correlations fully explained by temperature gradients alone without abundance changes, would undermine the grain-surface interpretation.
Figures
read the original abstract
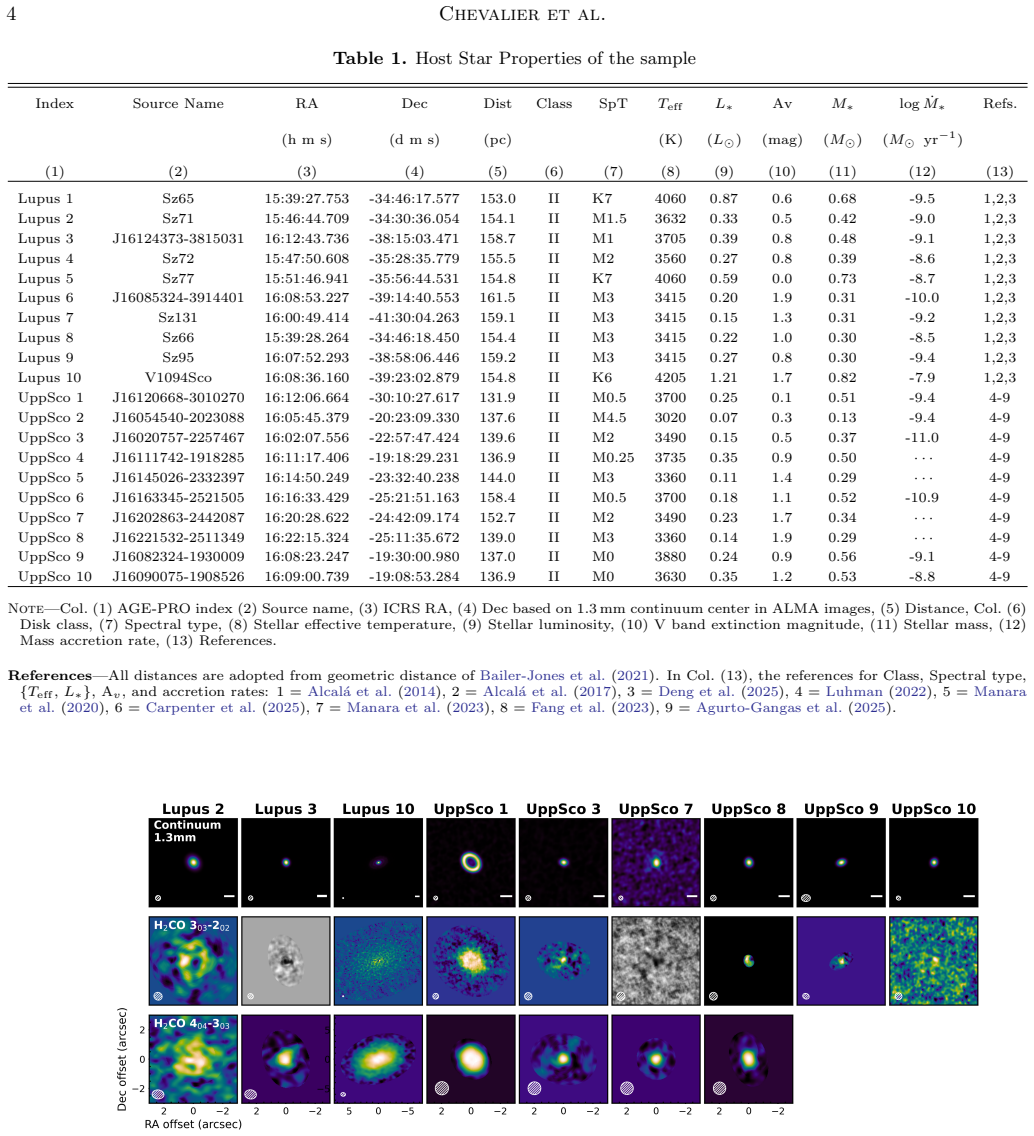
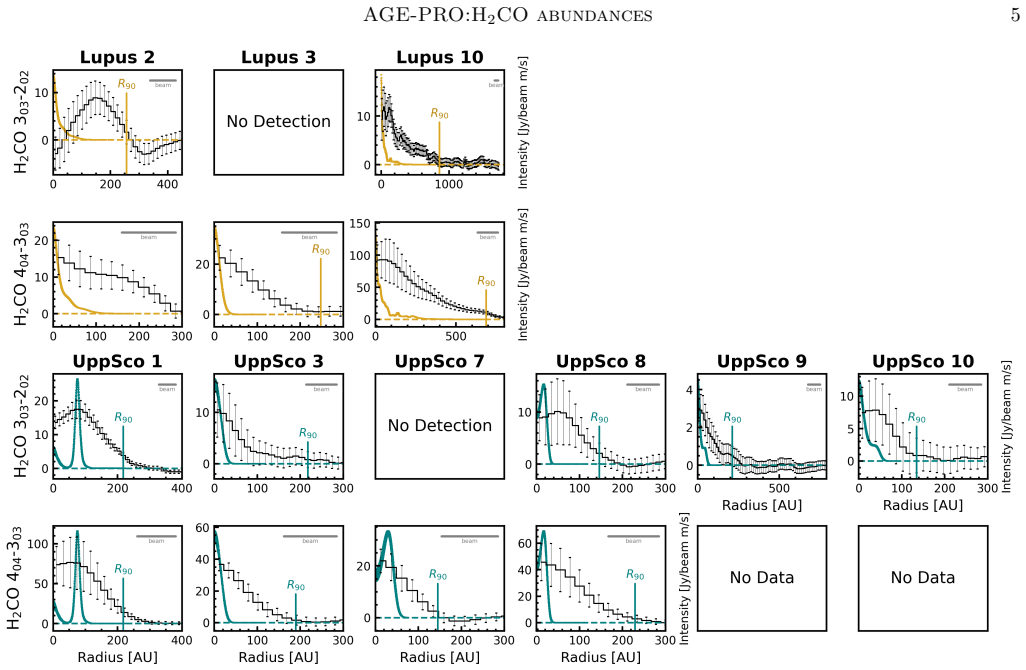
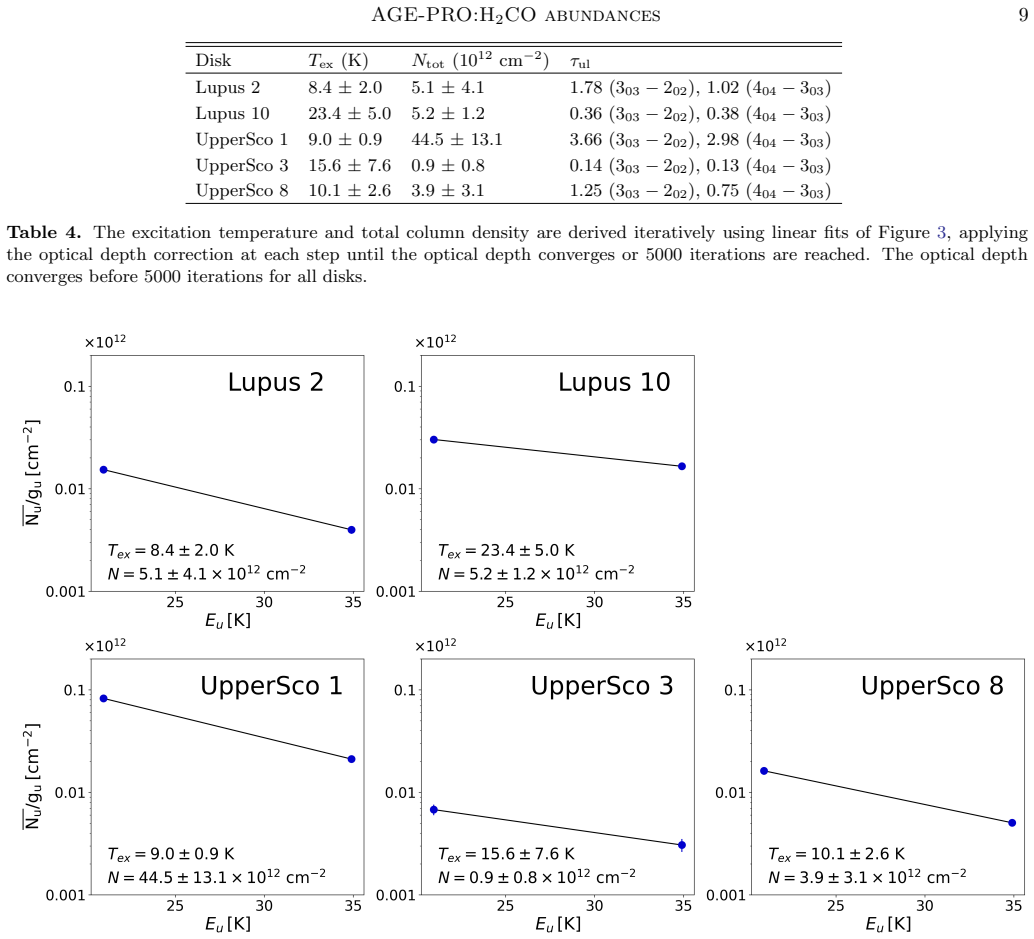
Protoplanetary disks are rotating structures of gas and dust surrounding young stars, serving as the birth places of planets. Understanding the chemical evolution of organic materials in these disks is key for tracing the origins of organics in planetary systems. Formaldehyde (H$_2$CO) is the most commonly detected organic molecule in protoplanetary disks. In this study, we investigate the emission of H$_2$CO and its link to disk properties, using a sample of 20 Class II disks in the Lupus and Upper Sco star-forming regions spanning over 1-6 Myr. We analyze the H$_2$CO lines at 218.222 and 290.623 GHz observed as part of the AGE-PRO ALMA Large Program. Within this sample we achieve a detection rate of H$_2$CO of 45% (9/20), and set robust upper limits for the non-detections. We measure the excitation temperature and column density of the H$_2$CO gas in the sources with H$_2$CO detections. We combine our sample with 13 additional disks with archival H$_2$CO detections and search for correlations between H$_2$CO properties and disk parameters. Notably, we find strong correlations between H$_2$CO line luminosity and dust radius, gas radius, dust mass, gas mass, stellar mass, and stellar luminosity. This suggests that H$_2$CO emission is brighter for extended massive dust disks where H$_2$CO can form via CO ice hydrogenation on grain surfaces. We find that the H$_2$CO excitation temperature is also correlated with stellar mass and stellar luminosity, so more massive and luminous stars could increase H$_2$CO excitation.
Editorial analysis
A structured set of objections, weighed in public.
Referee Report
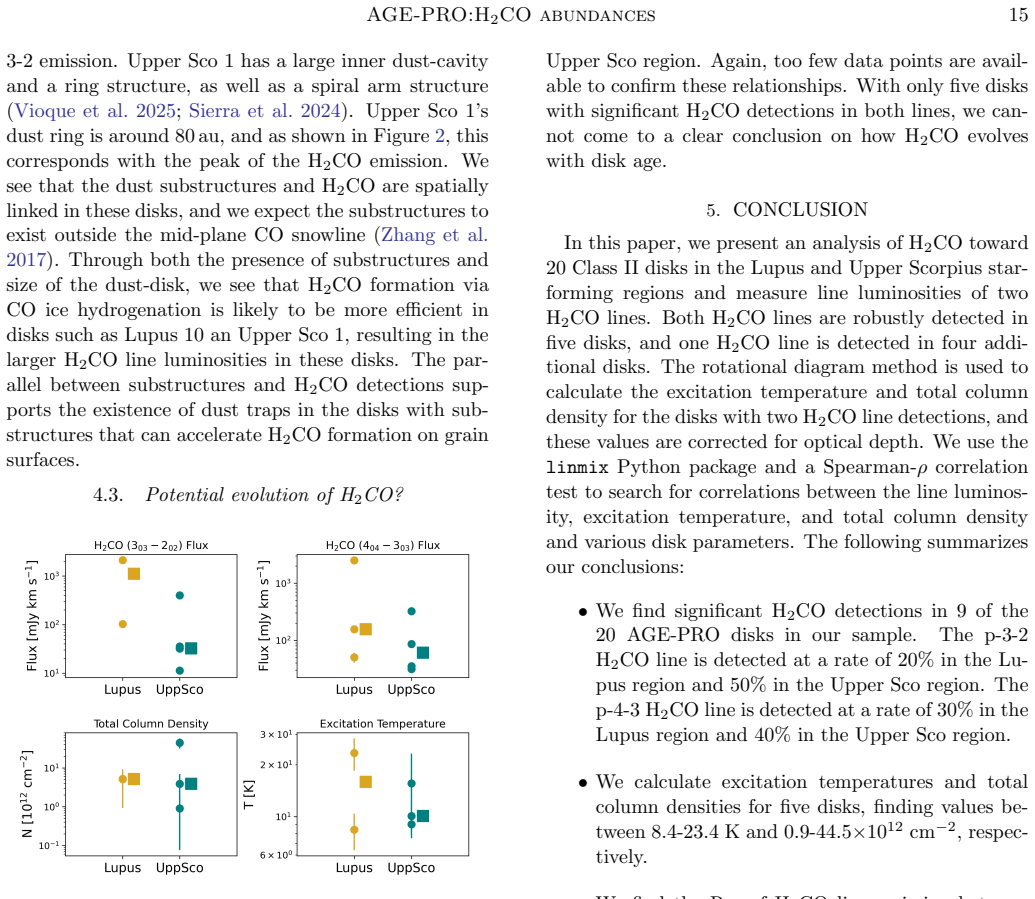
Summary. The manuscript reports ALMA observations of H2CO (formaldehyde) emission toward 20 Class II protoplanetary disks in Lupus and Upper Sco as part of the AGE-PRO Large Program. It achieves a 45% detection rate (9/20 sources), derives excitation temperatures and column densities for the detections, combines the sample with 13 archival H2CO detections, and identifies strong correlations between H2CO line luminosity and dust/gas radii, dust/gas masses, stellar mass, and stellar luminosity. The authors interpret these correlations as evidence that H2CO forms primarily via CO ice hydrogenation on grain surfaces in extended, massive disks, and additionally report that Tex correlates with stellar mass and luminosity.
Significance. If the reported correlations can be shown to be robust against excitation and selection effects, the work would strengthen the observational link between disk structural properties and the formation efficiency of complex organics, with direct relevance to models of prebiotic chemistry and the delivery of organics during planet formation. The addition of uniform new observations to the existing H2CO sample is a useful contribution to the field.
major comments (3)
- [§4] §4 (correlation analysis): The headline claim that H2CO line luminosity traces grain-surface formation in extended massive disks rests on raw luminosity correlations with radii, masses, and stellar parameters. However, the manuscript also reports that Tex correlates with stellar mass and luminosity; because line luminosity depends on column density, Tex, optical depth, and emitting area, the analysis must demonstrate that the reported correlations survive after controlling for Tex (e.g., via partial correlation coefficients or normalization to column density). Without this step the formation-pathway interpretation remains under-constrained.
- [§3, §4] §3 and §4 (sample construction): The combined sample of 9 new detections plus 13 archival sources of heterogeneous sensitivity and spatial resolution is used for the correlation analysis. A quantitative assessment of selection biases (e.g., whether brighter or more extended disks are preferentially detected in the archival subset) is required; otherwise the correlations with dust/gas radius and mass may be partly driven by sensitivity limits rather than intrinsic chemistry.
- [§4] §4 (statistical treatment): The correlations are described as 'strong,' yet the manuscript provides no details on the handling of upper limits for the 11 non-detections or on the statistical significance (e.g., via censored regression or survival analysis). This information is load-bearing for the robustness of the central claim linking H2CO luminosity to disk properties.
minor comments (2)
- [Figure 3] Figure 3 (or equivalent correlation plots): Include the non-detections as upper-limit arrows so that the full sample distribution is visible; this would strengthen the visual support for the reported trends.
- [Abstract, §4] Abstract and §4: Clarify whether the 45% detection rate refers strictly to the 20 AGE-PRO targets or to the combined sample; also state the typical rms noise levels achieved for the non-detections.
Simulated Author's Rebuttal
We thank the referee for their constructive comments on our manuscript. We address each major comment below and will make the indicated revisions to strengthen the analysis and presentation.
read point-by-point responses
-
Referee: [§4] §4 (correlation analysis): The headline claim that H2CO line luminosity traces grain-surface formation in extended massive disks rests on raw luminosity correlations with radii, masses, and stellar parameters. However, the manuscript also reports that Tex correlates with stellar mass and luminosity; because line luminosity depends on column density, Tex, optical depth, and emitting area, the analysis must demonstrate that the reported correlations survive after controlling for Tex (e.g., via partial correlation coefficients or normalization to column density). Without this step the formation-pathway interpretation remains under-constrained.
Authors: We agree that controlling for Tex is important given the reported correlation between Tex and stellar parameters. In the revised manuscript we will add partial correlation coefficients to quantify how the H2CO line luminosity correlations with disk radii, masses, and stellar parameters hold after accounting for Tex. We will also discuss the implications for the grain-surface formation interpretation. revision: yes
-
Referee: [§3, §4] §3 and §4 (sample construction): The combined sample of 9 new detections plus 13 archival sources of heterogeneous sensitivity and spatial resolution is used for the correlation analysis. A quantitative assessment of selection biases (e.g., whether brighter or more extended disks are preferentially detected in the archival subset) is required; otherwise the correlations with dust/gas radius and mass may be partly driven by sensitivity limits rather than intrinsic chemistry.
Authors: We acknowledge the heterogeneous nature of the archival data. In the revision we will add a quantitative assessment of selection biases, including a direct comparison of correlation strengths derived from the uniform AGE-PRO subsample versus the full combined sample, and an explicit discussion of how sensitivity and resolution differences could influence the observed trends with radius and mass. revision: yes
-
Referee: [§4] §4 (statistical treatment): The correlations are described as 'strong,' yet the manuscript provides no details on the handling of upper limits for the 11 non-detections or on the statistical significance (e.g., via censored regression or survival analysis). This information is load-bearing for the robustness of the central claim linking H2CO luminosity to disk properties.
Authors: We will expand the statistical methods section to detail how upper limits are treated. The correlations are computed on the detected sources (new plus archival), with upper limits shown in figures for context but not included in the fits. We will add a clear statement on this approach and, where feasible, explore the application of censored regression or survival analysis to incorporate the non-detections. revision: yes
Circularity Check
No circularity: empirical correlations from direct observations
full rationale
The paper reports measured H2CO line luminosities, excitation temperatures, and column densities from ALMA data for 9 detections (plus archival sources), then computes Pearson/Spearman correlations against independently derived disk parameters (dust/gas radii, masses, stellar mass/luminosity). No equations, fits, or predictions reduce the reported luminosities or correlations to quantities defined by the same data; the formation-pathway interpretation is post-hoc and does not enter the measurement chain. Self-citations, if present, are not load-bearing for the central observational result.
Axiom & Free-Parameter Ledger
axioms (1)
- domain assumption Local thermodynamic equilibrium or optically thin assumptions used when deriving excitation temperature and column density from the two observed lines.
Reference graph
Works this paper leans on
-
[1]
Agurto-Gangas, C., P´ erez, L. M., Sierra, A., et al. 2025, ApJ, 989, 4, doi: 10.3847/1538-4357/adc7ab Alcal´ a, J. M., Natta, A., Manara, C. F., et al. 2014, A&A, 561, A2, doi: 10.1051/0004-6361/201322254 Alcal´ a, J. M., Manara, C. F., Natta, A., et al. 2017, A&A, 600, A20, doi: 10.1051/0004-6361/201629929
-
[2]
M., Terrell, M., Tripathi, A., et al
Andrews, S. M., Terrell, M., Tripathi, A., et al. 2018, ApJ, 865, 157, doi: 10.3847/1538-4357/aadd9f
-
[3]
Atkinson, R., Baulch, D. L., Cox, R. A., et al. 2006, Atmospheric Chemistry & Physics, 6, 3625, doi: 10.5194/acp-6-3625-200610.5194/acpd-5-6295-2005
work page doi:10.5194/acp-6-3625-200610.5194/acpd-5-6295-2005 2006
-
[4]
2023, in Astronomical Society of the Pacific Conference Series, Vol
Bae, J., Isella, A., Zhu, Z., et al. 2023, in Astronomical Society of the Pacific Conference Series, Vol. 534, Protostars and Planets VII, ed. S. Inutsuka, Y. Aikawa, T. Muto, K. Tomida, & M. Tamura, 423, doi: 10.48550/arXiv.2210.13314
-
[5]
2021, AJ, 161, 147, doi: 10.3847/1538-3881/abd806
Demleitner, M., & Andrae, R. 2021, AJ, 161, 147, doi: 10.3847/1538-3881/abd806
work page internal anchor Pith review doi:10.3847/1538-3881/abd806 2021
-
[6]
2023, Astronomy & Astrophysics, 678, doi: 10.1051/0004-6361/202346974
Booth, A., Law, C., Temmink, M., Leemker, M., & Mac´ ıas, E. 2023, Astronomy & Astrophysics, 678, doi: 10.1051/0004-6361/202346974
-
[7]
S., Walsh, C., Terwisscha van Scheltinga, J., et al
Booth, A. S., Walsh, C., Terwisscha van Scheltinga, J., et al. 2021, Nature Astronomy, 5, 684, doi: 10.1038/s41550-021-01352-w
-
[8]
D., Walsh, C., & van Dishoeck, E
Bosman, A. D., Walsh, C., & van Dishoeck, E. F. 2018, A&A, 618, A182, doi: 10.1051/0004-6361/201833497
-
[9]
Carney, M. T., Hogerheijde, M. R., Loomis, R. A., et al. 2017, A&A, 605, A21, doi: 10.1051/0004-6361/201629342
-
[10]
Carpenter, J. M., Esplin, T. L., Luhman, K. L., Mamajek, E. E., & Andrews, S. M. 2025, ApJ, 978, 117, doi: 10.3847/1538-4357/ad8ebc
-
[11]
2025, ApJ, 989, 3, doi: 10.3847/1538-4357/add43a
Deng, D., Vioque, M., Pascucci, I., et al. 2025, ApJ, 989, 3, doi: 10.3847/1538-4357/add43a
-
[12]
P., Schlemmer, S., Schilke, P., Stutzki, J., & M¨ uller, H
Endres, C. P., Schlemmer, S., Schilke, P., Stutzki, J., & M¨ uller, H. S. 2016, Journal of Molecular Spectroscopy, 327, 95, doi: https://doi.org/10.1016/j.jms.2016.03.005
-
[13]
Evans, L., Booth, A. S., Walsh, C., et al. 2025, ApJ, 982, 62, doi: 10.3847/1538-4357/adb287
-
[14]
2023, ApJ, 945, 112, doi: 10.3847/1538-4357/acb2c9
Fang, M., Pascucci, I., Edwards, S., et al. 2023, ApJ, 945, 112, doi: 10.3847/1538-4357/acb2c9
-
[15]
Fockenberg, C., & Preses, J. M. 2002, Journal of Physical Chemistry A, 106, 2924, doi: 10.1021/jp0141880
-
[16]
Fuchs, G. W., Cuppen, H. M., Ioppolo, S., et al. 2009, A&A, 505, 629, doi: 10.1051/0004-6361/200810784
-
[17]
Goldsmith, P. F., & Langer, W. D. 1999, ApJ, 517, 209, doi: 10.1086/307195 Guzm´ an, V. V., Bergner, J. B., Law, C. J., et al. 2021, ApJS, 257, 6, doi: 10.3847/1538-4365/ac1440
-
[18]
Herbst, E., & van Dishoeck, E. F. 2009, ARA&A, 47, 427, doi: 10.1146/annurev-astro-082708-101654 Hern´ andez-Vera, C., Guzm´ an, V. V., Artur de la
-
[19]
2024, The Astrophysical Journal, 967, 68, doi: 10.3847/1538-4357/ad3cdb
Villarmois, E., et al. 2024, The Astrophysical Journal, 967, 68, doi: 10.3847/1538-4357/ad3cdb
-
[20]
2004, ApJ, 614, 1124, doi: 10.1086/423889
Kouchi, A. 2004, ApJ, 614, 1124, doi: 10.1086/423889
-
[21]
1994, Chemical Physics Letters, 229, 408, doi: 10.1016/0009-2614(94)01066-8
Hiraoka, K., Ohashi, N., Kihara, Y., et al. 1994, Chemical Physics Letters, 229, 408, doi: 10.1016/0009-2614(94)01066-8
-
[22]
2002, ApJ, 577, 265, doi: 10.1086/342132
Hiraoka, K., Sato, T., Sato, S., et al. 2002, ApJ, 577, 265, doi: 10.1086/342132
-
[23]
Kelly, B. C. 2007, The Astrophysical Journal, 665, 1489–1506, doi: 10.1086/519947
-
[24]
Krijt, S., Bosman, A. D., Zhang, K., et al. 2020, ApJ, 899, 134, doi: 10.3847/1538-4357/aba75d
-
[25]
2022, arXiv e-prints, arXiv:2203.10056
Krijt, S., Kama, M., McClure, M., et al. 2022, arXiv e-prints, arXiv:2203.10056. https://arxiv.org/abs/2203.10056
arXiv 2022
-
[26]
T., Facchini, S., Benisty, M., et al
Kurtovic, N. T., Facchini, S., Benisty, M., et al. 2024, A&A, 692, A155, doi: 10.1051/0004-6361/202347583
-
[27]
Ligterink, N. F. W., Pinilla, P., van der Marel, N., et al. 2024, Nature Astronomy, 8, 1257, doi: 10.1038/s41550-024-02334-4
-
[28]
Long, F., Pinilla, P., Herczeg, G. J., et al. 2018, ApJ, 869, 17, doi: 10.3847/1538-4357/aae8e1
-
[29]
Long, F., Andrews, S. M., Rosotti, G., et al. 2022, ApJ, 931, 6, doi: 10.3847/1538-4357/ac634e
-
[30]
Loomis, R. A., Cleeves, L. I., ¨Oberg, K. I., Guzman, V. V., & Andrews, S. M. 2015, ApJL, 809, L25, doi: 10.1088/2041-8205/809/2/L25
-
[31]
Loomis, R. A., ¨Oberg, K. I., Andrews, S. M., et al. 2018, AJ, 155, 182, doi: 10.3847/1538-3881/aab604
-
[32]
Luhman, K. L. 2022, AJ, 163, 24, doi: 10.3847/1538-3881/ac35e2
-
[33]
Manara, C. F., Ansdell, M., Rosotti, G. P., et al. 2023, Demographics of young stars and their protoplanetary disks: lessons learned on disk evolution and its connection to planet formation. https://arxiv.org/abs/2203.09930
arXiv 2023
-
[34]
Manara, C. F., Ansdell, M., Rosotti, G. P., et al. 2023, in Astronomical Society of the Pacific Conference Series, Vol. 534, Protostars and Planets VII, ed. S. Inutsuka, Y. Aikawa, T. Muto, K. Tomida, & M. Tamura, 539, doi: 10.48550/arXiv.2203.09930
-
[35]
Manara, C. F., Natta, A., Rosotti, G. P., et al. 2020, A&A, 639, A58, doi: 10.1051/0004-6361/202037949 M¨ uller, H. S. P., Thorwirth, S., Roth, D. A., &
-
[36]
2001, A&A, 370, L49, doi: 10.1051/0004-6361:20010367 24Chevalier et al
Winnewisser, G. 2001, A&A, 370, L49, doi: 10.1051/0004-6361:20010367 24Chevalier et al. M¨ uller, H. S., Schl¨ oder, F., Stutzki, J., & Winnewisser, G. 2005, Journal of Molecular Structure, 742, 215, doi: https://doi.org/10.1016/j.molstruc.2005.01.027 ¨Oberg, K. I., & Bergin, E. A. 2021, PhR, 893, 1, doi: 10.1016/j.physrep.2020.09.004 ¨Oberg, K. I., Guzm´...
-
[37]
Pascucci, I., Testi, L., Herczeg, G. J., et al. 2016, ApJ, 831, 125, doi: 10.3847/0004-637X/831/2/125
-
[38]
Pegues, J., ¨Oberg, K. I., Bergner, J. B., et al. 2020, ApJ, 890, 142, doi: 10.3847/1538-4357/ab64d9 —. 2021, ApJ, 911, 150, doi: 10.3847/1538-4357/abe870
-
[39]
2013, The Astrophysical Journal, 765, doi: 10.1088/0004-637X/765/1/34
Qi, C., Oberg, K., & Wilner, D. 2013, The Astrophysical Journal, 765, doi: 10.1088/0004-637X/765/1/34
-
[40]
2024, A&A, 689, A65, doi: 10.1051/0004-6361/202449698
Rampinelli, L., Facchini, S., Leemker, M., et al. 2024, A&A, 689, A65, doi: 10.1051/0004-6361/202449698
-
[41]
A., Gonz´ alez-Ruilova, C., Cieza, L
Ruiz-Rodriguez, D. A., Gonz´ alez-Ruilova, C., Cieza, L. A., et al. 2025, ApJ, 989, 2, doi: 10.3847/1538-4357/add2ec
-
[42]
Schwarz, K. R., Bergin, E. A., Cleeves, L. I., et al. 2018, ApJ, 856, 85, doi: 10.3847/1538-4357/aaae08
-
[43]
Sierra, A., P´ erez, L. M., Agurto-Gangas, C., et al. 2024, ApJ, 974, 102, doi: 10.3847/1538-4357/ad6e73
-
[44]
Sturm, J. A., Booth, A. S., McClure, M. K., Leemker, M., & van Dishoeck, E. F. 2023, A&A, 670, A12, doi: 10.1051/0004-6361/202244227
-
[45]
2019a, The Journal of Open Source Software, 4, 1632, doi: 10.21105/joss.01632 —
Teague, R. 2019a, The Journal of Open Source Software, 4, 1632, doi: 10.21105/joss.01632 —. 2019b, The Journal of Open Source Software, 4, 1220, doi: 10.21105/joss.01220
-
[46]
Dishoeck, E. F. 2023, A&A, 675, A131, doi: 10.1051/0004-6361/202346272 Terwisscha van Scheltinga, J., Hogerheijde, M. R., Cleeves, L. I., et al. 2021, ApJ, 906, 111, doi: 10.3847/1538-4357/abc9ba
-
[47]
Trapman, L., Vioque, M., Kurtovic, N. T., et al. 2025a, ApJ, 989, 10, doi: 10.3847/1538-4357/adc7af
-
[48]
Trapman, L., Zhang, K., Rosotti, G. P., et al. 2025b, ApJ, 989, 5, doi: 10.3847/1538-4357/adcd6e
-
[49]
Trapman, L., Longarini, C., Rosotti, G. P., et al. 2025c, ApJL, 984, L18, doi: 10.3847/2041-8213/adc430 van der Marel, N., Booth, A. S., Leemker, M., van
-
[50]
Dishoeck, E. F., & Ohashi, S. 2021, A&A, 651, L5, doi: 10.1051/0004-6361/202141051
-
[51]
Vioque, M., Kurtovic, N. T., Trapman, L., et al. 2025, ApJ, 989, 9, doi: 10.3847/1538-4357/adc7b0
-
[52]
Walsh, C., Millar, T. J., Nomura, H., et al. 2014, A&A, 563, A33, doi: 10.1051/0004-6361/201322446
-
[53]
2002, ApJL, 571, L173, doi: 10.1086/341412
Watanabe, N., & Kouchi, A. 2002, ApJL, 571, L173, doi: 10.1086/341412
-
[54]
2004, ApJ, 616, 638, doi: 10.1086/424815
Watanabe, N., Nagaoka, A., Shiraki, T., & Kouchi, A. 2004, ApJ, 616, 638, doi: 10.1086/424815
-
[55]
Willacy, K., & Woods, P. M. 2009, ApJ, 703, 479, doi: 10.1088/0004-637X/703/1/479
-
[56]
Williams, J. P., & Cieza, L. A. 2011, Annual Review of Astronomy and Astrophysics, 49, 67, doi: 10.1146/annurev-astro-081710-102548
-
[57]
2024, Reviews in Mineralogy and Geochemistry, 90, 27, doi: 10.2138/rmg.2024.90.02
Zhang, K. 2024, Reviews in Mineralogy and Geochemistry, 90, 27, doi: 10.2138/rmg.2024.90.02
-
[58]
Schwarz, K. R. 2017, Nature Astronomy, 1, 0130, doi: 10.1038/s41550-017-0130
-
[59]
Zhang, K., Schwarz, K. R., & Bergin, E. A. 2020, ApJL, 891, L17, doi: 10.3847/2041-8213/ab7823
-
[60]
Zhang, K., P´ erez, L. M., Pascucci, I., et al. 2025, ApJ, 989, 1, doi: 10.3847/1538-4357/addebe
discussion (0)
Sign in with ORCID, Apple, or X to comment. Anyone can read and Pith papers without signing in.