REVIEW 3 major objections 1 minor 65 references
Phylogenetic trees applied to chemical abundances separate galaxy evolution models primarily by differences in the mass-loading outflow parameter.
Reviewed by Pith at T0; open to challenge. T0 means a machine referee read the full paper against a public rubric. the ladder, T0–T4 →
Phylogenetic trees built from flexCE model abundances separate primarily by the outflow mass-loading parameter η, with branches connecting at the most metal-rich tips.
T0 review reviewed 2026-06-27 challenge →
load-bearing objection Phylogenetic trees on flexCE models separate mainly by outflow parameter η, but lack quantitative tree metrics. the 3 major comments →
Disentangling chemical evolution histories with phylogenetic trees
The pith
A machine-rendered reading of the paper's core claim, the machinery that carries it, and where it could break.
The reading
Core claim
Phylogenetic trees built from flexCE chemical abundance vectors cleanly separate models into two branches when the mass-loading outflow parameter eta differs, with branches joining at the most metal-rich tips; eta exerts the strongest control because it governs chemical enrichment rates and total abundances, while star formation rate and mass accumulation affect eta indirectly but show no direct abundance link.
What carries the argument
Phylogenetic trees constructed from chemical abundance vectors of one-zone flexCE models, which treat elements as inherited traits to reveal branch separations driven by model parameters.
Load-bearing premise
Chemical abundances produced by the one-zone flexCE models carry inheritance-like information between generations that is sufficient for phylogenetic trees to disentangle distinct evolutionary pathways.
What would settle it
If models that differ only in eta produce trees whose branches do not cleanly separate the two fiducial inputs, the claim that phylogenetic trees disentangle histories via this inheritance signal would be falsified.
If this is right
- Different values of eta produce abundance sets whose trees form two distinct branches separating the input models.
- Star formation rate and mass accumulation modulate the effect of eta but do not produce direct abundance correlations visible in the trees.
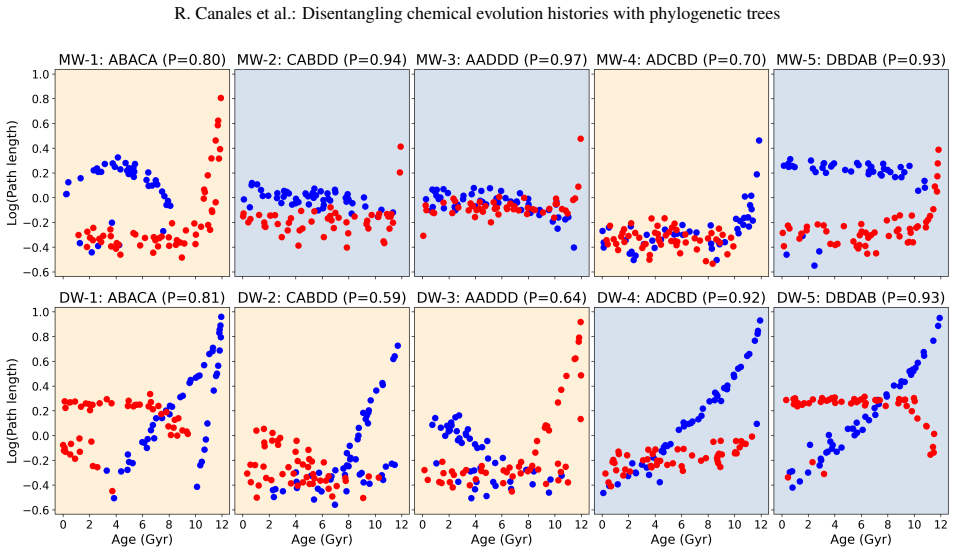
- Branch length and topology encode the rate of chemical evolution, while the join point between branches records shared history.
- The trees connect at their most metal-rich ends, reversing the pattern typical of biological phylogenies.
Where Pith is reading between the lines
- Observed abundance patterns in real galaxies could be placed on such trees to infer whether they share an eta-driven outflow history.
- The method might be extended to multi-zone or hydrodynamical simulations to test whether spatial structure preserves or erases the inheritance signal.
- If the metal-rich tip connection persists in data, it would imply a fundamental directionality difference between chemical enrichment and biological descent.
- Abundance surveys with high precision could be searched for tree-like clustering that correlates with independent outflow measurements.
Editorial analysis
A structured set of objections, weighed in public.
Referee Report
Summary. The manuscript claims that phylogenetic trees constructed from chemical abundance vectors of 1024 flexCE one-zone chemical evolution models (plus two fiducial models) can separate distinct evolutionary pathways, with random forests and Shapley analysis identifying the mass-loading outflow parameter η as having the largest impact on branch separation due to its role in chemical enrichment.
Significance. If the quantitative separation results hold, the work demonstrates a controlled test of phylogenetic methods on galactic chemical evolution data and highlights the value of interpretable ML (random forests + Shapley) for ranking input parameters in a large model ensemble. The experimental design with 1024 runs provides a reproducible framework for testing method sensitivity.
major comments (3)
- [Abstract] Abstract and results description: the central claim that the trees 'split the two input models' and that η dominates separation lacks any reported quantitative metrics (e.g., purity scores, silhouette coefficients, or branch-separation statistics), which are required to evaluate whether the phylogenetic approach succeeds beyond visual inspection.
- [Results] Methods/results on random forest + Shapley: no cross-validation, out-of-bag error rates, or uncertainty estimates on the feature-importance ranking are provided, so the robustness of the conclusion that η has the 'largest impact' cannot be assessed.
- [Discussion] Discussion: the interpretation that phylogenetic trees reconstruct histories because 'information is inherited between generations' is invoked to motivate the method, yet the paper supplies no direct test (e.g., comparison of tree topologies against known inheritance structure in the flexCE outputs) showing that abundance vectors satisfy this premise at a level that justifies the approach over standard clustering.
minor comments (1)
- [Abstract] The statement that 'branches connected through the most metal rich tips' is opposite to biological trees would benefit from a precise definition of tip ordering and a quantitative comparison of metal-rich vs. metal-poor connections.
Simulated Author's Rebuttal
We thank the referee for the constructive report. The comments highlight areas where additional quantitative support and validation will strengthen the manuscript. We address each major comment below and will revise accordingly.
read point-by-point responses
-
Referee: [Abstract] Abstract and results description: the central claim that the trees 'split the two input models' and that η dominates separation lacks any reported quantitative metrics (e.g., purity scores, silhouette coefficients, or branch-separation statistics), which are required to evaluate whether the phylogenetic approach succeeds beyond visual inspection.
Authors: We agree that quantitative metrics are required to move beyond visual assessment. In the revised manuscript we will report purity scores quantifying how cleanly the two fiducial models are separated on the trees, together with silhouette coefficients and branch-separation statistics for the primary splits. These metrics will be added to both the abstract and the results section. revision: yes
-
Referee: [Results] Methods/results on random forest + Shapley: no cross-validation, out-of-bag error rates, or uncertainty estimates on the feature-importance ranking are provided, so the robustness of the conclusion that η has the 'largest impact' cannot be assessed.
Authors: We accept that the current random-forest and Shapley analysis lacks explicit validation. We will add k-fold cross-validation, report out-of-bag error rates, and supply bootstrap-derived uncertainty estimates (standard errors) on both the feature-importance ranking and the Shapley values. This will allow readers to assess the robustness of the conclusion that η is the dominant parameter. revision: yes
-
Referee: [Discussion] Discussion: the interpretation that phylogenetic trees reconstruct histories because 'information is inherited between generations' is invoked to motivate the method, yet the paper supplies no direct test (e.g., comparison of tree topologies against known inheritance structure in the flexCE outputs) showing that abundance vectors satisfy this premise at a level that justifies the approach over standard clustering.
Authors: The referee correctly notes the absence of an explicit test of the inheritance premise. While the observed separation by η is consistent with chemical abundances carrying evolutionary information, we did not directly compare tree topologies against the known parameter structure. In revision we will add a quantitative comparison of the recovered tree topologies with the clustering structure in the input-parameter space and will contrast the phylogenetic results with those obtained from standard clustering (e.g., k-means) on the same abundance vectors. revision: yes
Circularity Check
No significant circularity: simulation sensitivity analysis on controlled inputs
full rationale
The paper generates synthetic chemical abundance vectors by running 1024 flexCE one-zone models while varying input parameters (including η), constructs phylogenetic trees on those vectors plus fiducials, and applies standard random-forest + Shapley feature ranking to quantify which parameters most affect tree separation. The headline result that η dominates is the direct numerical output of that supervised ranking procedure; it does not reduce to a tautology, self-definition, or fitted-input-renamed-as-prediction. No load-bearing self-citations, uniqueness theorems, or ansatzes imported from prior work appear in the derivation chain. The biological-inheritance framing is presented only as motivation, not as a premise required for the quantitative result. The derivation is therefore self-contained against external benchmarks.
Axiom & Free-Parameter Ledger
free parameters (1)
- η (mass-loading outflow parameter)
axioms (1)
- domain assumption Chemical elements encode information that is inherited between generations of stars in a manner analogous to genetic traits.
Cite this review
Pith. "Pith review of Disentangling chemical evolution histories with phylogenetic trees." pith.science (2026). https://pith.science/paper/HZ5ONYUA
@misc{pith2026260609284,
  author       = {Pith},
  title        = {Pith review of: Disentangling chemical evolution histories with phylogenetic trees},
  year         = {2026},
  howpublished = {\url{https://pith.science/paper/HZ5ONYUA}},
  note         = {Machine review of arXiv:2606.09284}
}
read the original abstract
Chemical abundances encode the fossil record of galaxy evolution in a complex and diverse way that requires innovative approaches to reconstruct galactic histories. We investigate the power of using phylogenetic methods to disentangle different evolutionary pathways in analytical chemical evolution models. We ran 1024 one-zone chemical evolution models using flexCE. The resulting chemical abundances are combined with those of two fiducial models, mw-fid and dw-fid, and then used both to determine which combinations produce two-branched phylogenetic trees, as well as how purely these trees split the two input models. We used random forests and Shapley analysis to predict which model combinations return well-separated trees and explain which input parameters are most important for this. We also studied the abundance patterns, as well as star formation rates, mass accumulation, and branch lengths. We found that {\eta}, the mass-loading outflow parameter in flexCE, had the largest impact in separating models into separate branches, due to its importance in driving the chemical enrichment rates and total abundances. Star formation rates and mass accumulation had some impact on {\eta}, but no direct relation between these quantities and the abundances was found. We also found that branches connected through the most metal rich tips in our trees, which is opposite to how phylogenetic trees connect in biological systems. Phylogenetic trees help to reconstruct histories when there is information that is inherited between generations, which is the case of the chemical elements in galaxy evolution. Branch topologies can provide information about the rates of evolutionary change of the various populations, and the connection between branches also contains information about their shared history. This work brings us a step further understanding galaxy evolution through cross-disciplinary research.
Figures


Reference graph
Works this paper leans on
-
[1]
X., et al
Anders, F., Chiappini, C., Santiago, B. X., et al. 2018, A&A, 619, A125
2018
-
[2]
H., Weinberg, D
Andrews, B. H., Weinberg, D. H., Schönrich, R., & Johnson, J. A. 2017, The Astrophysical Journal, 835, 224
2017
-
[3]
A., Mendez, D., Ezzeddine, R., et al
Barth, N. A., Mendez, D., Ezzeddine, R., et al. 2025, ApJ, 985, 129
2025
-
[4]
A., Smith, S
Baum, D. A., Smith, S. D., & Donovan, S. S. 2005, Science, 310, 979
2005
-
[5]
2013, New Astronomy Reviews, 57, 100
Belokurov, V . 2013, New Astronomy Reviews, 57, 100
2013
-
[6]
Bensby, T., Feltzing, S., & Oey, M. S. 2014, A&A, 562, A71
2014
-
[7]
F., Wild, V ., Vale Asari, N., & D’Eugenio, F
Boardman, N. F., Wild, V ., Vale Asari, N., & D’Eugenio, F. 2025, Monthly No- tices of the Royal Astronomical Society, 540, 2667
2025
-
[8]
2022, A&A Rev., 30, 3
Boselli, A., Fossati, M., & Sun, M. 2022, A&A Rev., 30, 3
2022
-
[9]
The History of Star Formation in Galaxies
Brown, T. M., Postman, M., & Calzetti, D. 2012, arXiv e-prints, arXiv:1209.4141
work page internal anchor Pith review Pith/arXiv arXiv 2012
-
[10]
M., & Hawkins, K
Buckley, N., Das, P., Jofré, P., Yates, R. M., & Hawkins, K. 2024, MNRAS, 534, 1985
2024
-
[11]
E., et al
Buder, S., Kos, J., Wang, X. E., et al. 2025, PASA, 42, e051
2025
-
[12]
K., et al
Buder, S., Lind, K., Ness, M. K., et al. 2022, MNRAS, 510, 2407
2022
-
[13]
M., Burbidge, G
Burbidge, E. M., Burbidge, G. R., Fowler, W. A., & Hoyle, F. 1957, Reviews of Modern Physics, 29, 547
1957
-
[14]
J., Fattahi, A., Callingham, T
Carrillo, A., Deason, A. J., Fattahi, A., Callingham, T. M., & Grand, R. J. J. 2024, MNRAS, 527, 2165
2024
-
[15]
2021, A&A, 654, A151
Casamiquela, L., Castro-Ginard, A., Anders, F., & Soubiran, C. 2021, A&A, 654, A151
2021
-
[16]
& Limongi, M
Chieffi, A. & Limongi, M. 2004, ApJ, 608, 405 Chru´sli´nska, Pakmor, R., Matthee, J., & Matsuno, T. 2024, Astronomy & Astro- physics, 686, A186
2004
-
[17]
2020, MNRAS, 493, 5195 de Brito Silva, D., Jofré, P., Tissera, P
Das, P., Hawkins, K., & Jofré, P. 2020, MNRAS, 493, 5195 de Brito Silva, D., Jofré, P., Tissera, P. B., et al. 2024, The Astrophysical Journal, 962, 154 de Jong, R. S., Agertz, O., Berbel, A. A., et al. 2019, The Messenger, 175, 3 De Silva, G. M., Freeman, K. C., Bland-Hawthorn, J., et al. 2015, Monthly No- tices of the Royal Astronomical Society, 449, 26...
2020
-
[18]
E., García-Rojas, J., & Arellano-Córdova, K
Esteban, C., Méndez-Delgado, J. E., García-Rojas, J., & Arellano-Córdova, K. Z. 2022, ApJ, 931, 92
2022
-
[19]
1985, The American Naturalist, 125, 1
Felsenstein, J. 1985, The American Naturalist, 125, 1
1985
-
[20]
& Bland-Hawthorn, J
Freeman, K. & Bland-Hawthorn, J. 2002, Annual Review of Astronomy and Astrophysics, 40, 487 Gaia Collaboration, Vallenari, A., Brown, A. G. A., et al. 2023, A&A, 674, A1
2002
-
[21]
K., Pilkington, K., Brook, C
Gibson, B. K., Pilkington, K., Brook, C. B., Stinson, G. S., & Bailin, J. 2013, A&A, 554, A47
2013
-
[22]
2012, The Messenger, 147, 25
Gilmore, G., Randich, S., Asplund, M., et al. 2012, The Messenger, 147, 25
2012
-
[23]
The heartbeat of stellar halos: Insights from the stellar halo mass-metallicity relation
Gonzalez-Jara, J., Tissera, P. B., Monachesi, A., et al. 2025, arXiv e-prints, arXiv:2512.07780
work page internal anchor Pith review Pith/arXiv arXiv 2025
-
[24]
2015, MNRAS, 453, 758
Hawkins, K., Jofré, P., Masseron, T., & Gilmore, G. 2015, MNRAS, 453, 758
2015
-
[25]
2006, in Phylogenetic Methods and the Prehistory of Languages, ed
Heggarty, P. 2006, in Phylogenetic Methods and the Prehistory of Languages, ed. P. Forster & C. Renfrew (McDonald Institute for Archaeological Research), 183–194
2006
-
[26]
2020, ARA&A, 58, 205
Helmi, A. 2020, ARA&A, 58, 205
2020
-
[27]
P., Mackereth, J
Horta, D., Schiavon, R. P., Mackereth, J. T., et al. 2023, MNRAS, 520, 5671
2023
-
[28]
1999, ApJS, 125, 439
Iwamoto, K., Brachwitz, F., Nomoto, K., et al. 1999, ApJS, 125, 439
1999
-
[29]
2021, Monthly Notices of the Royal Astronomical Society, 502, 32 Jofré, P., Aguilera-Gómez, C., Villarreal, P., et al
Jackson, H., Jofré, P., Yaxley, K., et al. 2021, Monthly Notices of the Royal Astronomical Society, 502, 32 Jofré, P., Aguilera-Gómez, C., Villarreal, P., et al. 2025, A&A, 699, A291 Jofré, P., Das, P., Bertranpetit, J., & Foley, R. 2017, Monthly Notices of the Royal Astronomical Society, 467, 1140 Jofré, P., Heiter, U., & Soubiran, C. 2019, ARA&A, 57, 571
2021
-
[30]
Karakas, A. I. 2010, MNRAS, 403, 1413
2010
-
[31]
A., Rix, H.-W., Aerts, C., et al
Kollmeier, J. A., Rix, H.-W., Aerts, C., et al. 2026, AJ, 171, 52
2026
-
[32]
S., Allende Prieto, C., et al
Koposov, S., Li, T. S., Allende Prieto, C., et al. 2026, The Open Journal of As- trophysics, 9, 55260
2026
-
[33]
2002, Science, 295, 82
Kroupa, P. 2002, Science, 295, 82
2002
-
[34]
O., Pérez-Villegas, A., et al
Limberg, G., Souza, S. O., Pérez-Villegas, A., et al. 2022, The Astrophysical Journal, 935, 109
2022
-
[35]
& Chieffi, A
Limongi, M. & Chieffi, A. 2006, ApJ, 647, 483
2006
-
[36]
2023, A&A, 669, A119
Magrini, L., Viscasillas Vázquez, C., Spina, L., et al. 2023, A&A, 669, A119
2023
-
[37]
R., Schiavon, R
Majewski, S. R., Schiavon, R. P., Frinchaboy, P. M., et al. 2017, AJ, 154, 94
2017
-
[38]
T., Heckman, T
Marlowe, A. T., Heckman, T. M., Wyse, R. F. G., & Schommer, R. 1995, ApJ, 438, 563
1995
-
[39]
2012, Chemical Evolution of Galaxies (Springer) Mészáros, S., Jofré, P., Johnson, J
Matteucci, F. 2012, Chemical Evolution of Galaxies (Springer) Mészáros, S., Jofré, P., Johnson, J. A., et al. 2025, AJ, 170, 96 Mészáros, S., Masseron, T., Fernández-Trincado, J. G., et al. 2021, MNRAS, 505, 1645
2012
-
[40]
2008, Reviews in Mineral- ogy & Geochemistry - REV MINERAL GEOCHEM, 68, 31
Meyer, B., Nittler, L., Nguyen, A., & Messenger, S. 2008, Reviews in Mineral- ogy & Geochemistry - REV MINERAL GEOCHEM, 68, 31
2008
-
[41]
K., Johnston, K
Ness, M. K., Johnston, K. V ., Blancato, K., et al. 2019, The Astrophysical Jour- nal, 883, 177 O’Brien, M. J., Vidiella, B., Duran-Nebreda, S., Bentley, R. A., & Valverde, S. 2025, Biological Theory, 20, 189
2019
-
[42]
2011, Journal of Machine Learning Research, 12, 2825
Pedregosa, F., Varoquaux, G., Gramfort, A., et al. 2011, Journal of Machine Learning Research, 12, 2825
2011
-
[43]
2026, A&A, 705, A106
Rhee, J., Pichon, C., Dubois, Y ., et al. 2026, A&A, 705, A106
2026
-
[44]
2013, masterthesis, Universitätsbibliothek Johann Christian Sencken- berg
Ritter, C. 2013, masterthesis, Universitätsbibliothek Johann Christian Sencken- berg
2013
-
[45]
& Nei, M
Saitou, N. & Nei, M. 1987, Molecular Biology and Evolution, 4, 406
1987
-
[46]
S., Mistry, D., Ortega-Martorell, S., & Olier, I
Sante, A., Font, A. S., Mistry, D., Ortega-Martorell, S., & Olier, I. 2026, MN- RAS, 547, stag503
2026
-
[47]
1959, ApJ, 129, 243 Schönrich, R
Schmidt, M. 1959, ApJ, 129, 243 Schönrich, R. & McMillan, P. J. 2017, MNRAS, 467, 1154
1959
-
[48]
2024, A&A, 688, A165
Signor, T., Jofré, P., Martí, L., & Sánchez-Pi, N. 2024, A&A, 688, A165
2024
-
[49]
Simon, J. D. 2019, ARA&A, 57, 375
2019
-
[50]
M., Grand, R
Simpson, C. M., Grand, R. J. J., Gómez, F. A., et al. 2018, MNRAS, 478, 548
2018
-
[51]
R., Schweitzer, D
Smith, R., Gai, M., Stern, S. R., Schweitzer, D. K., & Ahmed, M. W. 2021, Nature Communications, 12, 5920
2021
-
[52]
V ., & Kovtyukh, V
Soubiran, C., Bienaymé, O., Mishenina, T. V ., & Kovtyukh, V . V . 2008, A&A, 480, 91
2008
-
[53]
I., et al
Spina, L., Meléndez, J., Karakas, A. I., et al. 2016, A&A, 593, A125
2016
-
[54]
2025, A&A, 702, A267
Spina, L., Quandt Rodriguez, M., Magrini, L., et al. 2025, A&A, 702, A267
2025
-
[55]
Reconstructing chemical enrichment pathways in disc galaxies: A phylogenetic approach
Tapia-Contreras, B., Tissera, P. B., Sillero, E., et al. 2026, arXiv e-prints, arXiv:2604.11974
work page internal anchor Pith review Pith/arXiv arXiv 2026
-
[56]
F., Battaglia, G., Grand, R
Thomas, G. F., Battaglia, G., Grand, R. J. J., & Aguiar Álvarez, A. 2025, A&A, 704, A40
2025
-
[57]
Tinsley, B. M. 1979, The Astrophysical Journal, 229, 1046
1979
-
[58]
B., Rosas-Guevara, Y ., Bower, R
Tissera, P. B., Rosas-Guevara, Y ., Bower, R. G., et al. 2019, MNRAS, 482, 2208
2019
-
[59]
A., Irwin, M., Shetrone, M
Venn, K. A., Irwin, M., Shetrone, M. D., et al. 2004, AJ, 128, 1177
2004
-
[60]
2017, MNRAS, 466, 2939
Vincenzo, F., Matteucci, F., & Spitoni, E. 2017, MNRAS, 466, 2939
2017
-
[61]
2024, Monthly Notices of the Royal Astro- nomical Society, 529, 2946
Walsen, K., Jofré, P., Buder, S., et al. 2024, Monthly Notices of the Royal Astro- nomical Society, 529, 2946
2024
-
[62]
H., Andrews, B
Weinberg, D. H., Andrews, B. H., & Freudenburg, J. 2017, ApJ, 837, 183
2017
-
[63]
2022, ApJ, 933, 222
Xu, X., Heckman, T., Henry, A., et al. 2022, ApJ, 933, 222
2022
-
[64]
2014, Molecular evolution: a statistical approach (Oxford University Press)
Yang, Z. 2014, Molecular evolution: a statistical approach (Oxford University Press)
2014
-
[65]
& Lind, K
Youakim, K. & Lind, K. 2025, A&A, 704, A296 Article number, page 12 of 15 R. Canales et al.: Disentangling chemical evolution histories with phylogenetic trees Appendix A: Abundance planes of the fiducial models Figure A.1 shows the chemical distribution of the same elements discussed in Fig. 2, but this time the abundance ratios are with respect to Fe an...
2025
This paper was first reviewed by grok-4.3 on June 27, 2026.
discussion (0)
Sign in with ORCID, Apple, or X to comment. Anyone can read and Pith papers without signing in.