REVIEW 3 major objections 20 references
Complexity synchronization of scaling exponents across coupled variables diagnoses cooperative performance in adaptive systems.
Reviewed by Pith at T0; open to challenge. T0 means a machine referee read the full paper against a public rubric. the ladder, T0–T4 →
T0 review · grok-4.3
2026-06-27 10:24 UTC pith:6T6A36T2
load-bearing objection This paper defines complexity synchronization as the correlation of sliding-window MDEA and DFA scaling exponents but supplies no results, statistics, or controls to show the measure is diagnostic rather than an artifact. the 3 major comments →
Complexity synchronization as a diagnostic and control principle for adaptive systems
The pith
A machine-rendered reading of the paper's core claim, the machinery that carries it, and where it could break.
Core claim
Complexity synchronization is defined as the correlation between time-dependent scaling exponents obtained from modified diffusion entropy analysis and detrended fluctuation analysis applied in sliding windows to the outputs of interacting agents. In the high-interaction regime of the tested multi-agent model, the MDEA version of this measure increases as cooperative performance improves, while the DFA version identifies a different coordination mode based on persistence. This allows identification of functionally relevant subsystems that can be targeted for repair when performance declines.
What carries the argument
Complexity synchronization (CS), the correlation of time-varying scaling exponents that quantifies synchronization of evolving temporal complexity across coupled variables.
Load-bearing premise
The correlation of scaling exponents from the two analysis methods in sliding windows measures genuine synchronization of temporal complexity that is functionally tied to cooperative performance rather than depending on window size or fitting details.
What would settle it
Finding no increase in CS with performance in the high-interaction regime, or finding that adjusting subsystems identified by CS fails to change performance.
If this is right
- MDEA-based CS increases with cooperative performance in high-interaction regimes.
- DFA-based CS captures persistence-dominated coordination modes distinct from the MDEA version.
- CS identifies functionally relevant subsystems within the adaptive system.
- CS provides a basis for targeted repair interventions when performance fails.
- CS serves as a general diagnostic framework for coordination in biological, social, and human-machine adaptive systems.
Where Pith is reading between the lines
- Monitoring CS in other adaptive systems could flag coordination breakdowns before average performance metrics decline.
- The separation of MDEA and DFA versions suggests that different complexity measures might be selected depending on the type of coordination being diagnosed.
- If CS proves robust, it could support engineering control loops that adjust agent interactions to restore synchronization.
Editorial analysis
A structured set of objections, weighed in public.
Referee Report
Summary. The paper proposes complexity synchronization (CS) — defined as the correlation between time-dependent scaling exponents from sliding-window modified diffusion entropy analysis (MDEA) and detrended fluctuation analysis (DFA) — as a diagnostic and control principle for adaptive systems. It tests the idea in a multi-agent predator-prey model with prisoner's-dilemma payoffs and claims that, in the high-interaction regime, MDEA-based CS increases with cooperative performance, DFA-based CS captures a distinct persistence mode, and CS can identify functionally relevant subsystems for targeted repair.
Significance. If the central claims are substantiated with quantitative evidence and appropriate controls, CS could supply a new, non-average metric for diagnosing internal coordination modes in adaptive systems and guiding interventions, with potential applicability across biological, social, and engineered domains beyond standard performance or payoff measures.
major comments (3)
- Abstract: the assertion that 'MDEA-based CS increases with cooperative performance' is stated without any quantitative results, error bars, statistical tests, parameter values, window sizes, or figures; the central empirical claim therefore lacks verifiable support from the presented text.
- Abstract (definition of CS): CS is defined directly as the correlation of scaling exponents obtained by applying MDEA and DFA to identical sliding-window segments of the same time series; because both estimators respond to local variance and trends, the observed correlation may be an artifact of the shared analysis pipeline rather than evidence of genuine complexity synchronization, and no surrogate tests, null models, or variation of window/overlap parameters are described to rule this out.
- Abstract (subsystem claim): the statement that 'CS can reveal functionally relevant subsystems' is made without any concrete procedure for identifying subsystems from the CS time series, any validation against known functional divisions in the agent model, or any demonstration that CS-based targeting improves repair outcomes over baseline methods.
Simulated Author's Rebuttal
We thank the referee for the detailed and constructive comments. We address each major point below and indicate planned revisions to strengthen the presentation of our results.
read point-by-point responses
-
Referee: [—] Abstract: the assertion that 'MDEA-based CS increases with cooperative performance' is stated without any quantitative results, error bars, statistical tests, parameter values, window sizes, or figures; the central empirical claim therefore lacks verifiable support from the presented text.
Authors: The abstract is intended as a concise summary of the central findings. The quantitative results, including error bars, statistical tests, specific parameter values, window sizes, and supporting figures, appear in the Results section of the full manuscript. To make the abstract more self-contained and directly responsive to this concern, we will revise it to include key quantitative metrics and explicit references to the relevant figures and parameter settings. revision: yes
-
Referee: [—] Abstract (definition of CS): CS is defined directly as the correlation of scaling exponents obtained by applying MDEA and DFA to identical sliding-window segments of the same time series; because both estimators respond to local variance and trends, the observed correlation may be an artifact of the shared analysis pipeline rather than evidence of genuine complexity synchronization, and no surrogate tests, null models, or variation of window/overlap parameters are described to rule this out.
Authors: This concern about possible methodological artifacts is well taken. The manuscript defines CS via the correlation of the two scaling exponents computed on identical windows. While MDEA and DFA target distinct aspects of scaling behavior, we agree that explicit controls are needed. In the revised manuscript we will add surrogate tests, null-model comparisons, and sensitivity analyses that vary window length and overlap to demonstrate that the reported correlations are not artifacts of the shared pipeline. revision: yes
-
Referee: [—] Abstract (subsystem claim): the statement that 'CS can reveal functionally relevant subsystems' is made without any concrete procedure for identifying subsystems from the CS time series, any validation against known functional divisions in the agent model, or any demonstration that CS-based targeting improves repair outcomes over baseline methods.
Authors: We acknowledge that the abstract statement would benefit from greater specificity. The full manuscript outlines the procedure for extracting subsystems from CS time series, validates the identified subsystems against the known functional structure of the predator-prey model, and compares CS-guided repair against baseline interventions. We will revise the abstract to briefly describe the identification procedure and the validation approach, and we will ensure the main text makes the comparative performance of CS-based targeting explicit. revision: partial
Circularity Check
No significant circularity detected; empirical test of defined measure.
full rationale
The paper explicitly defines CS as the correlation of time-dependent scaling exponents from sliding-window MDEA and DFA applied to the same trajectories, then reports an empirical observation that MDEA-based CS increases with cooperative performance in the high-interaction regime of the multi-agent model. This is an observational claim tested in simulation rather than a derivation that reduces by construction to its inputs via self-definition, fitted-parameter renaming, or self-citation chains. No equations, uniqueness theorems, or ansatzes are presented that would force the diagnostic utility from the definition alone. The central result remains an independent empirical finding whose validity can be assessed externally.
Axiom & Free-Parameter Ledger
free parameters (2)
- scaling exponents (MDEA and DFA)
- window size and overlap for sliding analysis
axioms (1)
- domain assumption Temporal complexity of a time series is adequately quantified by the scaling exponent obtained from DFA or MDEA
invented entities (1)
-
Complexity synchronization (CS)
no independent evidence
read the original abstract
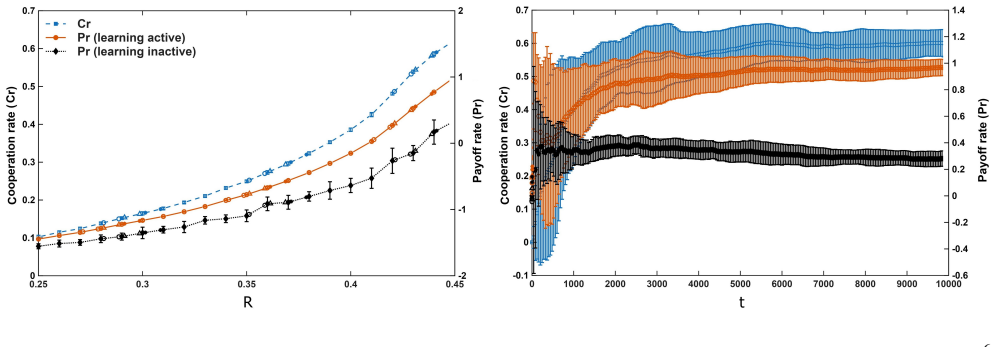
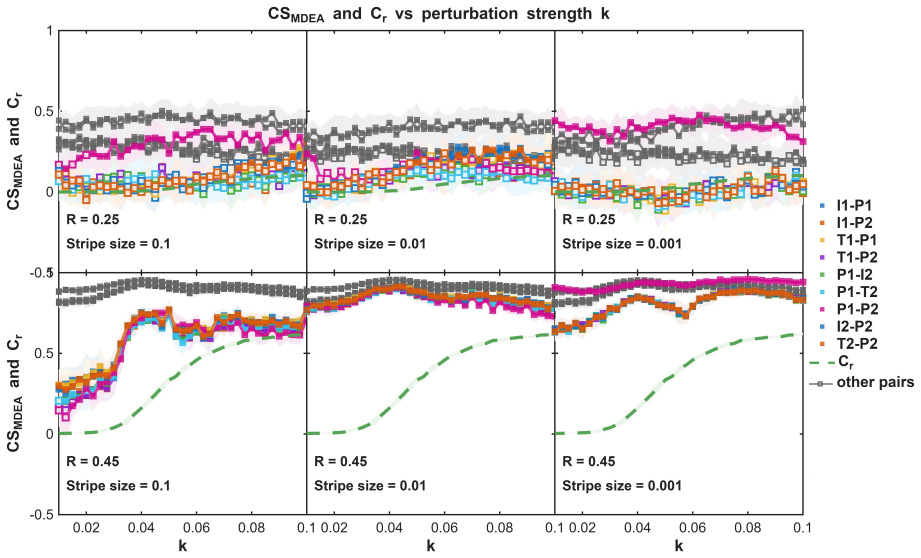
Adaptive systems can exhibit similar levels of performance while relying on fundamentally different internal modes of coordination. Standard metrics such as average cooperation or payoff indicate whether a system succeeds, but do not reveal how coordination is organized across interacting components or which adaptive variables should be targeted when performance fails. Here we propose complexity synchronization (CS), the synchronization of evolving temporal complexity across coupled variables, as a diagnostic and intervention guiding principle for adaptive systems. We test this idea in an adaptive multi agent system composed of Selfish Algorithm agents interacting in a reduced Predator Prey model with a Prisoners Dilemma like payoff structure. Temporal complexity is quantified using sliding window modified diffusion entropy analysis (MDEA) and detrended fluctuation analysis (DFA). CS is defined as the correlation between the resulting time dependent scaling exponents. In the high-interaction regime, MDEA-based CS increases with cooperative performance, whereas DFA based CS captures a distinct persistence dominated coordination mode. Our results show that CS can reveal functionally relevant subsystems and provide a principled basis for targeted repair. More broadly, CS offers a general diagnostic and engineering framework for understanding and controlling coordination in biological, social, human machine, and other adaptive systems.
Figures






Reference graph
Works this paper leans on
-
[1]
Axelrod, R. & Hamilton, W. D. The evolution of cooperation.Science211, 1390–1396, DOI: 10.1126/science.7466396 (1981)
-
[2]
Nowak, M. A. Five rules for the evolution of cooperation.Science314, 1560–1563, DOI: 10.1126/science.1133755 (2006). 3.Strogatz, S. H.Sync: How Order Emerges from Chaos in the Universe, Nature, and Daily Life(Hyperion, 2003). 32/33
-
[3]
& Kurths, J.Synchronization: A Universal Concept in Nonlinear Sciences(Cambridge University Press, 2001)
Pikovsky, A., Rosenblum, M. & Kurths, J.Synchronization: A Universal Concept in Nonlinear Sciences(Cambridge University Press, 2001)
2001
-
[4]
Dumas, G., Nadel, J., Soussignan, R., Martinerie, J. & Garnero, L. Inter-brain synchronization during social interaction. PLOS ONE5, e12166, DOI: 10.1371/journal.pone.0012166 (2010)
-
[5]
Konvalinka, I.et al.Synchronized arousal between performers and related spectators in a fire-walking ritual.Proc. Natl. Acad. Sci.108, 8514–8519, DOI: 10.1073/pnas.1016955108 (2011)
-
[6]
E., Grigolini, P., Franaszczuk, P
Mahmoodi, K., Kerick, S. E., Grigolini, P., Franaszczuk, P. J. & West, B. J. Complexity synchronization: a measure of interaction between the brain, heart and lungs.Sci. Reports13, 11433 (2023)
2023
-
[7]
J., Grigolini, P., Kerick, S
West, B. J., Grigolini, P., Kerick, S. E., Franaszczuk, P. J. & Mahmoodi, K. Complexity synchronization of organ networks. Entropy25, 1393 (2023)
2023
-
[8]
Mahmoodi, K., West, B. J. & Grigolini, P. Self-organizing complex networks: individual versus global rules.Front. Physiol. 8, 478 (2017)
2017
-
[9]
Mahmoodi, K., West, B. J. & Gonzalez, C. Selfish algorithm and emergence of collective intelligence.J. Complex Networks8, cnaa019 (2020)
2020
-
[10]
& Barabási, A.-L
Liu, Y .-Y ., Slotine, J.-J. & Barabási, A.-L. Controllability of complex networks.Nature473, 167–173, DOI: 10.1038/ nature10011 (2011)
2011
-
[11]
Cornelius, S. P., Kath, W. L. & Motter, A. E. Realistic control of network dynamics.Nat. Commun.4, 1942, DOI: 10.1038/ncomms2939 (2013)
-
[12]
Gao, J., Barzel, B. & Barabási, A.-L. Universal resilience patterns in complex networks.Nature530, 307–312, DOI: 10.1038/nature16948 (2016)
-
[13]
& Gonzalez, C
Mahmoodi, K. & Gonzalez, C. Emergence of collective cooperation and networks from selfish-trust and selfish-connections. InProceedings of the Annual Meeting of the Cognitive Science Society, 2254–2260 (2019)
2019
-
[14]
Aquino, G., Bologna, M., West, B. J. & Grigolini, P. Transmission of information between complex systems: 1/f resonance. Phys. Rev. E83, 051130 (2011)
2011
-
[15]
J., Geneston, E
West, B. J., Geneston, E. L. & Grigolini, P. Maximum information exchange between complex networks.Phys. Reports 468, 1–99 (2008)
2008
-
[16]
K., Buiatti, M
Kalashyan, A. K., Buiatti, M. & Grigolini, P. Ergodicity breakdown and scaling from single sequences.Chaos, Solitons & Fractals39, 895–909 (2009)
2009
-
[17]
& Raffaelli, G
Grigolini, P., Palatella, L. & Raffaelli, G. Asymmetric anomalous diffusion: An efficient way to detect memory in time series.Fractals6, 439–449 (2001)
2001
-
[18]
& Raffaelli, G
Allegrini, P., Grigolini, P., Hamilton, P., Palatella, L. & Raffaelli, G. Memory beyond memory in heart beating, a sign of a healthy physiological condition.Phys. Rev. E65, 041926 (2002). 20.Gautam, S. & Grigolini, P. From visibility graph to cognition.Front. Netw. Physiol.xxxx, xxx (2026)
2002
-
[19]
& West, B
Bologna, M., Grigolini, P. & West, B. J. Strange kinetics: conflict between density and trajectory description.Chem. Phys. 284, 115–128 (2002)
2002
-
[20]
& Grigolini, P
Bologna, M. & Grigolini, P. Lévy diffusion: the density versus the trajectory approach.J. Stat. Mech. Theory Exp.2009, P03005 (2009). 33/33
2009
discussion (0)
Sign in with ORCID, Apple, or X to comment. Anyone can read and Pith papers without signing in.