The Small-scale Structures in the Wind of Messier 82
Pith reviewed 2026-06-27 12:44 UTC · model grok-4.3
The pith
Separating filamentary from diffuse gas in M82's wind shows shocks gaining importance at larger heights.
A machine-rendered reading of the paper's core claim, the machinery that carries it, and where it could break.
Core claim
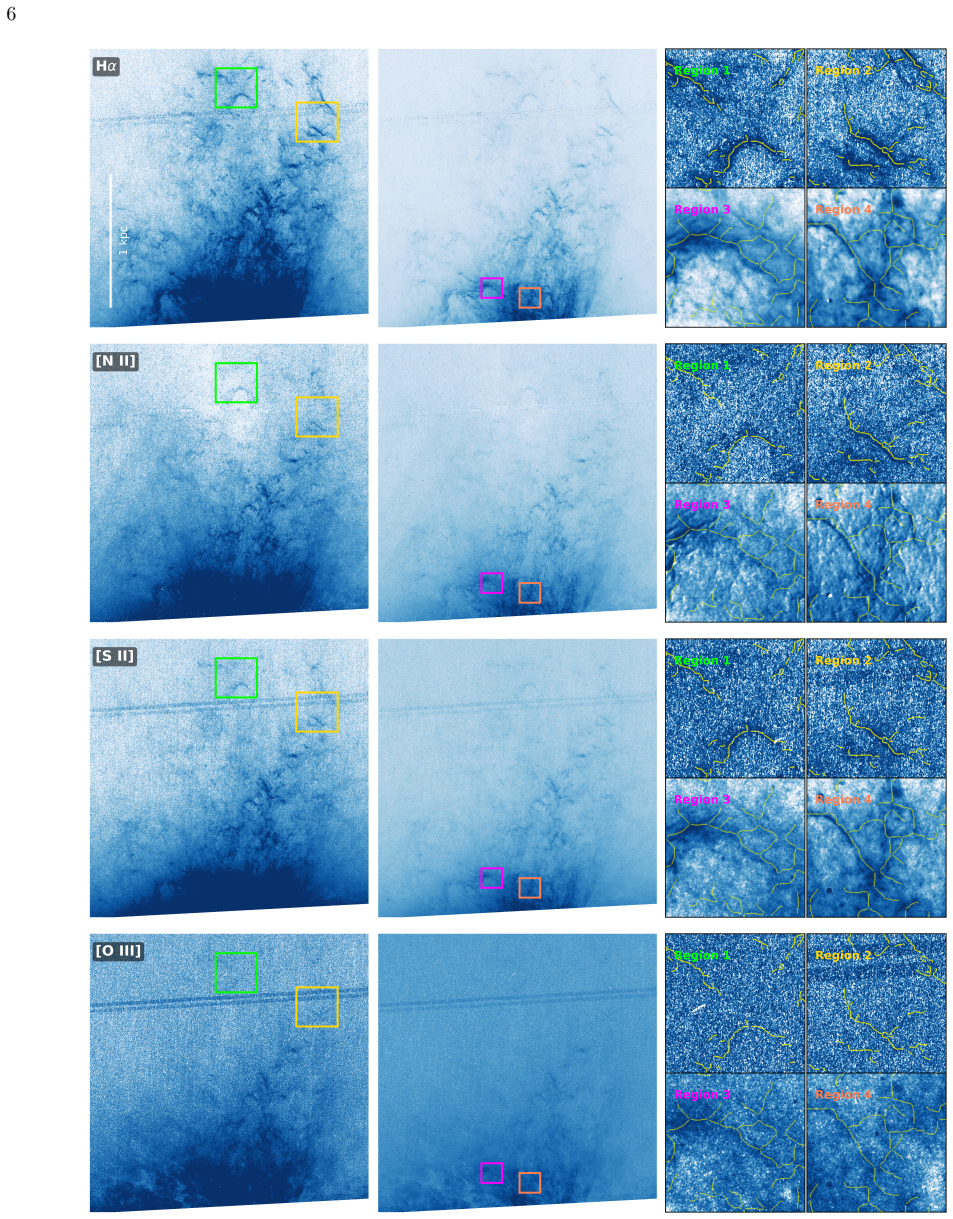
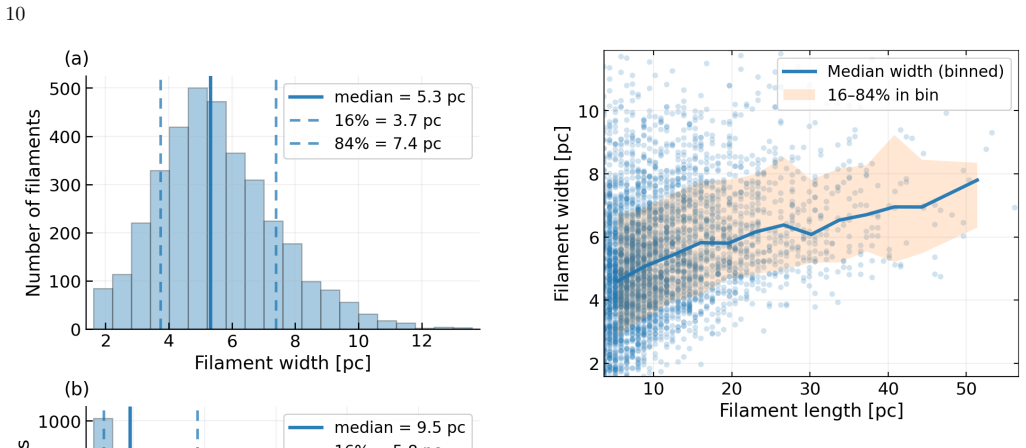
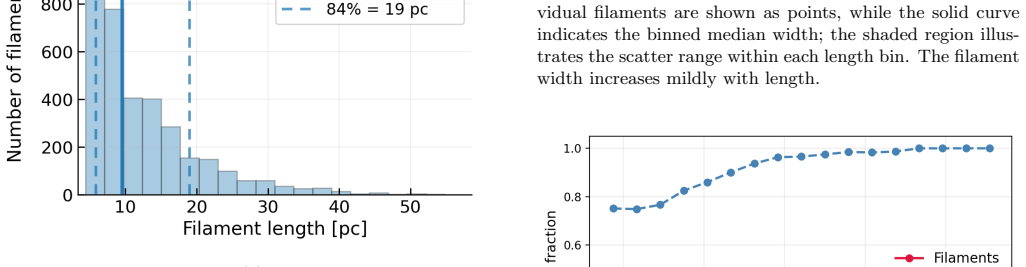
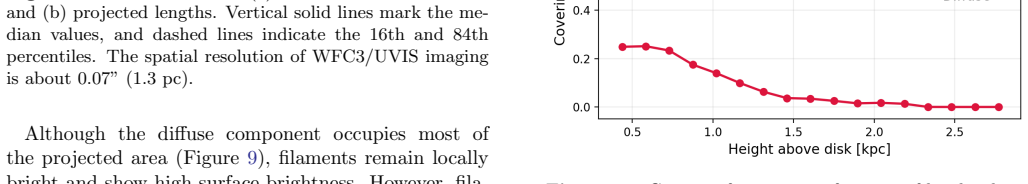
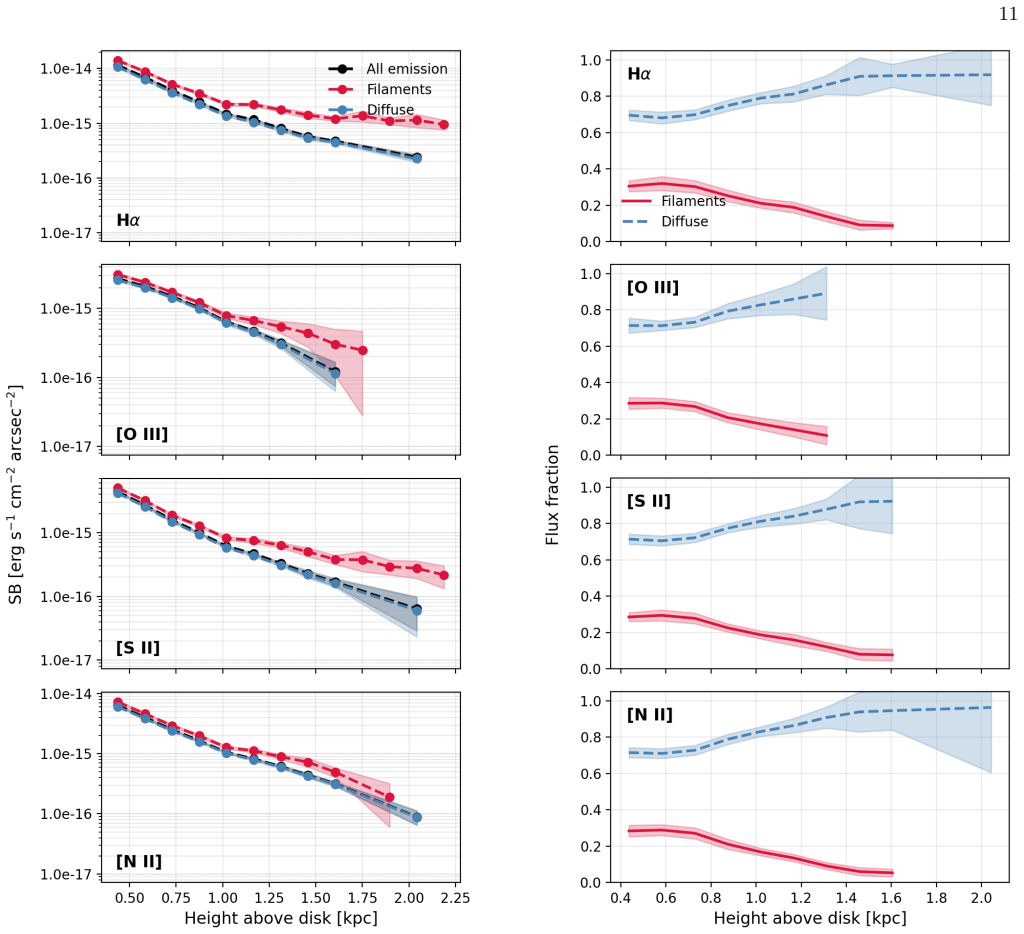
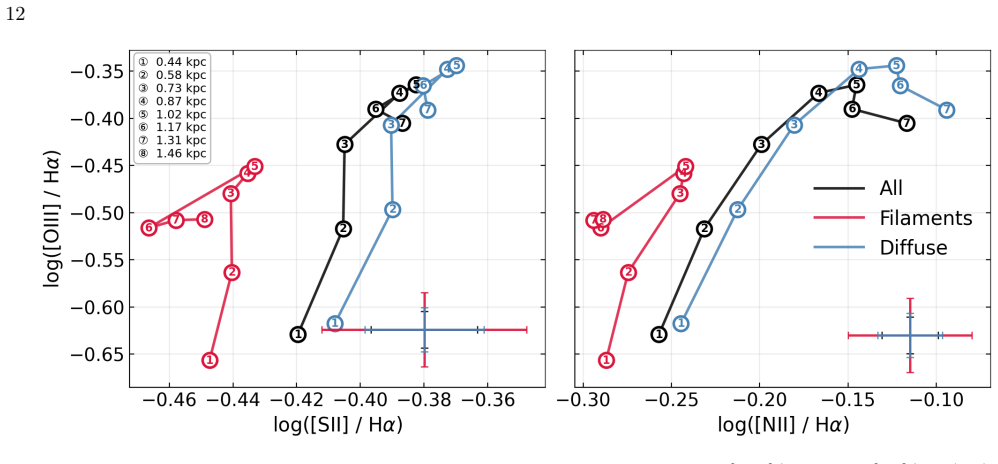
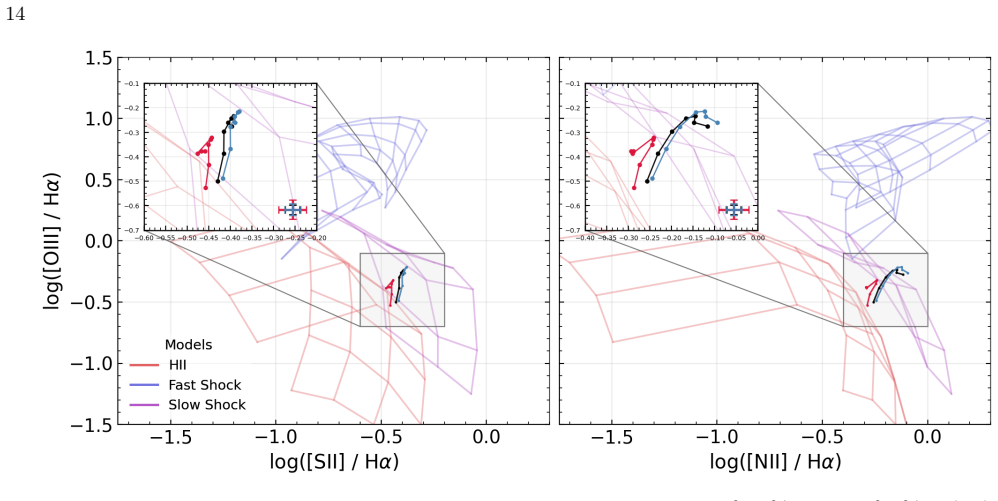
The Hα emission forms a highly connected network of compact filaments with typical projected widths of 5.3 pc and lengths of 9.5 pc. Both the projected covering fraction and the line-flux contribution of this filamentary component decline with height, leaving the outer wind increasingly dominated by diffuse emission. Optical line-ratio diagnostics show the warm ionized gas occupies an intermediate excitation regime in which photoionization by the central starburst can energetically power the observed Hα luminosity, while the systematic separation between filamentary and diffuse emission plus the evolution of the ratios with vertical distance point to an increasing contribution from shocks or
What carries the argument
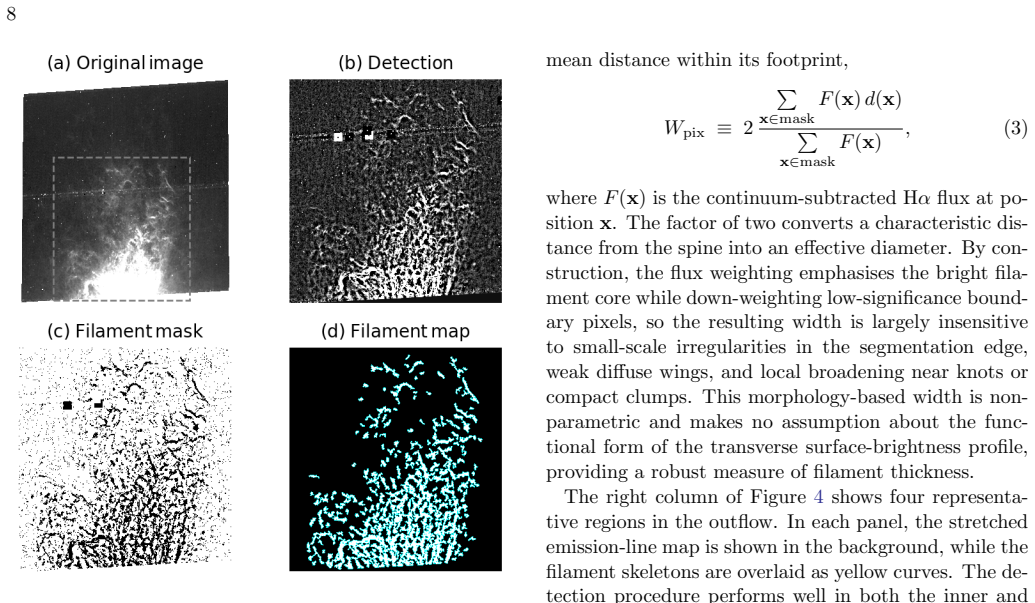
A filament-finding pipeline applied to the Hα image that isolates compact strands and knots from the diffuse background, paired with spatially resolved maps of optical line ratios.
If this is right
- The filamentary covering fraction and flux contribution both decline with vertical distance from the disk.
- Line ratios evolve with height such that shocks or analogous heating become more important in the diffuse outer wind.
- Photoionization from the central starburst remains energetically sufficient for the total observed Hα luminosity.
- High-resolution separation of filamentary and diffuse components directly links morphology to excitation state and multiphase structure.
Where Pith is reading between the lines
- Comparable filament networks are likely present in other starburst winds but will remain undetected without similar parsec-scale resolution.
- Wind models should treat filamentary and diffuse phases as distinct with height-dependent excitation mechanisms.
- Integral-field spectroscopy could check whether the observed line-ratio trends persist when line-of-sight confusion is reduced.
- Multi-wavelength data on the same filaments could test how the hot wind phase interacts with the warm strands.
Load-bearing premise
Optical line-ratio diagnostics can cleanly distinguish photoionization from shock excitation without major contamination from density variations, metallicity gradients, or projection effects.
What would settle it
If new spectroscopy at the same locations shows that filament and diffuse line ratios are statistically identical at every height, or if the apparent decline in filament fraction disappears when projection is modeled explicitly.
Figures
read the original abstract
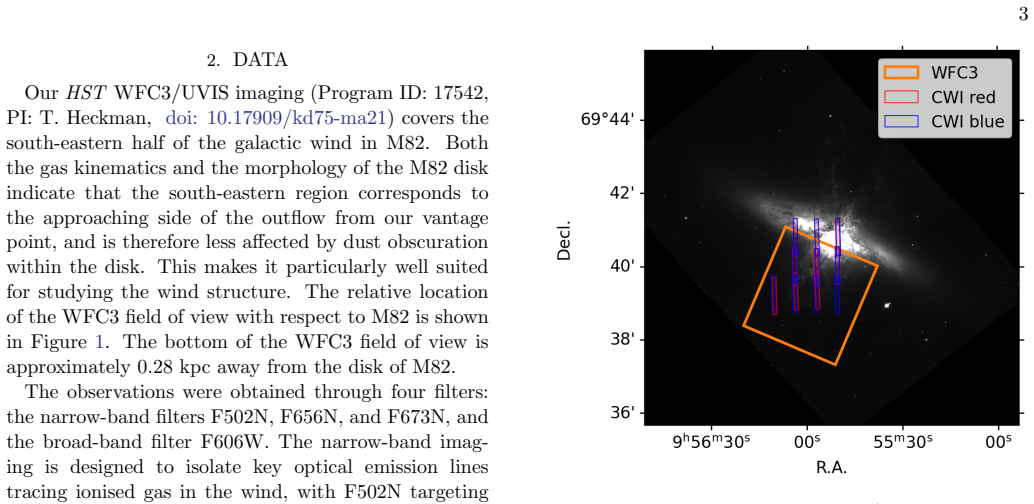
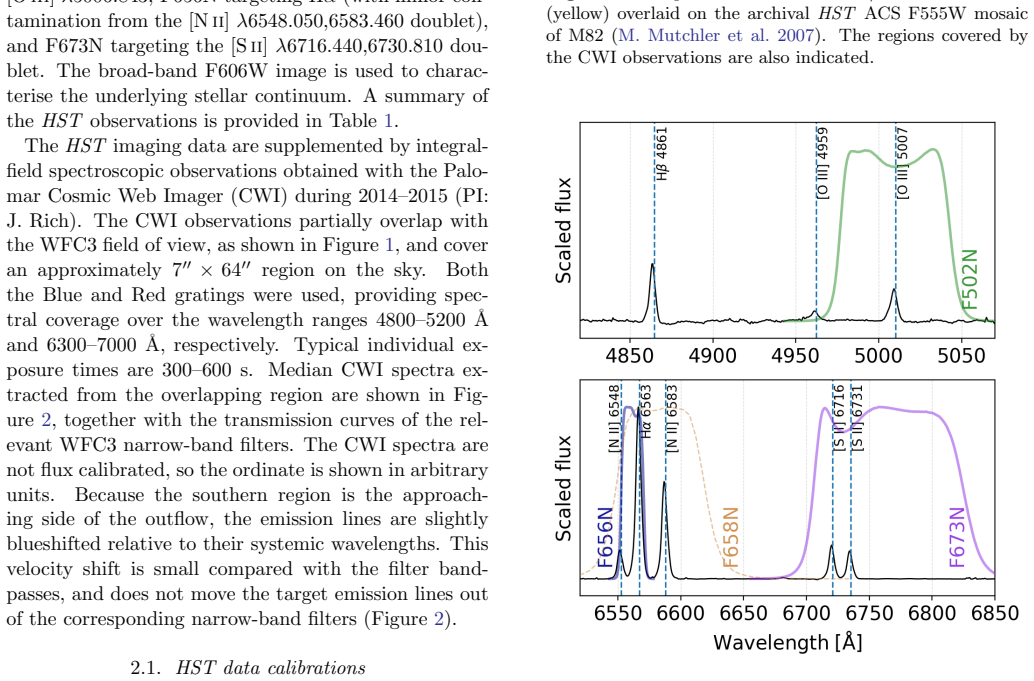
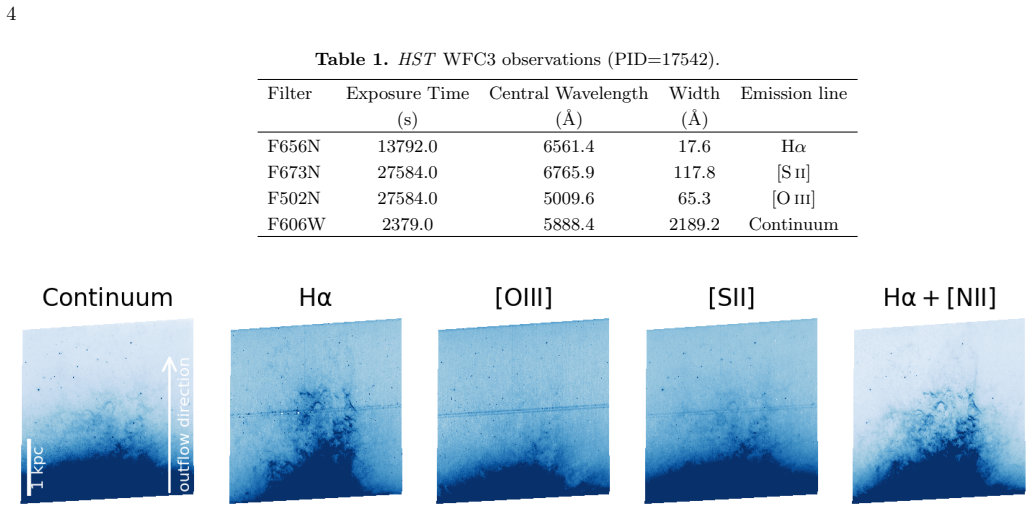
Small-scale multiphase structure plays a central role in galactic-wind evolution, yet the parsec-scale morphology and excitation of the warm ionised gas remain poorly constrained. We present deep HST narrow-band imaging of the southern wind of Messier 82 (M82) in H$\alpha$, [OIII], [SII], and [NII], designed to resolve the warm ionised phase on parsec scales. The H$\alpha$ emission is detected to $\approx$2.1 kpc above the disk, while the fainter emission lines are detected over smaller radial extents, with [OIII] reaching $\approx$ 1.5 kpc. We develop a filament-finding pipeline for the H$\alpha$ image and construct a quantitative catalogue of the filamentary structures. The wind forms a highly connected network of strands and knots, dominated by compact filaments with typical projected widths of $\approx$5.3 pc and lengths of $\approx$ 9.5 pc. Both the projected covering fraction and the line-flux contribution of the filamentary component decline with height, showing that the outer wind becomes increasingly dominated by diffuse emission. Optical line-ratio diagnostics indicate that the warm ionised gas occupies an intermediate excitation regime: photoionisation by the central starburst can energetically power the observed H$\alpha$ luminosity, while the systematic separation between filamentary and diffuse emission, together with the evolution of the line ratios with vertical distance, suggests an increasing contribution from shocks or other similar heating in the diffuse outer wind. These results show that separating filamentary and diffuse emission in high-resolution imaging provides a powerful way to connect the morphology, excitation, and multiphase structure of galactic winds.
Editorial analysis
A structured set of objections, weighed in public.
Referee Report
Summary. The paper presents deep HST narrow-band imaging of the southern wind of M82 in Hα, [OIII], [SII], and [NII] to resolve parsec-scale structure in the warm ionized gas. It develops a filament-finding pipeline on the Hα image to produce a quantitative catalogue, reports that filaments have typical projected widths of ~5.3 pc and lengths of ~9.5 pc, shows that both covering fraction and flux contribution of the filamentary component decline with height (so the outer wind is increasingly diffuse), and uses optical line-ratio diagnostics to place the gas in an intermediate excitation regime where photoionization by the starburst can power the observed Hα luminosity while the filament/diffuse separation and vertical trends suggest increasing shock or similar heating contributions in the diffuse outer wind.
Significance. If the central claim holds, the work supplies a new quantitative catalogue of wind filaments together with a demonstration that filament/diffuse separation in high-resolution imaging can connect morphology to excitation and multiphase structure. The deep HST dataset and the explicit pipeline for filament detection are concrete strengths that could serve as a template for other wind studies.
major comments (3)
- [line-ratio diagnostics and interpretation section] The claim that the systematic offset in line ratios between filamentary and diffuse components plus the vertical evolution indicates an increasing shock contribution rests on an untested interpretation. No quantitative grids of photoionization or shock models are presented that vary density (expected to span orders of magnitude), metallicity gradients, or line-of-sight integration through a filamentary medium; standard optical diagnostics are known to be degenerate under these conditions.
- [filament-finding pipeline and catalogue section] The filament-finding pipeline and resulting statistics (widths, lengths, covering fractions, flux contributions) lack reported validation, error analysis, or robustness tests against detection thresholds and background subtraction; without these the decline of the filamentary component with height cannot be verified as load-bearing for the morphology-excitation connection.
- [observations and data reduction section] Details on data reduction, continuum subtraction, flux calibration, and how the differing radial extents of the lines ([OIII] to 1.5 kpc vs. Hα to 2.1 kpc) affect the line-ratio maps are not supplied, undermining the reliability of the excitation trends used to support the central claim.
minor comments (2)
- [abstract] The abstract states that photoionization 'can energetically power' the Hα luminosity; a brief quantitative comparison (e.g., required ionizing photon rate vs. starburst output) would strengthen this statement.
- [figures and line-ratio plots] Notation for the line ratios (e.g., [OIII]/Hα, [SII]/Hα) should be defined consistently in the text and figures to avoid ambiguity when comparing filament vs. diffuse components.
Simulated Author's Rebuttal
We thank the referee for the thorough and constructive report. The comments highlight important areas for clarification and strengthening of the analysis. We address each major comment point-by-point below and outline the revisions we will make.
read point-by-point responses
-
Referee: The claim that the systematic offset in line ratios between filamentary and diffuse components plus the vertical evolution indicates an increasing shock contribution rests on an untested interpretation. No quantitative grids of photoionization or shock models are presented that vary density (expected to span orders of magnitude), metallicity gradients, or line-of-sight integration through a filamentary medium; standard optical diagnostics are known to be degenerate under these conditions.
Authors: We agree that the interpretation is qualitative and that full quantitative modeling grids would strengthen the case. Our analysis uses standard optical diagnostics applied to the observed trends in line ratios between filamentary and diffuse gas and their evolution with height. These trends are consistent with increasing shock heating in the outer diffuse wind, while photoionization remains energetically viable near the disk. We will revise the relevant section to explicitly discuss the known degeneracies (density, metallicity, LOS effects) and the suggestive rather than definitive nature of the conclusion. Adding new model grids is beyond the scope of the current dataset but we will note this limitation clearly. revision: partial
-
Referee: The filament-finding pipeline and resulting statistics (widths, lengths, covering fractions, flux contributions) lack reported validation, error analysis, or robustness tests against detection thresholds and background subtraction; without these the decline of the filamentary component with height cannot be verified as load-bearing for the morphology-excitation connection.
Authors: We will add a new subsection (or appendix) detailing validation of the filament-finding pipeline. This will include robustness tests varying detection thresholds, background subtraction methods, and comparisons to alternative approaches, along with error estimates on the derived widths, lengths, covering fractions, and flux contributions. These tests will confirm that the reported decline with height is robust. revision: yes
-
Referee: Details on data reduction, continuum subtraction, flux calibration, and how the differing radial extents of the lines ([OIII] to 1.5 kpc vs. Hα to 2.1 kpc) affect the line-ratio maps are not supplied, undermining the reliability of the excitation trends used to support the central claim.
Authors: We will expand the observations and data reduction section with the requested details on the HST pipeline, continuum subtraction, and flux calibration. For the line-ratio maps, we will clarify that ratios are computed only in regions where all lines exceed the adopted S/N threshold; the differing radial extents mean outer wind ratios rely primarily on Hα and [SII], and we will discuss how this is accounted for in the vertical trends. revision: yes
Circularity Check
No circularity: direct observational measurements and standard diagnostics
full rationale
The paper reports new HST narrow-band imaging, applies a filament-finding pipeline to produce a catalog of measured widths/lengths/covering fractions/line fluxes, and applies standard optical line-ratio diagnostics to the observed emission. All reported trends (decline of filamentary contribution with height, systematic line-ratio offsets, intermediate excitation regime) are direct outputs of these measurements on the data. No equations, fitted parameters, or predictions reduce to the inputs by construction; no self-citations are invoked as load-bearing uniqueness theorems or ansatzes; the central claim follows from the imaging and spectroscopy without self-referential loops.
Axiom & Free-Parameter Ledger
free parameters (1)
- filament detection thresholds
axioms (2)
- domain assumption Standard optical line-ratio diagnostics distinguish photoionization from shock heating in the warm ionized medium
- domain assumption Angular sizes can be converted to physical parsec scales using the known distance to M82
Reference graph
Works this paper leans on
-
[1]
Abruzzo, M. W., Bryan, G. L., & Fielding, D. B. 2022, ApJ, 925, 199, doi: 10.3847/1538-4357/ac3c48
-
[2]
, archivePrefix = "arXiv", eprint =
Allen, M. G., Groves, B. A., Dopita, M. A., Sutherland, R. S., & Kewley, L. J. 2008, ApJS, 178, 20, doi: 10.1086/589652
-
[3]
Armus, L., Heckman, T. M., & Miley, G. K. 1989, ApJ, 347, 727, doi: 10.1086/168164
-
[4]
2016, ApJ, 830, 72, doi: 10.3847/0004-637X/830/2/72
Chisholm, J., & Matsushita, S. 2016, ApJ, 830, 72, doi: 10.3847/0004-637X/830/2/72
-
[5]
Conroy, C., & Gunn, J. E. 2010, FSPS: Flexible Stellar Population Synthesis,, Astrophysics Source Code Library, record ascl:1010.043 http://ascl.net/1010.043
2010
-
[6]
Conroy, C., Gunn, J. E., & White, M. 2009, ApJ, 699, 486, doi: 10.1088/0004-637X/699/1/486
work page internal anchor Pith review doi:10.1088/0004-637x/699/1/486 2009
-
[7]
JWST Observations of Starbursts: Dust Processing in the M82 Superwind
Cronin, S. A., Bolatto, A. D., Richie, H. M., et al. 2026, arXiv e-prints, arXiv:2604.11873, doi: 10.48550/arXiv.2604.11873 de Blok, W. J. G., Walter, F., Ferguson, A. M. N., et al. 2018, ApJ, 865, 26, doi: 10.3847/1538-4357/aad557
work page internal anchor Pith review Pith/arXiv arXiv doi:10.48550/arxiv.2604.11873 2026
-
[8]
1999, ApJ, 510, 197, doi: 10.1086/306582
Devine, D., & Bally, J. 1999, ApJ, 510, 197, doi: 10.1086/306582
-
[9]
Fielding, D. B., Ostriker, E. C., Bryan, G. L., & Jermyn, A. S. 2020, ApJL, 894, L24, doi: 10.3847/2041-8213/ab8d2c
-
[10]
Fisher, D. B., Bolatto, A. D., Chisholm, J., et al. 2025, MNRAS, 538, 3068, doi: 10.1093/mnras/staf363
-
[11]
S., & et al
Fruchter, A. S., & et al. 2010, in 2010 Space Telescope Science Institute Calibration Workshop, 382–387
2010
-
[12]
2019, MNRAS, 485, 3409, doi: 10.1093/mnras/stz564
Gallagher, R., Maiolino, R., Belfiore, F., et al. 2019, MNRAS, 485, 3409, doi: 10.1093/mnras/stz564
-
[13]
Grasha, K., Roy, A., Sutherland, R. S., & Kewley, L. J. 2021, ApJ, 908, 241, doi: 10.3847/1538-4357/abd6bf
-
[14]
Gronke, M., & Oh, S. P. 2018, MNRAS, 480, L111, doi: 10.1093/mnrasl/sly131
-
[15]
Gronke, M., & Oh, S. P. 2020, MNRAS, 492, 1970, doi: 10.1093/mnras/stz3332
-
[16]
2026, arXiv e-prints, arXiv:2601.16566, doi: 10.48550/arXiv.2601.16566
Gronke, M., & Schneider, E. 2026, arXiv e-prints, arXiv:2601.16566, doi: 10.48550/arXiv.2601.16566
-
[17]
Guo, Y., Bacon, R., Bouch´ e, N. F., et al. 2023, Nature, 624, 53, doi: 10.1038/s41586-023-06718-w
-
[18]
Heckman, T. M., Armus, L., & Miley, G. K. 1990, ApJS, 74, 833, doi: 10.1086/191522
-
[19]
L., Mack, J., Avila, R., et al
Hoffmann, S. L., Mack, J., Avila, R., et al. 2021, in American Astronomical Society Meeting Abstracts, Vol. 53, American Astronomical Society Meeting Abstracts, 216.02
2021
-
[20]
Hopkins, P. F., Quataert, E., & Murray, N. 2011, MNRAS, 417, 950, doi: 10.1111/j.1365-2966.2011.19306.x
-
[21]
Jenkins, E. B. 2009, ApJ, 700, 1299, doi: 10.1088/0004-637X/700/2/1299
-
[22]
Kewley, L. J., Nicholls, D. C., & Sutherland, R. S. 2019, ARA&A, 57, 511, doi: 10.1146/annurev-astro-081817-051832
-
[23]
Klein, R. I., McKee, C. F., & Colella, P. 1994, ApJ, 420, 213, doi: 10.1086/173554
-
[24]
Koch, E. W., & Rosolowsky, E. W. 2015, MNRAS, 452, 3435, doi: 10.1093/mnras/stv1521
-
[25]
Krieger, N., Walter, F., Bolatto, A. D., et al. 2021, ApJL, 915, L3, doi: 10.3847/2041-8213/ac01e9
-
[26]
Lehnert, M. D., Heckman, T. M., & Weaver, K. A. 1999, ApJ, 523, 575, doi: 10.1086/307762
-
[27]
K., Walter, F., Martini, P., et al
Leroy, A. K., Walter, F., Martini, P., et al. 2015, ApJ, 814, 83, doi: 10.1088/0004-637X/814/2/83
-
[28]
Levy, R. C., Bolatto, A. D., Tarantino, E., et al. 2023, ApJ, 958, 109, doi: 10.3847/1538-4357/acff6e 18
-
[29]
Li, S.-L., Grasha, K., Krumholz, M. R., et al. 2024, MNRAS, 529, 4993, doi: 10.1093/mnras/stae869
-
[30]
2022, ApJ, 927, 136, doi: 10.3847/1538-4357/ac50b6
Lokhorst, D., Abraham, R., Pasha, I., et al. 2022, ApJ, 927, 136, doi: 10.3847/1538-4357/ac50b6
-
[31]
Lopez, L. A., Mathur, S., Nguyen, D. D., Thompson, T. A., & Olivier, G. M. 2020, ApJ, 904, 152, doi: 10.3847/1538-4357/abc010
-
[32]
Bolatto, A. D. 2025, ApJ, 989, 100, doi: 10.3847/1538-4357/adec75
-
[33]
Lopez, S., Ring, C., Leroy, A. K., et al. 2026, ApJL, 999, L7, doi: 10.3847/2041-8213/ae4508
-
[34]
Lynds, C. R., & Sandage, A. R. 1963, ApJ, 137, 1005, doi: 10.1086/147579
-
[35]
Martini, P., Leroy, A. K., Mangum, J. G., et al. 2018, ApJ, 856, 61, doi: 10.3847/1538-4357/aab08e
-
[36]
Mutchler, M., Bond, H. E., Christian, C. A., et al. 2007, PASP, 119, 1, doi: 10.1086/511160
-
[37]
Nicholls, D. C., Sutherland, R. S., Dopita, M. A., Kewley, L. J., & Groves, B. A. 2017, MNRAS, 466, 4403, doi: 10.1093/mnras/stw3235
-
[38]
Ong, D. D. Y., D’Eugenio, F., Maiolino, R., et al. 2025, arXiv e-prints, arXiv:2512.10924, doi: 10.48550/arXiv.2512.10924
-
[39]
2015, ApJ, 805, 158, doi: 10.1088/0004-637X/805/2/158
Scannapieco, E., & Br¨ uggen, M. 2015, ApJ, 805, 158, doi: 10.1088/0004-637X/805/2/158
-
[40]
Schaye, J., Crain, R. A., Bower, R. G., et al. 2015, MNRAS, 446, 521, doi: 10.1093/mnras/stu2058
-
[41]
Thompson, T. A. 2020, ApJ, 895, 43, doi: 10.3847/1538-4357/ab8ae8
-
[42]
Schneider, E. E., & Robertson, B. E. 2017, ApJ, 834, 144, doi: 10.3847/1538-4357/834/2/144
-
[43]
Shopbell, P. L., & Bland-Hawthorn, J. 1998, ApJ, 493, 129, doi: 10.1086/305108
-
[44]
2020, MNRAS, 499, 4261, doi: 10.1093/mnras/staa3177
Sparre, M., Pfrommer, C., & Ehlert, K. 2020, MNRAS, 499, 4261, doi: 10.1093/mnras/staa3177
-
[45]
2019, MNRAS, 482, 5401, doi: 10.1093/mnras/sty3063
Sparre, M., Pfrommer, C., & Vogelsberger, M. 2019, MNRAS, 482, 5401, doi: 10.1093/mnras/sty3063
-
[46]
Strickland, D. K., & Heckman, T. M. 2007, ApJ, 658, 258, doi: 10.1086/511174
-
[47]
2018, MAPPINGS V: Astrophysical plasma modeling code,, Astrophysics Source Code Library, record ascl:1807.005 http://ascl.net/1807.005
Sutherland, R., Dopita, M., Binette, L., & Groves, B. 2018, MAPPINGS V: Astrophysical plasma modeling code,, Astrophysics Source Code Library, record ascl:1807.005 http://ascl.net/1807.005
2018
-
[48]
Sutherland, R. S., & Dopita, M. A. 2017, ApJS, 229, 34, doi: 10.3847/1538-4365/aa6541
-
[49]
Tan, B., & Fielding, D. B. 2024, MNRAS, 527, 9683, doi: 10.1093/mnras/stad3793
-
[50]
Taylor, C. L., Walter, F., & Yun, M. S. 2001, ApJL, 562, L43, doi: 10.1086/338048
-
[51]
Thompson, T. A., & Heckman, T. M. 2024, ARA&A, 62, 529, doi: 10.1146/annurev-astro-041224-011924
-
[52]
Veilleux, S., Maiolino, R., Bolatto, A. D., & Aalto, S. 2020, A&A Rv, 28, 2, doi: 10.1007/s00159-019-0121-9
-
[53]
2002, ApJL, 580, L21, doi: 10.1086/345287
Walter, F., Weiss, A., & Scoville, N. 2002, ApJL, 580, L21, doi: 10.1086/345287
-
[54]
2023, ApJ, 956, 142, doi: 10.3847/1538-4357/acfa71
Xu, X., Heckman, T., Yoshida, M., Henry, A., & Ohyama, Y. 2023, ApJ, 956, 142, doi: 10.3847/1538-4357/acfa71
-
[55]
2019, PASJ, 71, 87, doi: 10.1093/pasj/psz069
Hattori, T. 2019, PASJ, 71, 87, doi: 10.1093/pasj/psz069
discussion (0)
Sign in with ORCID, Apple, or X to comment. Anyone can read and Pith papers without signing in.