DESI as sparse Integral Field Spectrograph I: Spatially resolved chemical enrichment in star-forming galaxies at zleq0.1
Pith reviewed 2026-06-27 08:58 UTC · model grok-4.3
The pith
Massive galaxies show steeper inner metallicity gradients than dwarfs, with flat outer profiles consistent across masses at 5 Re.
A machine-rendered reading of the paper's core claim, the machinery that carries it, and where it could break.
Core claim
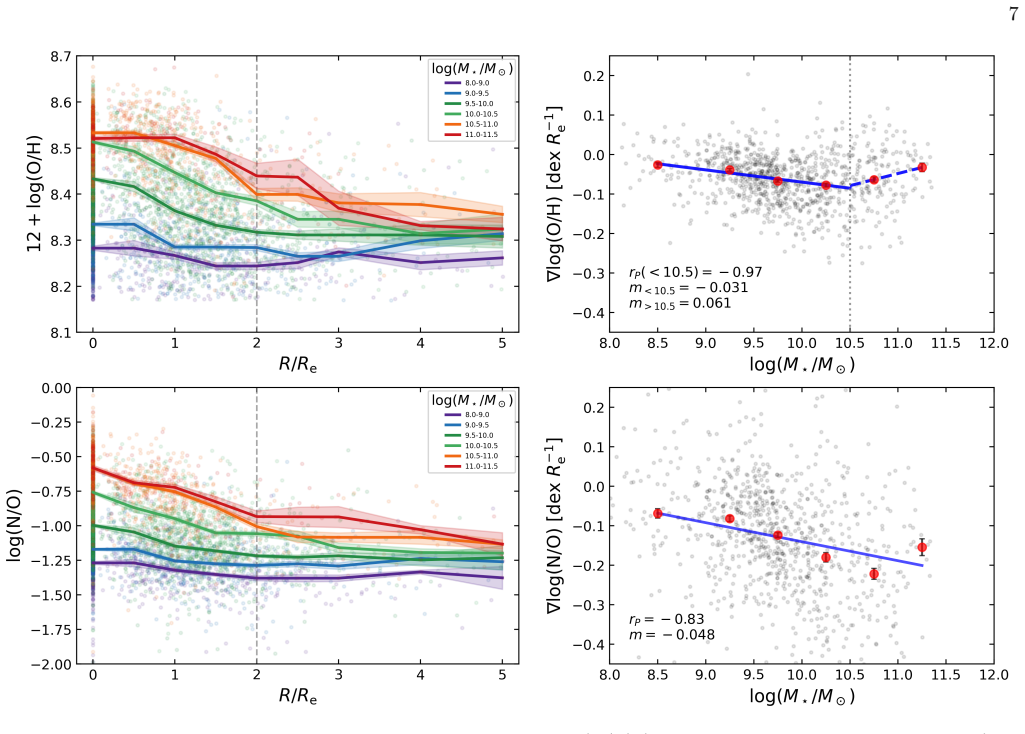
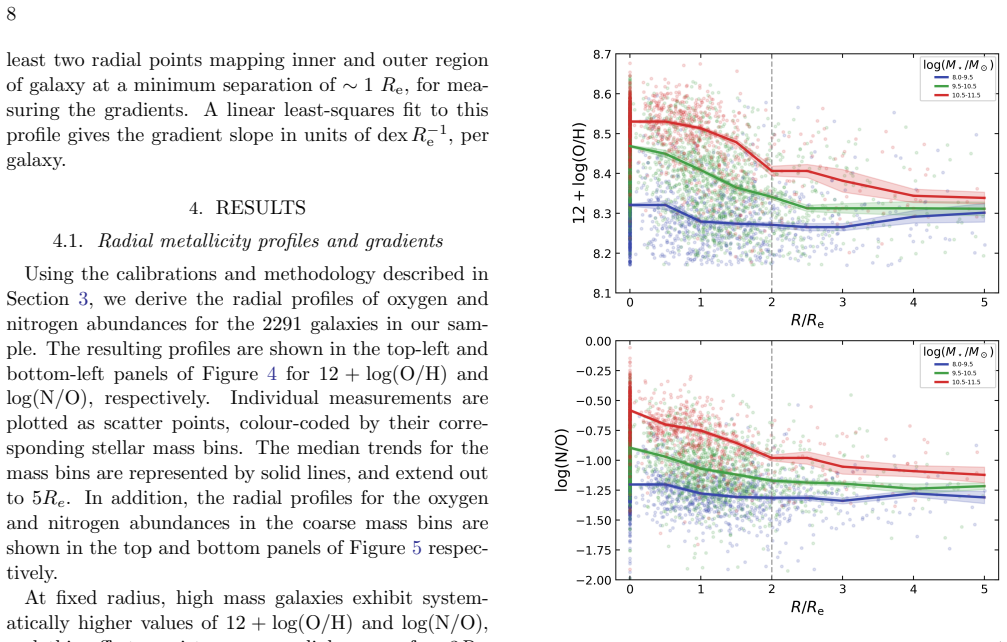
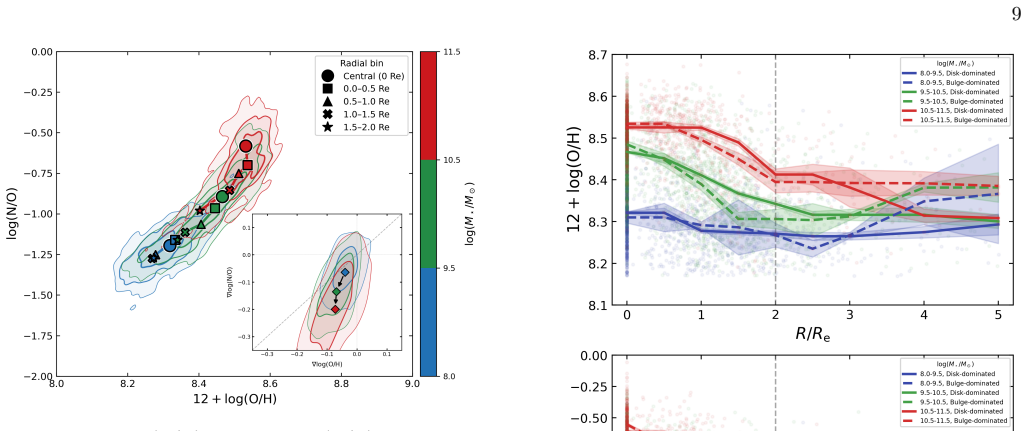
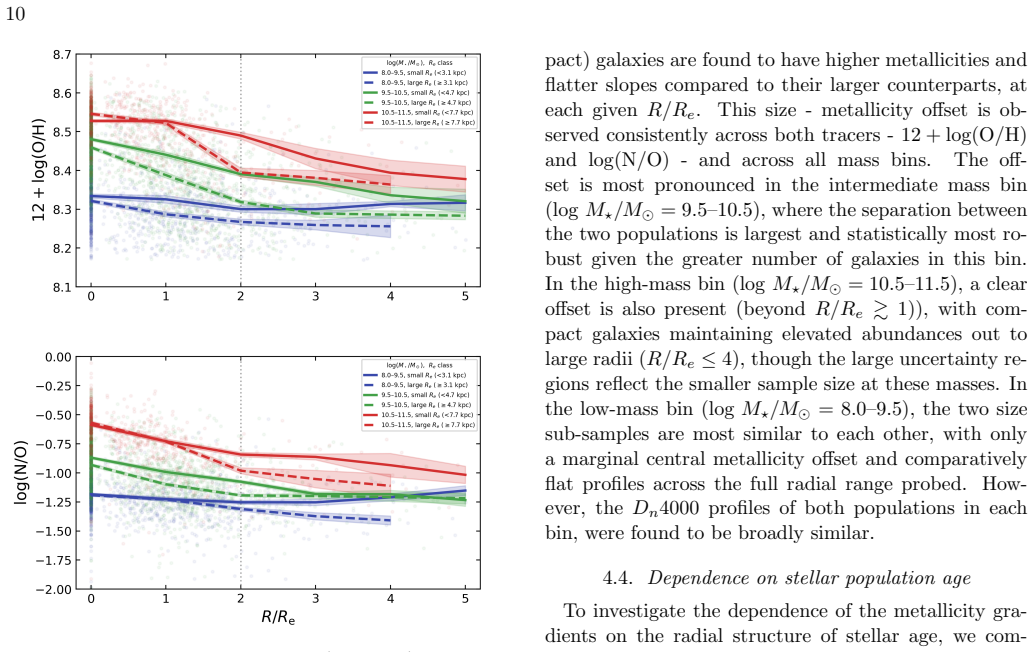
Radial gas-phase metallicity profiles decline outward in the inner disks of massive galaxies but stay flat in dwarfs; beyond 2 Re the profiles become uniformly flat out to 5 Re across the full mass range, with a turnover in the gradient-mass relation near 10^10.5 solar masses and a size dependence at fixed mass where compact galaxies are more centrally enriched.
What carries the argument
Radial gas-phase metallicity profiles (O/H gradients) extracted by treating DESI multi-fiber spectra as sparse integral-field observations, which map chemical enrichment from the inner disk to the disk-halo interface.
If this is right
- The gradient-stellar mass relation turns over and flattens above log(M*/M⊙) ≈ 10.5, consistent with chemical equilibrium in massive inner disks.
- At fixed stellar mass, compact galaxies exhibit flatter gradients and higher central metallicities than extended ones.
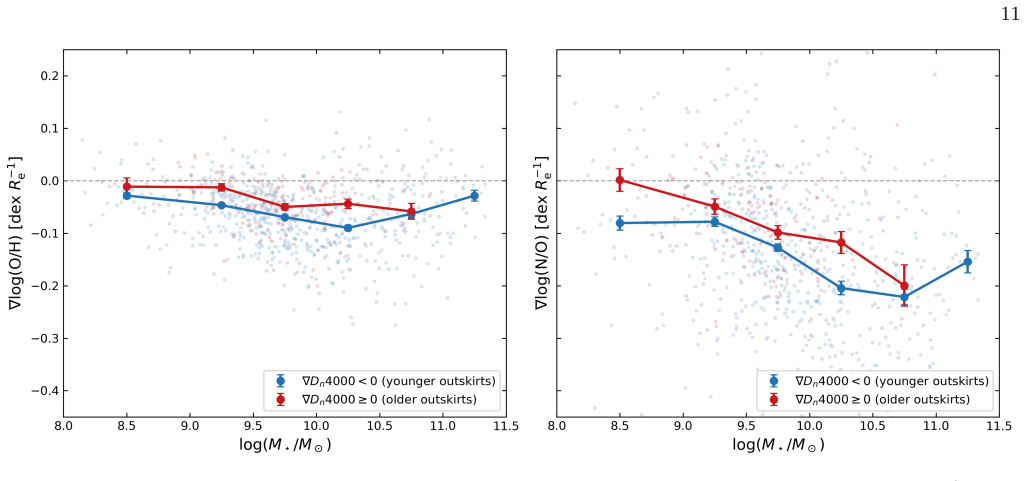
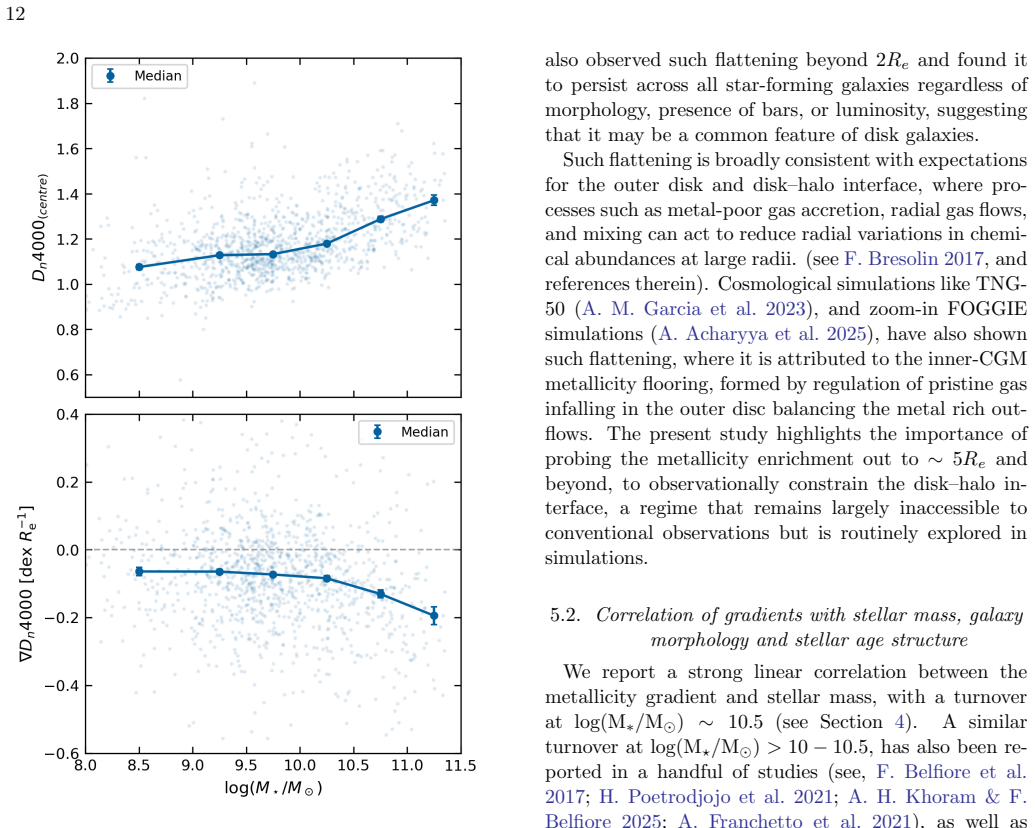
- Galaxies with younger stellar outskirts display steeper gradients than those with older outskirts, supporting ongoing inside-out disk growth.
- Flat outer metallicities at ~5 Re reflect low star-formation rates and dilution by metal-poor inflows near the disk-halo interface.
Where Pith is reading between the lines
- These mass-dependent inner gradients could be used to calibrate sub-grid feedback prescriptions in cosmological simulations that currently struggle to reproduce the observed turnover at 10^10.5 solar masses.
- The uniform outer flatness suggests that accretion of pristine gas operates similarly across galaxy masses once the disk-halo interface is reached, a prediction that could be tested with deeper HI and UV observations.
- If the size dependence holds, compact galaxies at high redshift should show even flatter gradients once their inner regions are resolved.
Load-bearing premise
Multi-fiber spectra can be interpreted as sparse integral-field data to derive accurate radial metallicity profiles without dominant biases from fiber placement or incomplete spatial sampling.
What would settle it
A direct comparison of DESI-derived gradients for the same galaxies against full integral-field spectroscopy from instruments like MaNGA or MUSE that shows systematic offsets larger than 0.02 dex per Re.
Figures
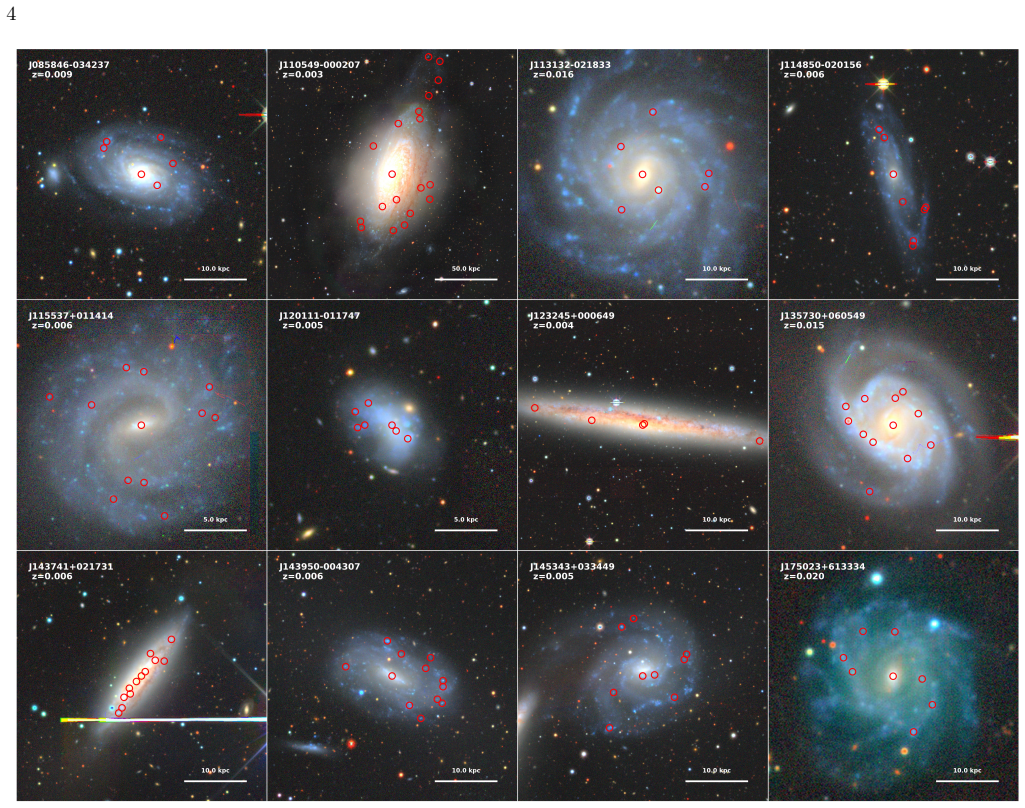
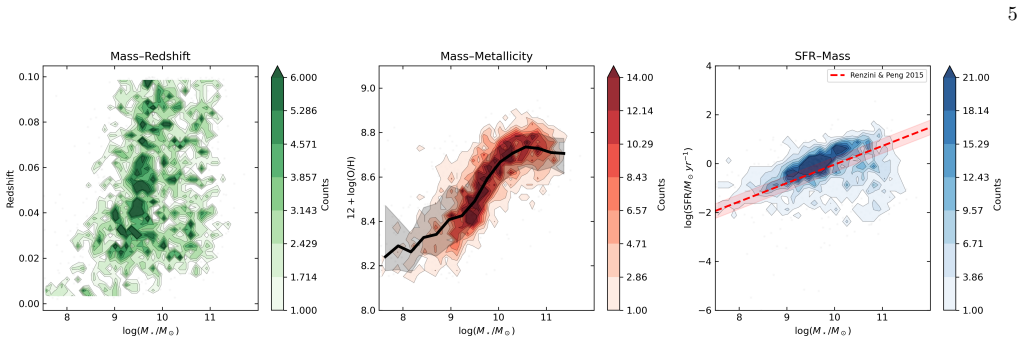
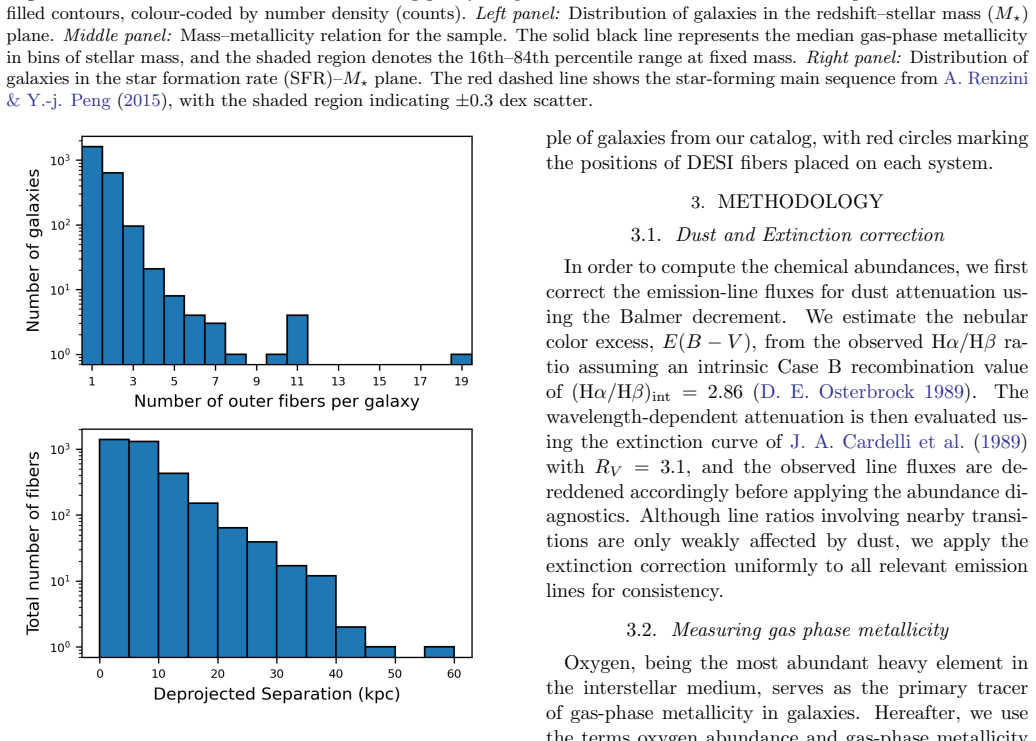
read the original abstract
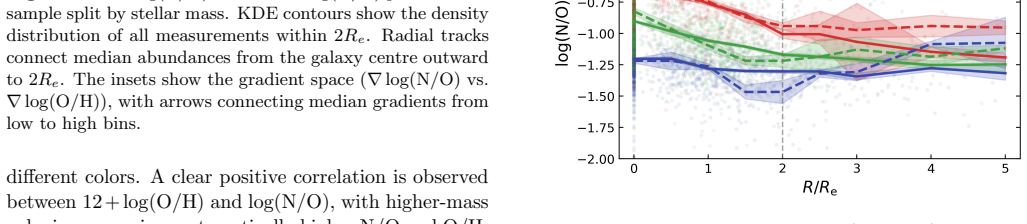
We present a spatially resolved chemical abundance analysis of 2291 star-forming galaxies at $z \leq 0.1$, spanning nearly four orders of magnitude in stellar mass ($8 \le \rm log (M_{\star}/M_{\odot}) \le 11.5$), by exploiting the multi-fibre spectra from the Dark Energy Spectroscopic Instrument (DESI) as a sparse integral field spectrograph. In the inner regions ($<2R_e$), the radial gas-phase metallicity profiles show an outward-declining trend for massive galaxies, with the steepest gradient ($\nabla_{log(O/H)}$) $\sim-0.08$ dex/R$_{e}$, whereas low-mass dwarf galaxies exhibit nearly flat profiles ($\nabla_{log(O/H)}\sim-0.02$ dex/R$_{e}$). The large galactocentric radii ($\sim$5 R$_{e}$) probed in this study, reveal flat metallicity profiles near the disk-halo interface. Strikingly, these flat metallicity values are consistent across a wide stellar mass range, likely reflecting the influence of low SFR and metal poor inflows in the outer regions. The metallicity gradient - stellar mass relation exhibits a turnover at $\log(M_\star/M_\odot) \sim 10.5$, beyond which gradients become shallower, possibly driven by the chemical equilibrium in the inner disk of massive galaxies and/or dilution from cosmic gas accretion. At fixed stellar mass, a strong size dependence is observed, where compact galaxies show flatter gradients and higher central enrichment than their extended counterparts. The abundance gradients are further linked with the stellar age distribution within the galactic disk, where galaxies with younger outskirts show steeper gradients than the ones with older outskirts, consistent with ongoing inside-out disc growth sustaining centrally concentrated chemical enrichment. These results underscore the interplay of star formation efficiency, stellar feedback, and metal-poor gas accretion in governing the radial chemical structure in galaxies.
Editorial analysis
A structured set of objections, weighed in public.
Referee Report
Summary. The paper analyzes radial gas-phase metallicity profiles in 2291 star-forming galaxies at z≤0.1 (8≤log(M*/M⊙)≤11.5) by treating DESI multi-fiber spectra as sparse integral-field data. It reports mass-dependent inner gradients (<2Re) with steepest slopes ∼−0.08 dex/Re in massive systems and nearly flat profiles (∼−0.02 dex/Re) in dwarfs, flat outer profiles to ∼5Re across masses, a turnover in the gradient-mass relation at log(M*/M⊙)∼10.5, size dependence at fixed mass, and links to stellar age distributions supporting inside-out growth.
Significance. If the sparse-fiber methodology is shown to be robust, the work supplies a large-sample extension of metallicity-gradient studies to large radii and low masses, offering observational constraints on the roles of star-formation efficiency, feedback, and metal-poor inflows near the disk-halo interface.
major comments (2)
- [Abstract] Abstract: the reported gradient values (e.g., ∇log(O/H)∼−0.08 dex/Re and ∼−0.02 dex/Re) and the claimed flat outer profiles are presented without any quantitative description of fiber-to-radius mapping, error propagation, dust corrections, or selection-bias tests on the 2291-galaxy sample; these omissions are load-bearing for the mass-dependent trends and the turnover at log(M*)∼10.5.
- [Abstract] Method description (as summarized in abstract): no validation is supplied (mocks, cross-survey comparisons, or fiber-success-rate tests) demonstrating that survey-driven fiber placement yields unbiased radial sampling; non-uniform coverage or mass-dependent aperture effects would directly alter the recovered inner slopes and the claimed mass-independent flat outer values.
Simulated Author's Rebuttal
We thank the referee for their careful and constructive review. The comments highlight the need for greater clarity in the abstract regarding methodological details and validation. We address each point below and will revise the manuscript to incorporate additional quantitative information and explicit references to existing validation tests.
read point-by-point responses
-
Referee: [Abstract] Abstract: the reported gradient values (e.g., ∇log(O/H)∼−0.08 dex/Re and ∼−0.02 dex/Re) and the claimed flat outer profiles are presented without any quantitative description of fiber-to-radius mapping, error propagation, dust corrections, or selection-bias tests on the 2291-galaxy sample; these omissions are load-bearing for the mass-dependent trends and the turnover at log(M*)∼10.5.
Authors: We agree the abstract's brevity omits key details. Section 3.1 quantifies fiber-to-radius mapping via projected fiber positions relative to Re (with median coverage to 5 Re). Error propagation uses Monte Carlo resampling of line fluxes and is detailed in Section 4.2. Dust corrections via Balmer decrement are described in Section 2.4. Selection-bias tests, including mass-dependent fiber success and aperture effects, appear in Section 5.3 and Appendix B, confirming the turnover at log(M*)∼10.5 remains significant. We will revise the abstract to include brief quantitative statements on these elements. revision: yes
-
Referee: [Abstract] Method description (as summarized in abstract): no validation is supplied (mocks, cross-survey comparisons, or fiber-success-rate tests) demonstrating that survey-driven fiber placement yields unbiased radial sampling; non-uniform coverage or mass-dependent aperture effects would directly alter the recovered inner slopes and the claimed mass-independent flat outer values.
Authors: Validation is provided in the full text but not summarized in the abstract. Section 6.1 presents direct comparison with MaNGA gradients for overlapping galaxies, showing consistency within uncertainties. Fiber placement and success-rate tests (including mass dependence) are in Section 3.3. Mock simulations of sparse sampling (Appendix C) recover input gradients with <0.01 dex/Re bias across the mass range, supporting the flat outer profiles. We will add a concise statement on these validations to the abstract and ensure the main text explicitly references them for the inner-slope and outer-flat results. revision: yes
Circularity Check
No circularity: purely observational reporting of measured gradients
full rationale
The paper reports direct measurements of radial gas-phase metallicity profiles and gradients from DESI multi-fiber spectra treated as sparse IFS data. No equations, model fits, predictions, or self-citations are present that reduce any claimed result to its inputs by construction. The central results (mass-dependent gradients, flat outer profiles) are empirical findings from the observations, with no load-bearing derivations or ansatzes that could introduce circularity. This is the expected outcome for a data-driven observational study.
Axiom & Free-Parameter Ledger
Reference graph
Works this paper leans on
-
[1]
Acharyya, A., Peeples, M. S., Tumlinson, J., et al. 2025, ApJ, 979, 129, doi: 10.3847/1538-4357/ad9dd8
-
[2]
1979, A&A, 78, 200
Alloin, D., Collin-Souffrin, S., Joly, M., & Vigroux, L. 1979, A&A, 78, 200
1979
-
[3]
2024, AJ, 168, 124, doi: 10.3847/1538-3881/ad60c2
Anand, A., Guy, J., Bailey, S., et al. 2024, AJ, 168, 124, doi: 10.3847/1538-3881/ad60c2
-
[4]
Ground-based and Airborne Instrumentation for Astronomy III , year = 2010, editor =
Bacon, R., Accardo, M., Adjali, L., et al. 2010, in Society of Photo-Optical Instrumentation Engineers (SPIE) Conference Series, Vol. 7735, Ground-based and Airborne Instrumentation for Astronomy III, ed. I. S. McLean, S. K. Ramsay, & H. Takami, 773508, doi: 10.1117/12.856027
-
[5]
K., Heckman, T
Barrera-Ballesteros, J. K., Heckman, T. M., Zhu, G. B., et al. 2016, Monthly Notices of the Royal Astronomical Society, 463, 2513
2016
-
[6]
2017, MNRAS, 469, 151, doi: 10.1093/mnras/stx789
Belfiore, F., Maiolino, R., Tremonti, C., et al. 2017, MNRAS, 469, 151, doi: 10.1093/mnras/stx789
-
[7]
Boardman, N. F., Zasowski, G., Newman, J. A., et al. 2021, MNRAS, 501, 948, doi: 10.1093/mnras/staa3785
-
[8]
Boissier, S., & Prantzos, N. 1999, MNRAS, 307, 857, doi: 10.1046/j.1365-8711.1999.02699.x
-
[9]
CIGALE: a python Code Investigating GALaxy Emission
Boquien, M., Burgarella, D., Roehlly, Y., et al. 2019, A&A, 622, A103, doi: 10.1051/0004-6361/201834156
work page internal anchor Pith review doi:10.1051/0004-6361/201834156 2019
-
[10]
S., Maiolino, R., Kennicutt, R., et al
Bothwell, M. S., Maiolino, R., Kennicutt, R., et al. 2013, MNRAS, 433, 1425, doi: 10.1093/mnras/stt817
-
[11]
2017, in Astrophysics and Space Science
Bresolin, F. 2017, in Astrophysics and Space Science
2017
-
[12]
Knapen, J. C. Lee, & A. Gil de Paz, 145, doi: 10.1007/978-3-319-56570-5 5
-
[13]
2009, ApJ, 700, 309, doi: 10.1088/0004-637X/700/1/309
Bresolin, F., Gieren, W., Kudritzki, R.-P., et al. 2009, ApJ, 700, 309, doi: 10.1088/0004-637X/700/1/309
-
[14]
, archivePrefix = "arXiv", eprint =
Bryant, J. J., Owers, M. S., Robotham, A. S. G., et al. 2015, MNRAS, 447, 2857, doi: 10.1093/mnras/stu2635
-
[15]
, archivePrefix = "arXiv", eprint =
Bundy, K., Bershady, M. A., Law, D. R., et al. 2015, ApJ, 798, 7, doi: 10.1088/0004-637X/798/1/7
work page internal anchor Pith review doi:10.1088/0004-637x/798/1/7 2015
-
[16]
Cardelli, J. A., Clayton, G. C., & Mathis, J. S. 1989, ApJ, 345, 245, doi: 10.1086/167900
-
[17]
Curti, M., Maiolino, R., Curtis-Lake, E., et al. 2024, A&A, 684, A75, doi: 10.1051/0004-6361/202346698 Dav´ e, R., Finlator, K., & Oppenheimer, B. D. 2011, MNRAS, 416, 1354, doi: 10.1111/j.1365-2966.2011.19132.x Denicol´ o, G., Terlevich, R., & Terlevich, E. 2002, MNRAS, 330, 69, doi: 10.1046/j.1365-8711.2002.05041.x DESI Collaboration, Abareshi, B., Agui...
-
[18]
and Lang, Dustin and Blum, Robert and Burleigh, Kaylan and Fan, Xiaohui and Findlay, Joseph R
Dey, A., Schlegel, D. J., Lang, D., et al. 2019, AJ, 157, 168, doi: 10.3847/1538-3881/ab089d
-
[19]
Dopita, M. A., Kewley, L. J., Sutherland, R. S., & Nicholls, D. C. 2016, Ap&SS, 361, 61, doi: 10.1007/s10509-016-2657-8
-
[20]
Dopita, M. A., Sutherland, R. S., Nicholls, D. C., Kewley, L. J., & Vogt, F. P. A. 2013, ApJS, 208, 10, doi: 10.1088/0067-0049/208/1/10
-
[21]
A., Fischera, J., Sutherland, R
Dopita, M. A., Fischera, J., Sutherland, R. S., et al. 2006, ApJS, 167, 177, doi: 10.1086/508261
-
[22]
Edmunds, M. G. 1990, MNRAS, 246, 678
1990
-
[23]
Ellison, S. L., Patton, D. R., Simard, L., & McConnachie, A. W. 2008, ApJL, 672, L107, doi: 10.1086/527296
-
[24]
Erb, D. K., Shapley, A. E., Pettini, M., et al. 2006, ApJ, 644, 813, doi: 10.1086/503623
-
[25]
Finlator, K., & Dav´ e, R. 2008, MNRAS, 385, 2181, doi: 10.1111/j.1365-2966.2008.12991.x
-
[26]
Franchetto, A., Mingozzi, M., Poggianti, B. M., et al. 2021, ApJ, 923, 28, doi: 10.3847/1538-4357/ac2510
-
[27]
Garcia, A. M., Torrey, P., Hemler, Z. S., et al. 2023, MNRAS, 519, 4716, doi: 10.1093/mnras/stac3749
-
[28]
Graham, A. W., & Driver, S. P. 2005, PASA, 22, 118, doi: 10.1071/AS05001
-
[29]
Heintz, K. E., Brammer, G. B., Gim´ enez-Arteaga, C., et al. 2023, Nature Astronomy, 7, 1517, doi: 10.1038/s41550-023-02078-7
-
[30]
Henry, R. B. C., Edmunds, M. G., & K¨ oppen, J. 2000, ApJ, 541, 660, doi: 10.1086/309471
-
[31]
Ho, I.-T., Kudritzki, R.-P., Kewley, L. J., et al. 2015, MNRAS, 448, 2030, doi: 10.1093/mnras/stv067
-
[32]
Hubble, E. P. 1926, ApJ, 64, 321, doi: 10.1086/143018
-
[33]
2025, MNRAS, 544, 815, doi: 10.1093/mnras/staf1727
Ibrahim, D., & Kobayashi, C. 2025, MNRAS, 544, 815, doi: 10.1093/mnras/staf1727
-
[34]
Thuan, T. X. 2006, A&A, 448, 955, doi: 10.1051/0004-6361:20053763
-
[35]
Kauffmann, G., Heckman, T. M., Tremonti, C., et al. 2003, MNRAS, 346, 1055, doi: 10.1111/j.1365-2966.2003.07154.x
-
[36]
Kewley, L. J., & Dopita, M. A. 2002, ApJS, 142, 35, doi: 10.1086/341326
-
[37]
Theoretical Modeling of Starburst Galaxies
Kewley, L. J., Dopita, M. A., Sutherland, R. S., Heisler, C. A., & Trevena, J. 2001, ApJ, 556, 121, doi: 10.1086/321545
work page internal anchor Pith review doi:10.1086/321545 2001
-
[38]
Kewley, L. J., & Ellison, S. L. 2008, ApJ, 681, 1183, doi: 10.1086/587500
-
[39]
Khoram, A. H., & Belfiore, F. 2025, A&A, 693, A150, doi: 10.1051/0004-6361/202451980 16
-
[40]
W., & Mykytyn, D
Lang, D., Hogg, D. W., & Mykytyn, D. 2016, The Tractor: Probabilistic astronomical source detection and measurement,, Astrophysics Source Code Library, record ascl:1604.008 http://ascl.net/1604.008 Lara-L´ opez, M., Cepa, J., Bongiovanni, A., et al. 2010, Astronomy & Astrophysics, 521, L53
2016
-
[41]
Lilly, S. J., Carollo, C. M., Pipino, A., Renzini, A., & Peng, Y. 2013, ApJ, 772, 119, doi: 10.1088/0004-637X/772/2/119
-
[42]
Lin, L., Shen, S., Yesuf, H. M., Mao, Y.-W., & Hao, L. 2024, ApJ, 977, 175, doi: 10.3847/1538-4357/ad8a61 L´ opez-S´ anchez,´A. R., Westmeier, T., & Esteban, C. 2015, MNRAS, 450, 3381
-
[43]
Ma, X., Hopkins, P. F., Feldmann, R., et al. 2017, MNRAS, 466, 4780, doi: 10.1093/mnras/stx034
-
[44]
Maiolino, R. 2011, in IAU Symposium, Vol. 277, Tracing the Ancestry of Galaxies, ed. C. Carignan, F. Combes, & K. C. Freeman, 170–173, doi: 10.1017/S1743921311022708
-
[45]
2019, A&A Rv, 27, 3, doi: 10.1007/s00159-018-0112-2
Maiolino, R., & Mannucci, F. 2019, A&A Rv, 27, 3, doi: 10.1007/s00159-018-0112-2
-
[46]
Gnerucci, A. 2010, MNRAS, 408, 2115, doi: 10.1111/j.1365-2966.2010.17291.x
-
[47]
A., Gil de Paz, A., Castillo-Morales, A., et al
Marino, R. A., Gil de Paz, A., Castillo-Morales, A., et al. 2012, ApJ, 754, 61, doi: 10.1088/0004-637X/754/1/61
-
[48]
Marino, R. A., Rosales-Ortega, F. F., S´ anchez, S. F., et al. 2013, A&A, 559, A114, doi: 10.1051/0004-6361/201321956
-
[49]
1992, ApJ, 397, 463, doi: 10.1086/171803
Martin, P., & Roy, J.-R. 1992, ApJ, 397, 463, doi: 10.1086/171803
-
[50]
McGaugh, S. S. 1991, ApJ, 380, 140, doi: 10.1086/170569
-
[51]
N., Doel, P., Gutierrez, G., et al
Miller, T. N., Doel, P., Gutierrez, G., et al. 2024, AJ, 168, 95, doi: 10.3847/1538-3881/ad45fe
-
[52]
2020, A&A, 636, A42, doi: 10.1051/0004-6361/201937203 Moll´ a, M., V´ ılchez, J
Mingozzi, M., Belfiore, F., Cresci, G., et al. 2020, A&A, 636, A42, doi: 10.1051/0004-6361/201937203 Moll´ a, M., V´ ılchez, J. M., Gavil´ an, M., & D´ ıaz, A. I. 2006, MNRAS, 372, 1069, doi: 10.1111/j.1365-2966.2006.10892.x
-
[53]
2023, FastSpecFit: Fast spectral synthesis and emission-line fitting of DESI spectra,, Astrophysics Source Code Library, record ascl:2308.005 http://ascl.net/2308.005
Khederlarian, A. 2023, FastSpecFit: Fast spectral synthesis and emission-line fitting of DESI spectra,, Astrophysics Source Code Library, record ascl:2308.005 http://ascl.net/2308.005
2023
-
[54]
Moustakas, J., Kennicutt, Jr., R. C., Tremonti, C. A., et al. 2010, ApJS, 190, 233, doi: 10.1088/0067-0049/190/2/233
-
[55]
2023, ApJS, 269, 33, doi: 10.3847/1538-4365/acd556
Nakajima, K., Ouchi, M., Isobe, Y., et al. 2023, ApJS, 269, 33, doi: 10.3847/1538-4365/acd556
-
[56]
Osterbrock, D. E. 1989, S&T, 78, 491
1989
-
[57]
Pagel, B. E. J., Edmunds, M. G., Blackwell, D. E., Chun, M. S., & Smith, G. 1979, MNRAS, 189, 95, doi: 10.1093/mnras/189.1.95
-
[58]
Edmunds, M. G. 1992, MNRAS, 255, 325, doi: 10.1093/mnras/255.2.325
-
[59]
Peimbert, M., & Costero, R. 1969, Boletin de los Observatorios Tonantzintla y Tacubaya, 5, 3 P´ erez-Montero, E., Garc´ ıa-Benito, R., V´ ılchez, J. M., et al. 2016, A&A, 595, A62, doi: 10.1051/0004-6361/201628601
-
[60]
2023, A&A, 673, A147, doi: 10.1051/0004-6361/202245673
Pessa, I., Schinnerer, E., Sanchez-Blazquez, P., et al. 2023, A&A, 673, A147, doi: 10.1051/0004-6361/202245673
-
[61]
Pettini, M., & Pagel, B. E. J. 2004, MNRAS, 348, L59, doi: 10.1111/j.1365-2966.2004.07591.x
-
[62]
Pilkington, K., Few, C. G., Gibson, B. K., et al. 2012, A&A, 540, A56, doi: 10.1051/0004-6361/201117466
-
[63]
Pilyugin, L. S. 2000, A&A, 362, 325, doi: 10.48550/arXiv.astro-ph/0004032
work page internal anchor Pith review Pith/arXiv arXiv doi:10.48550/arxiv.astro-ph/0004032 2000
-
[64]
Pilyugin, L. S., & Thuan, T. X. 2005, ApJ, 631, 231, doi: 10.1086/432408
-
[65]
Pilyugin, L. S., V´ ılchez, J. M., & Thuan, T. X. 2010, ApJ, 720, 1738, doi: 10.1088/0004-637X/720/2/1738
-
[66]
Poetrodjojo, H., Groves, B., Kewley, L. J., et al. 2018, MNRAS, 479, 5235, doi: 10.1093/mnras/sty1782
-
[67]
Poetrodjojo, H., Groves, B., Kewley, L. J., et al. 2021, MNRAS, 502, 3357, doi: 10.1093/mnras/stab205
-
[69]
Prantzos, N., & Boissier, S. 2000b, MNRAS, 313, 338, doi: 10.1046/j.1365-8711.2000.03228.x
-
[70]
Pucha, R., Juneau, S., Dey, A., et al. 2025, ApJ, 982, 10, doi: 10.3847/1538-4357/adb1dd
-
[71]
AN OBJECTIVE DEFINITION FOR THE MAIN SEQUENCE OF STAR-FORMING GALAXIES , volume=
Renzini, A., & Peng, Y.-j. 2015, ApJL, 801, L29, doi: 10.1088/2041-8205/801/2/L29
-
[72]
, archivePrefix = "arXiv", eprint =
Rosales-Ortega, F. F., D´ ıaz, A. I., Kennicutt, R. C., & S´ anchez, S. F. 2011, MNRAS, 415, 2439, doi: 10.1111/j.1365-2966.2011.18870.x
-
[73]
Rosales-Ortega, F. F., Kennicutt, R. C., S´ anchez, S. F., et al. 2010, MNRAS, 405, 735, doi: 10.1111/j.1365-2966.2010.16498.x
-
[74]
Roy, J.-R., & Walsh, J. R. 1997, MNRAS, 288, 715, doi: 10.1093/mnras/288.3.715
-
[75]
Rupke, D. S. N., Kewley, L. J., & Chien, L.-H. 2010, ApJ, 723, 1255, doi: 10.1088/0004-637X/723/2/1255 S´ anchez, S. F. 2020, ARA&A, 58, 99, doi: 10.1146/annurev-astro-012120-013326 S´ anchez, S. F., Kennicutt, R. C., Gil de Paz, A., et al. 2012a, A&A, 538, A8, doi: 10.1051/0004-6361/201117353 S´ anchez, S. F., Rosales-Ortega, F. F., Marino, R. A., et al....
-
[77]
L., Tremonti, C., Belfiore, F., et al
Schaefer, A. L., Tremonti, C., Belfiore, F., et al. 2020b, ApJL, 890, L3, doi: 10.3847/2041-8213/ab6f06
-
[78]
1971, ApJ, 168, 327, doi: 10.1086/151090
Searle, L. 1971, ApJ, 168, 327, doi: 10.1086/151090
-
[79]
Sharda, P., Krumholz, M. R., Wisnioski, E., et al. 2021a, MNRAS, 504, 53, doi: 10.1093/mnras/stab868
-
[80]
Sharda, P., Krumholz, M. R., Wisnioski, E., et al. 2021b, MNRAS, 502, 5935, doi: 10.1093/mnras/stab252
-
[81]
Shen, S., Mo, H. J., White, S. D. M., et al. 2003, MNRAS, 343, 978, doi: 10.1046/j.1365-8711.2003.06740.x
-
[82]
H., Fagrelius, P., Fanning, K., et al
Silber, J. H., Fagrelius, P., Fanning, K., et al. 2023, AJ, 165, 9, doi: 10.3847/1538-3881/ac9ab1
discussion (0)
Sign in with ORCID, Apple, or X to comment. Anyone can read and Pith papers without signing in.