Learning Sparse Latent Predictive Foundation Model for Multimodal Neuroimaging
Pith reviewed 2026-06-27 04:34 UTC · model grok-4.3
The pith
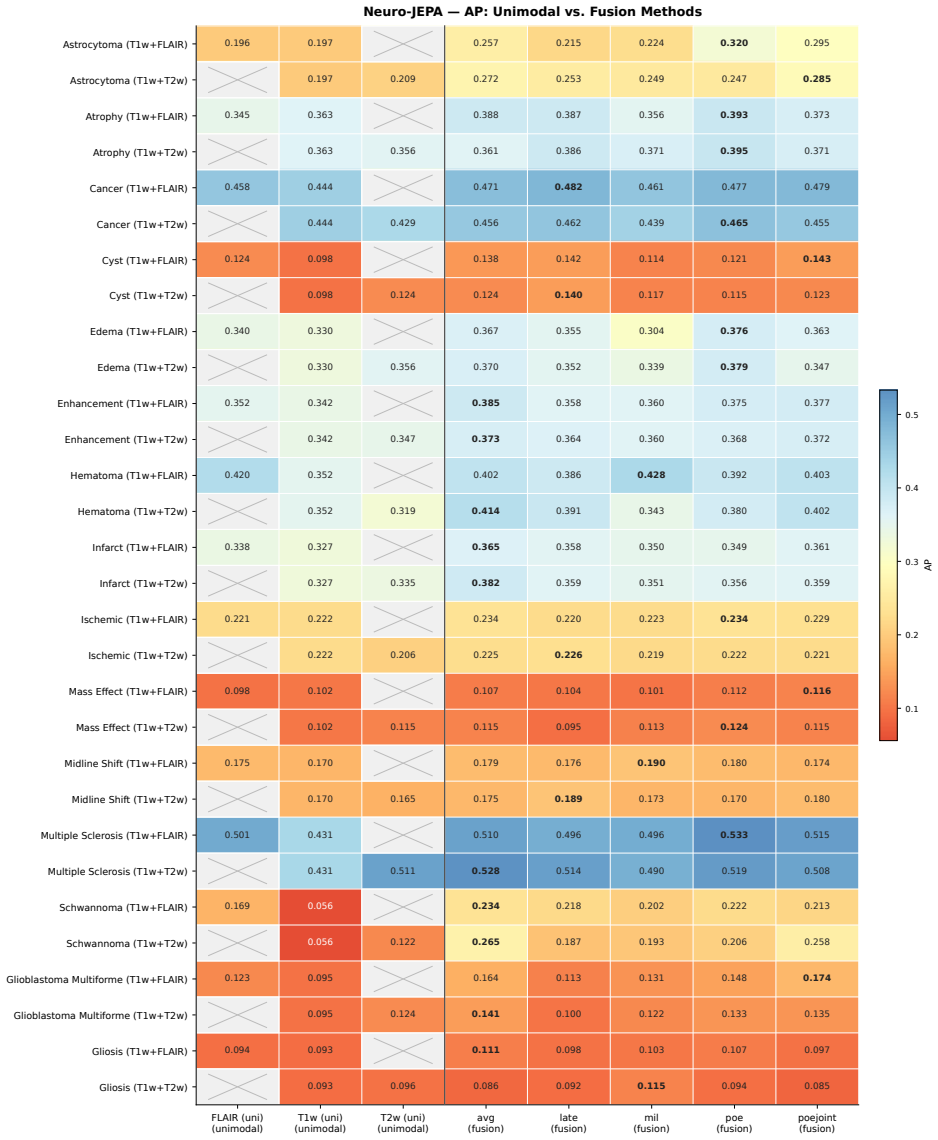
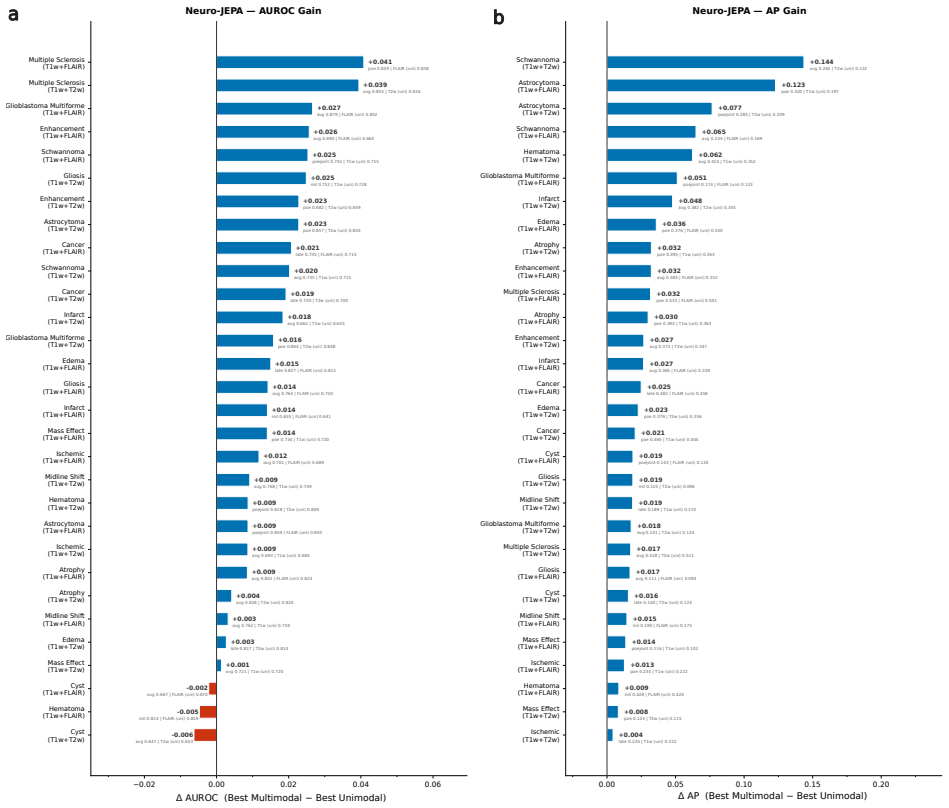
Neuro-JEPA uses a latent predictive objective and Mixture-of-Experts to learn unified representations from T1w, T2w, and FLAIR brain MRIs, delivering consistent gains over prior foundation models and a simple CNN across 47 tasks.
A machine-rendered reading of the paper's core claim, the machinery that carries it, and where it could break.
Core claim
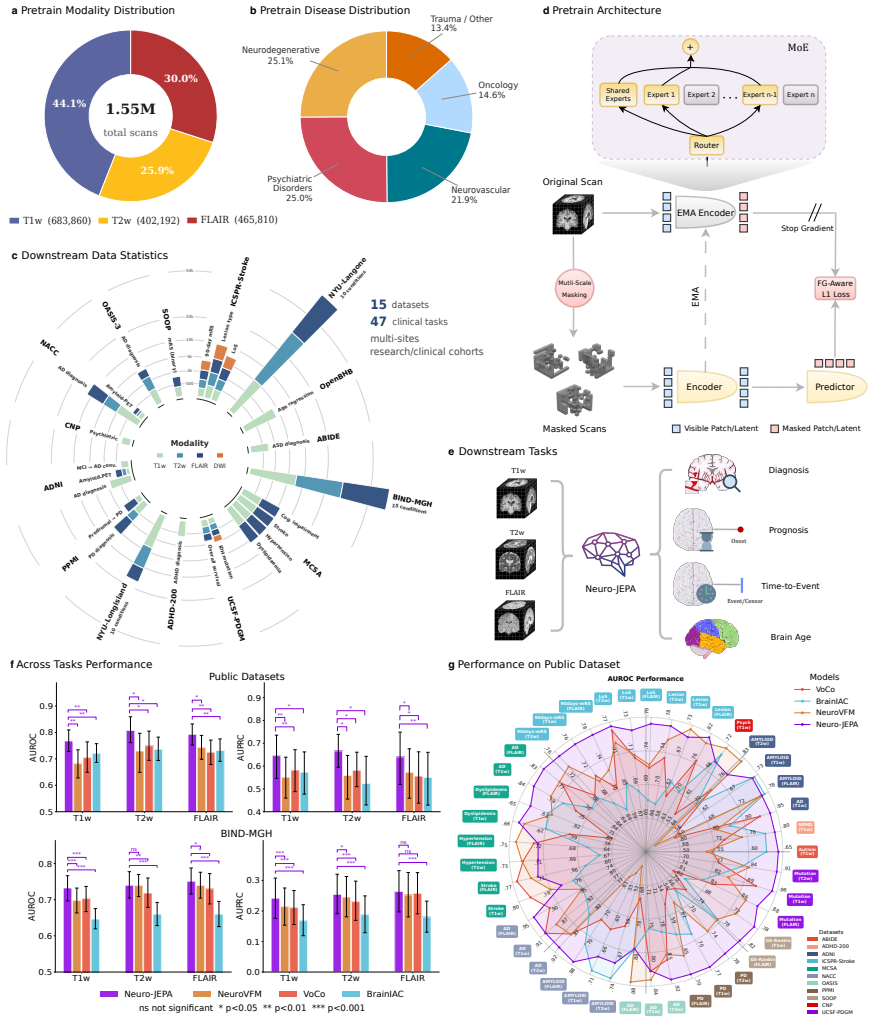
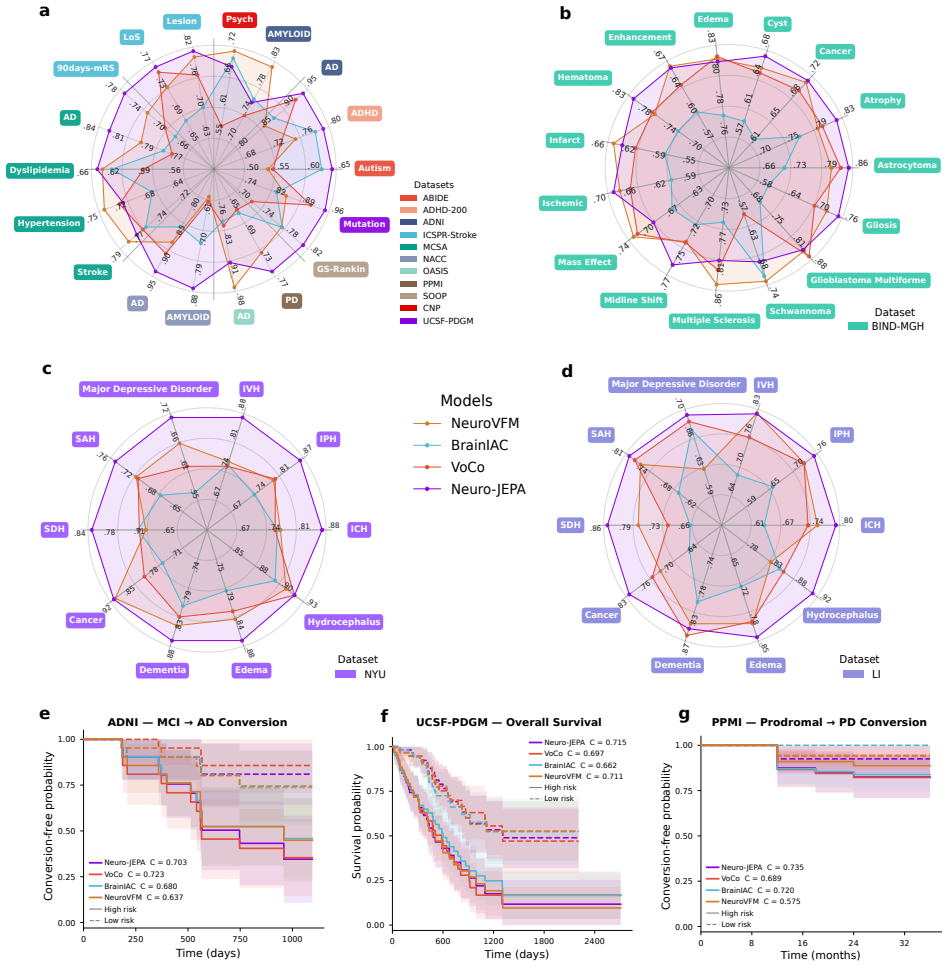
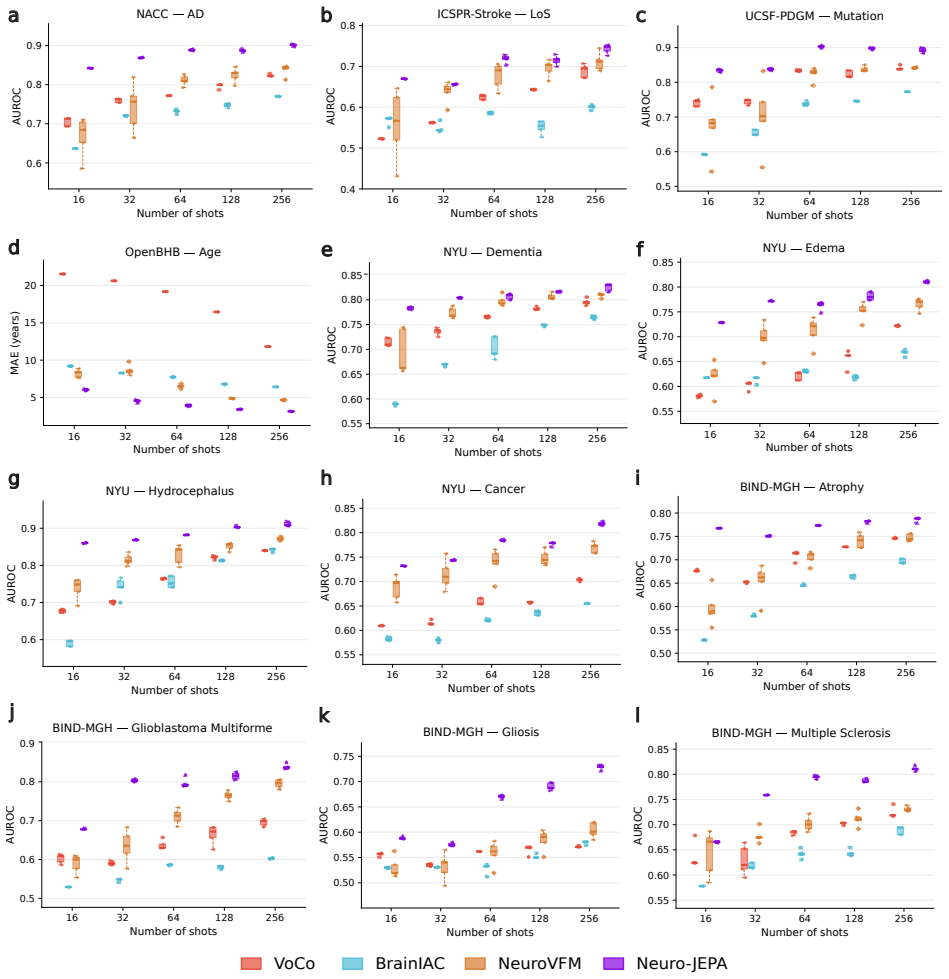
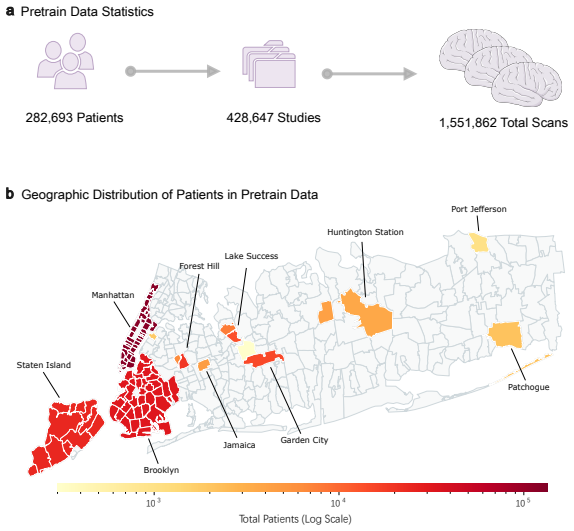
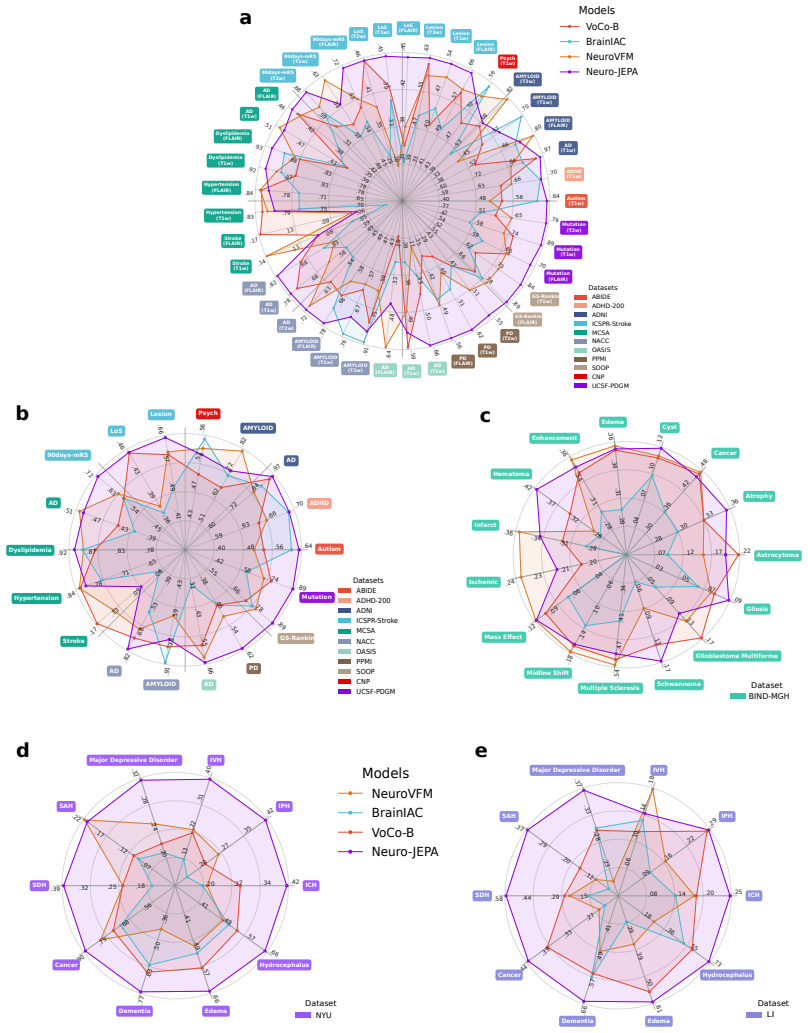
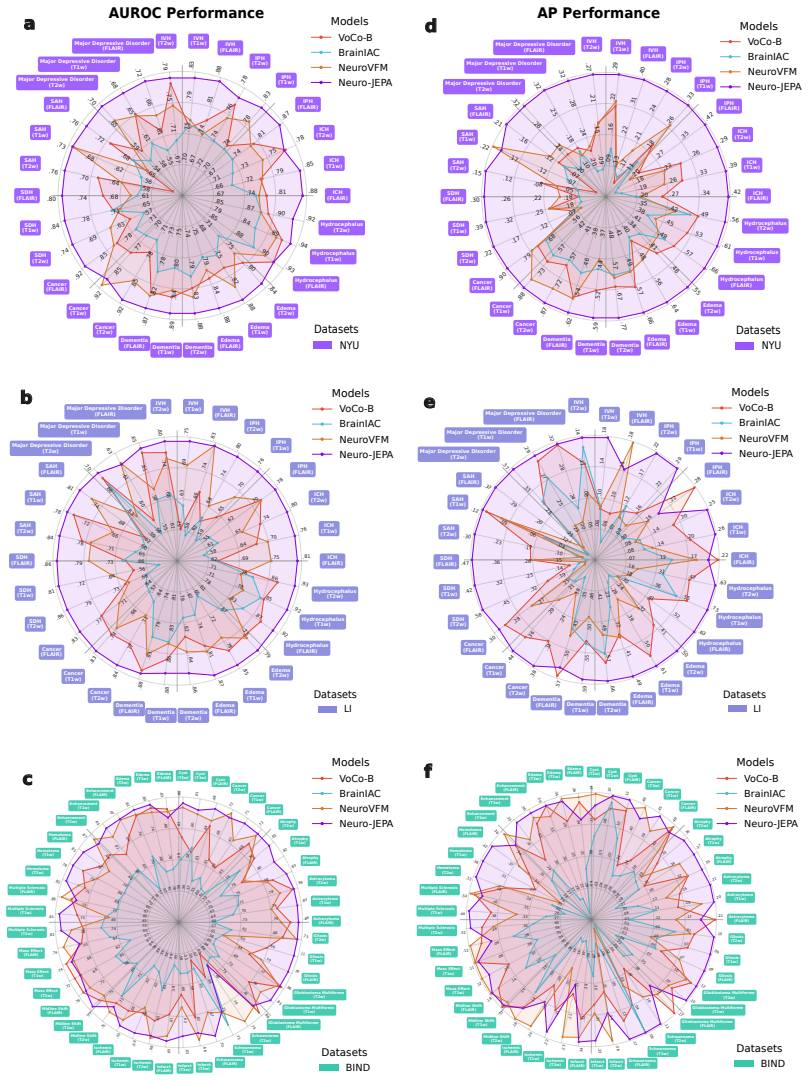
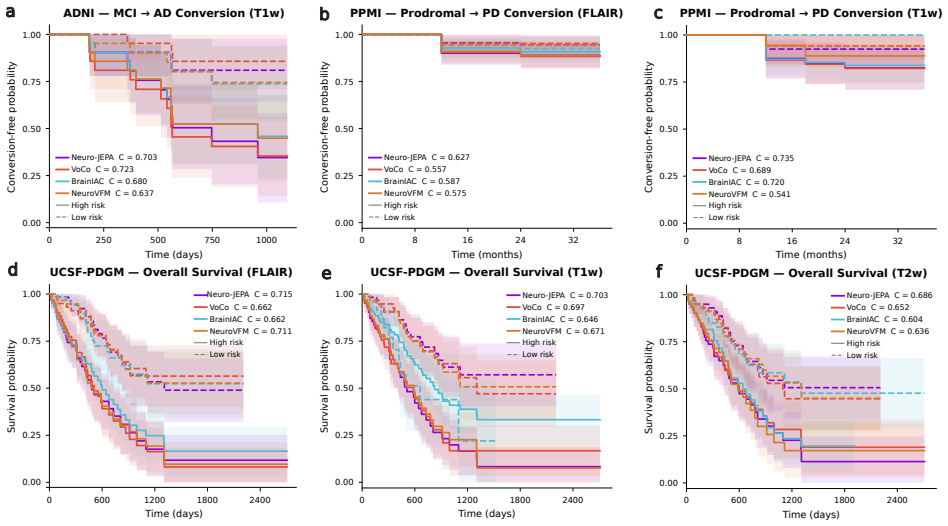
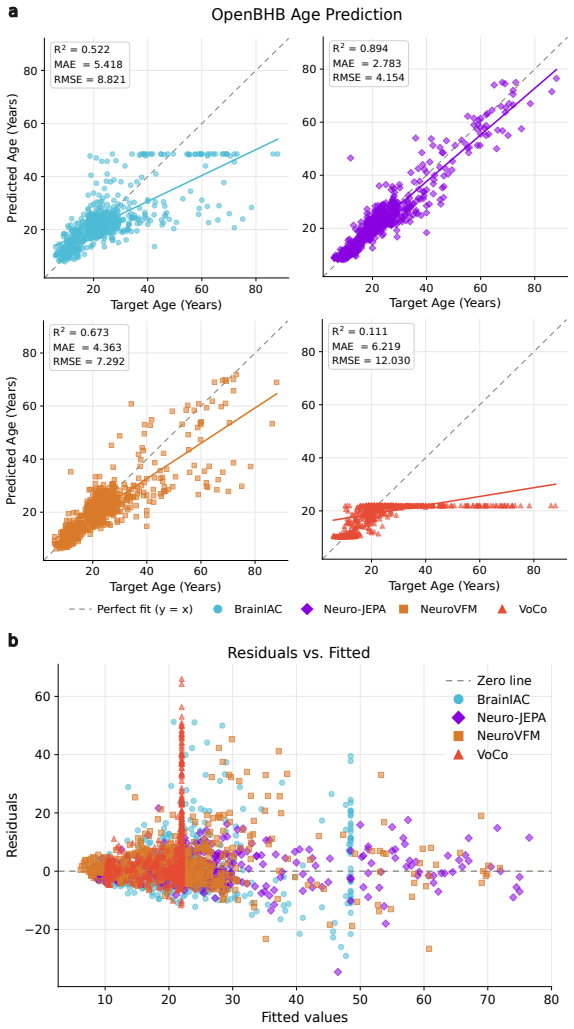
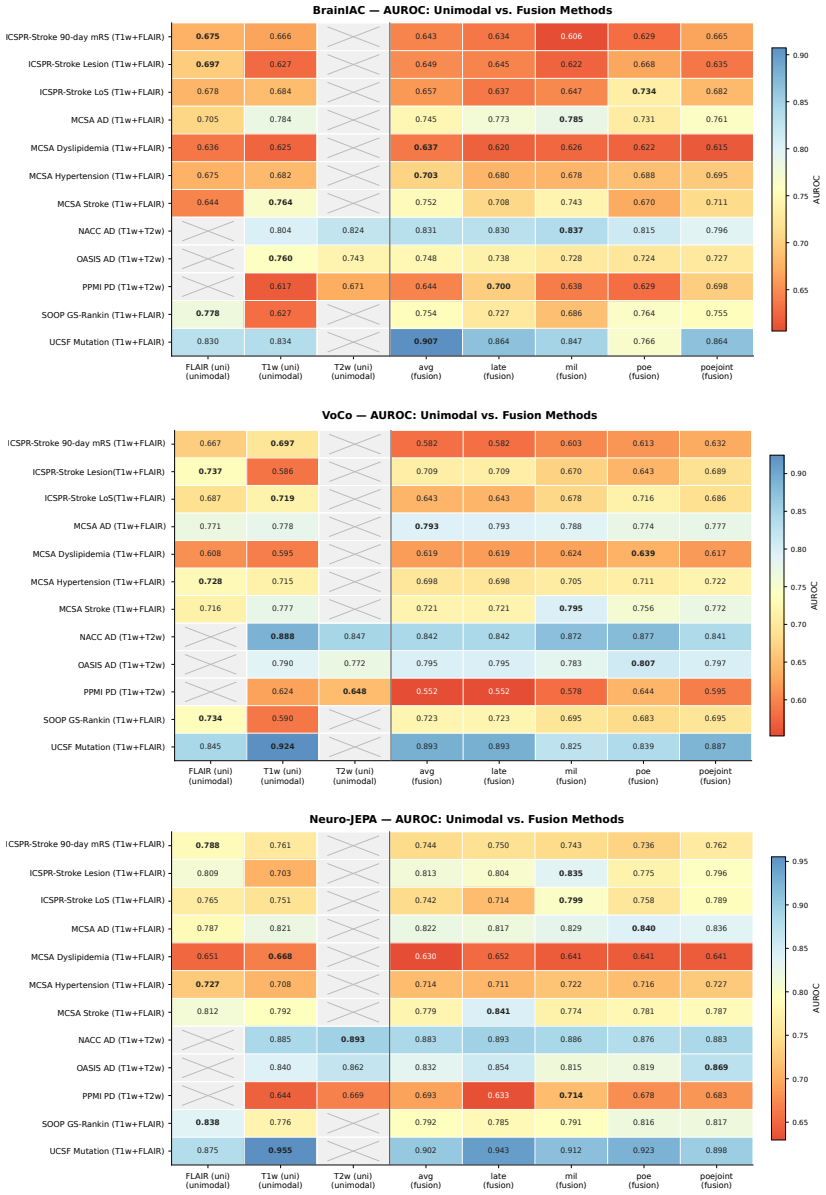
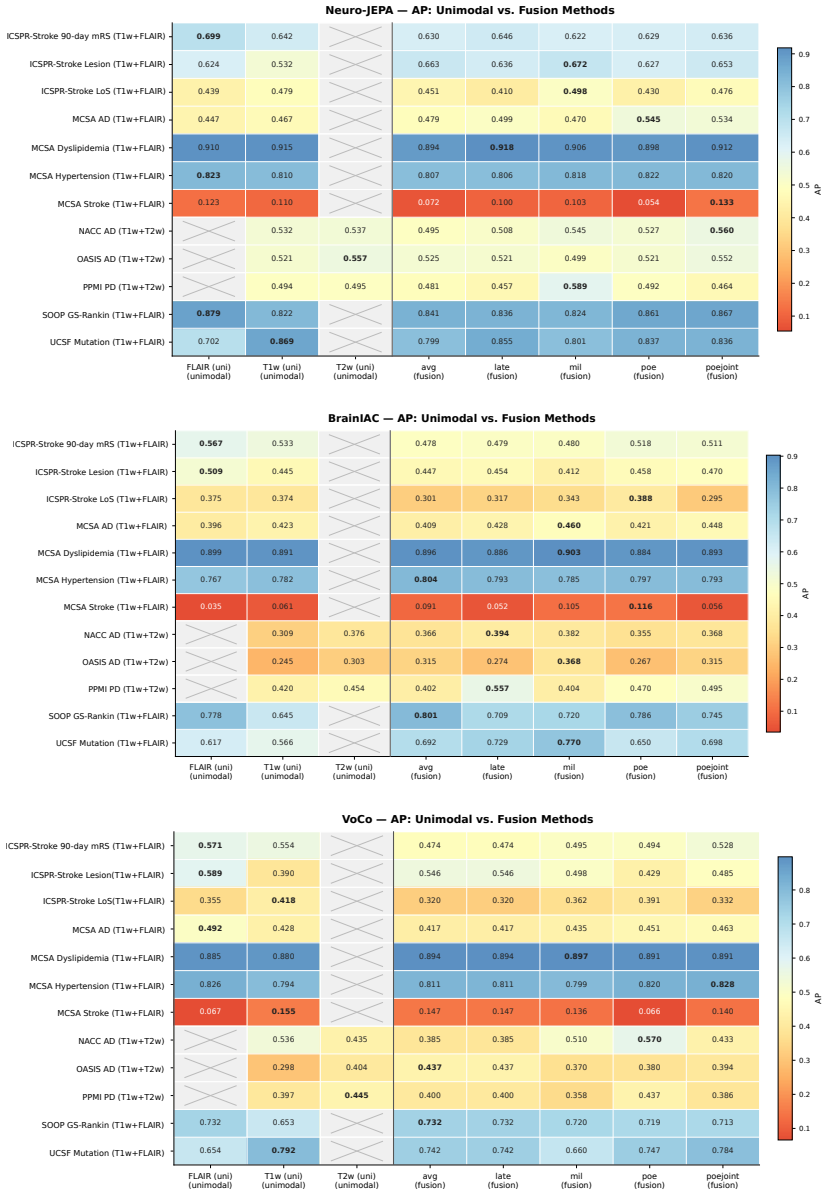
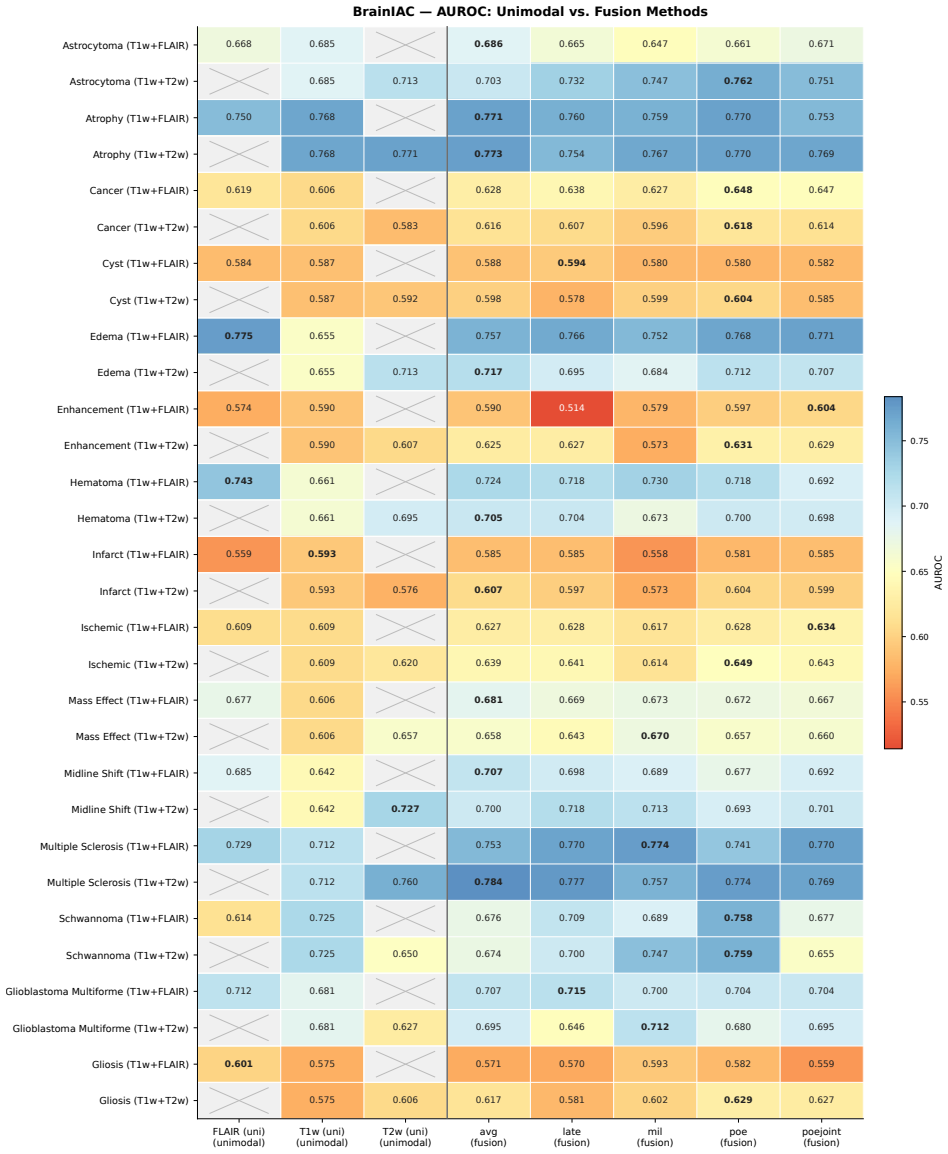
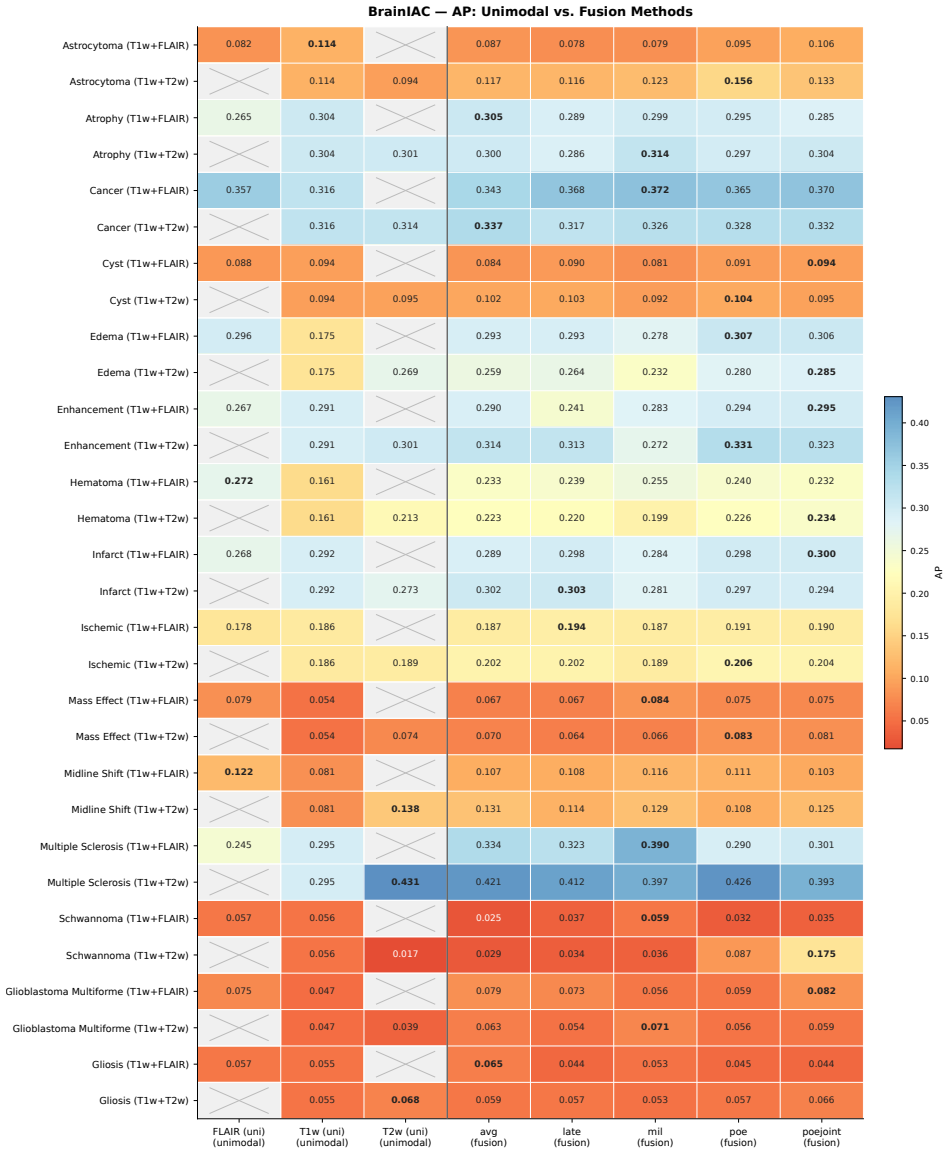
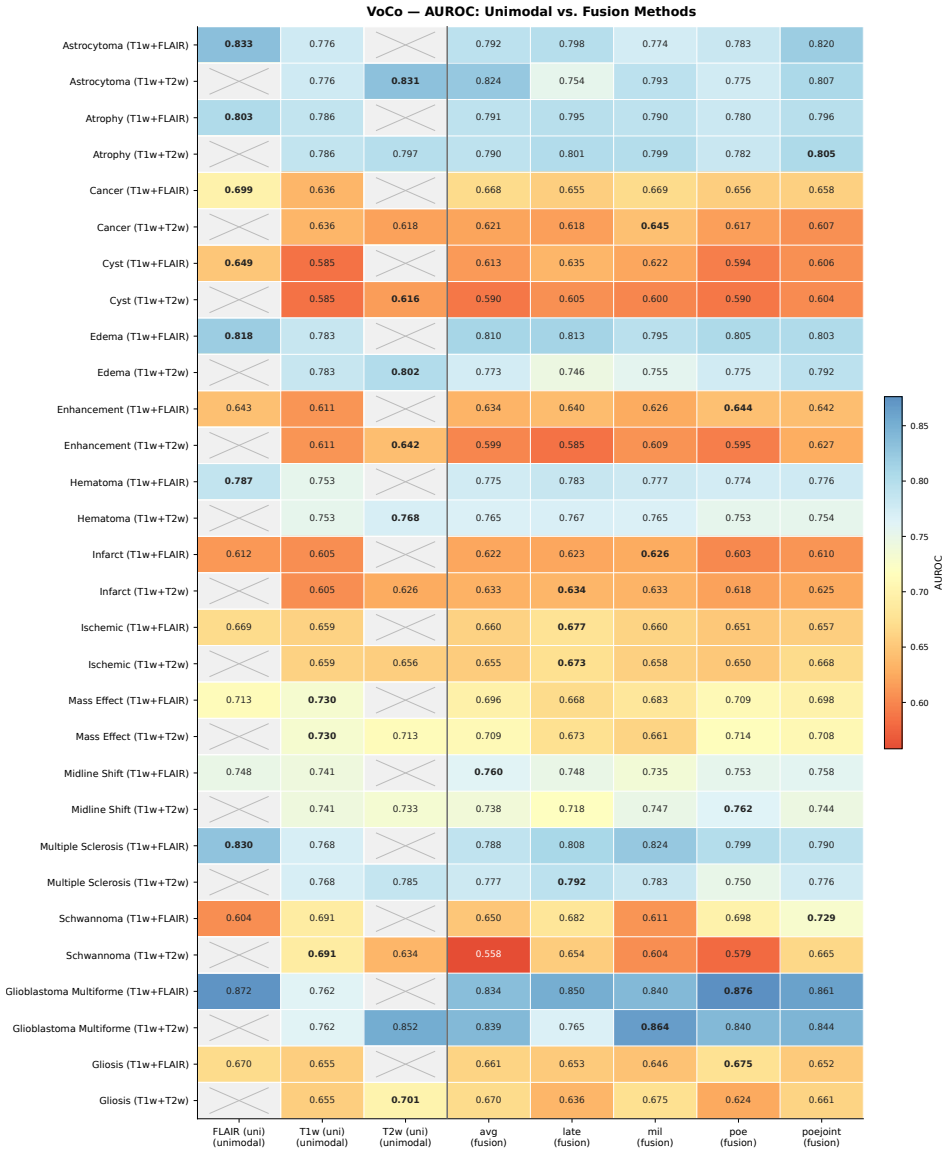
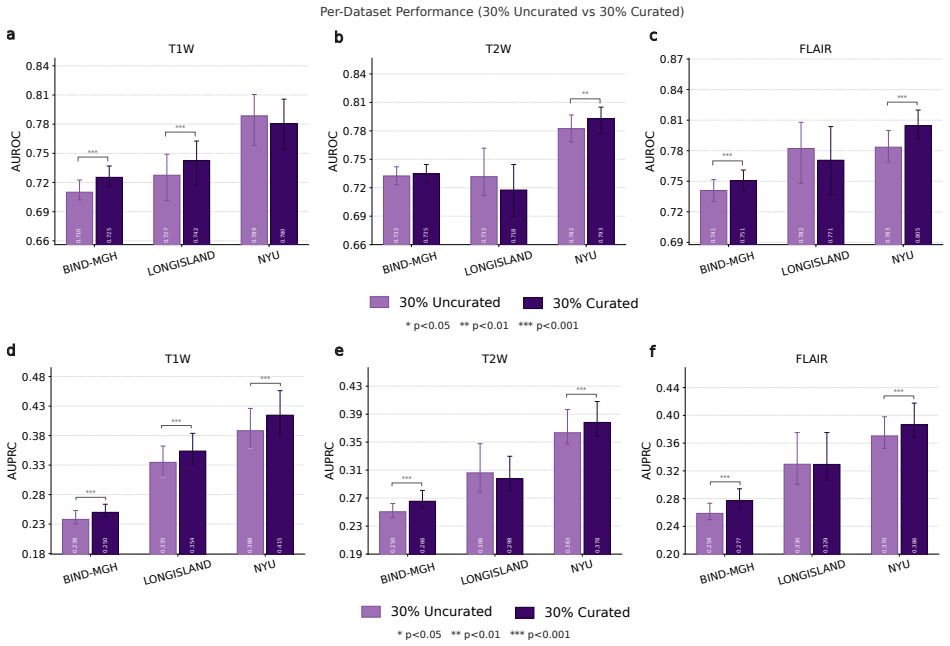
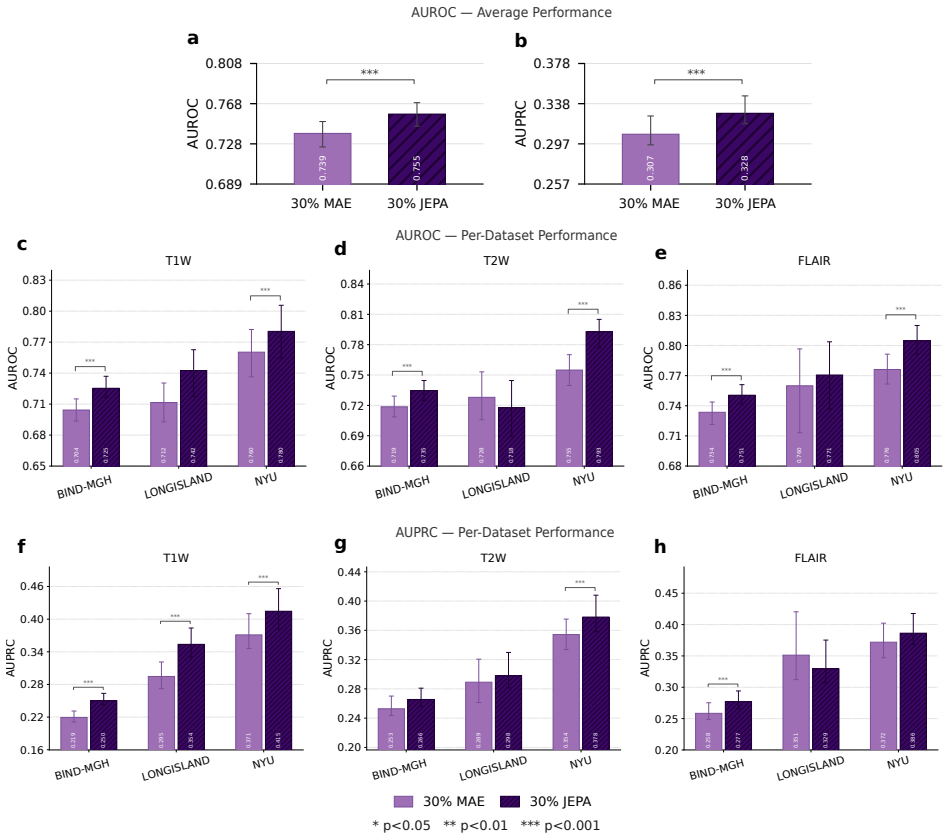
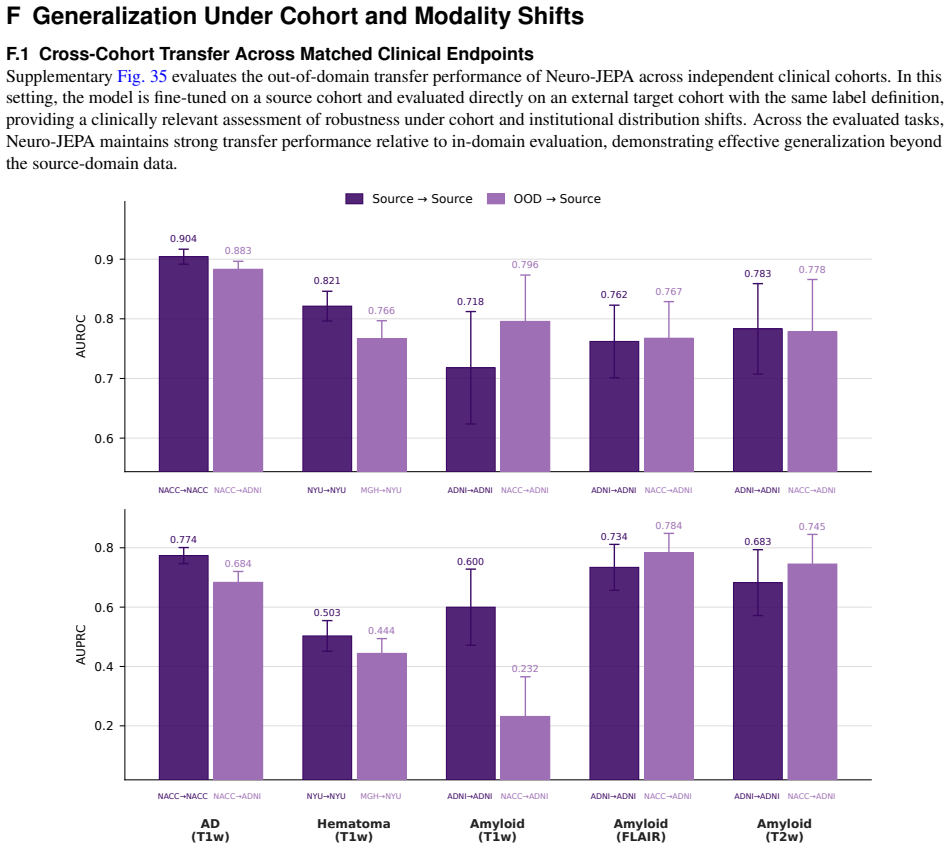
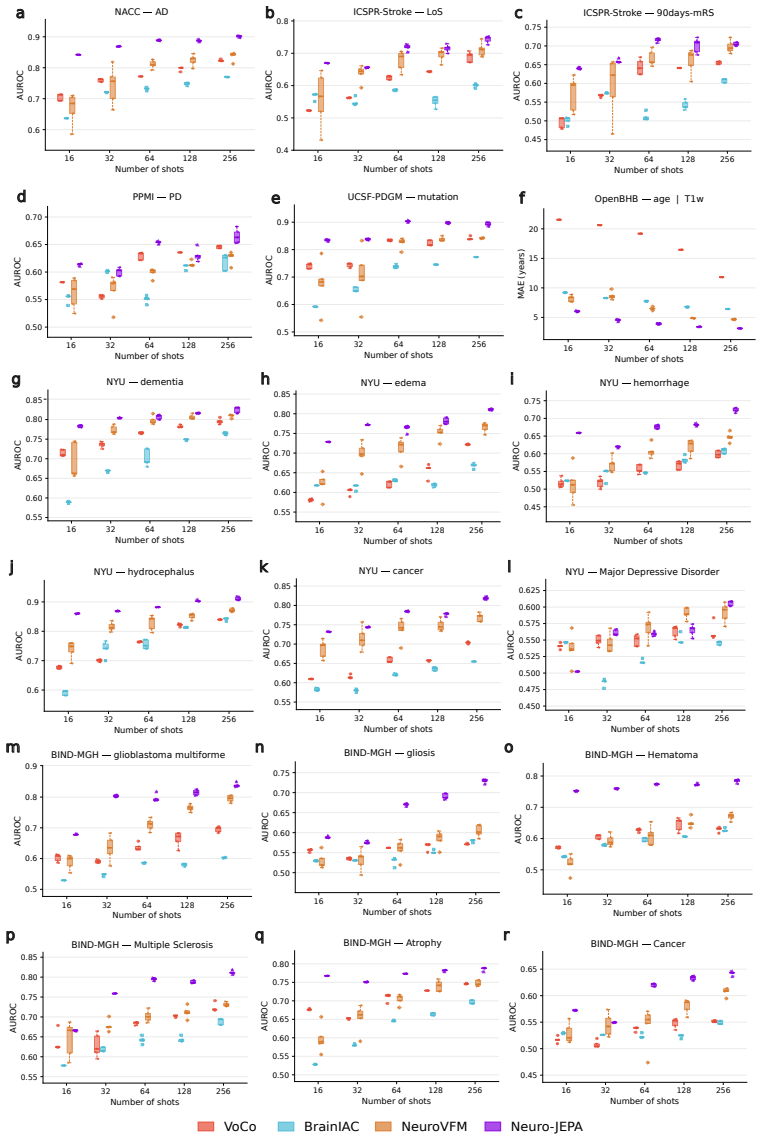
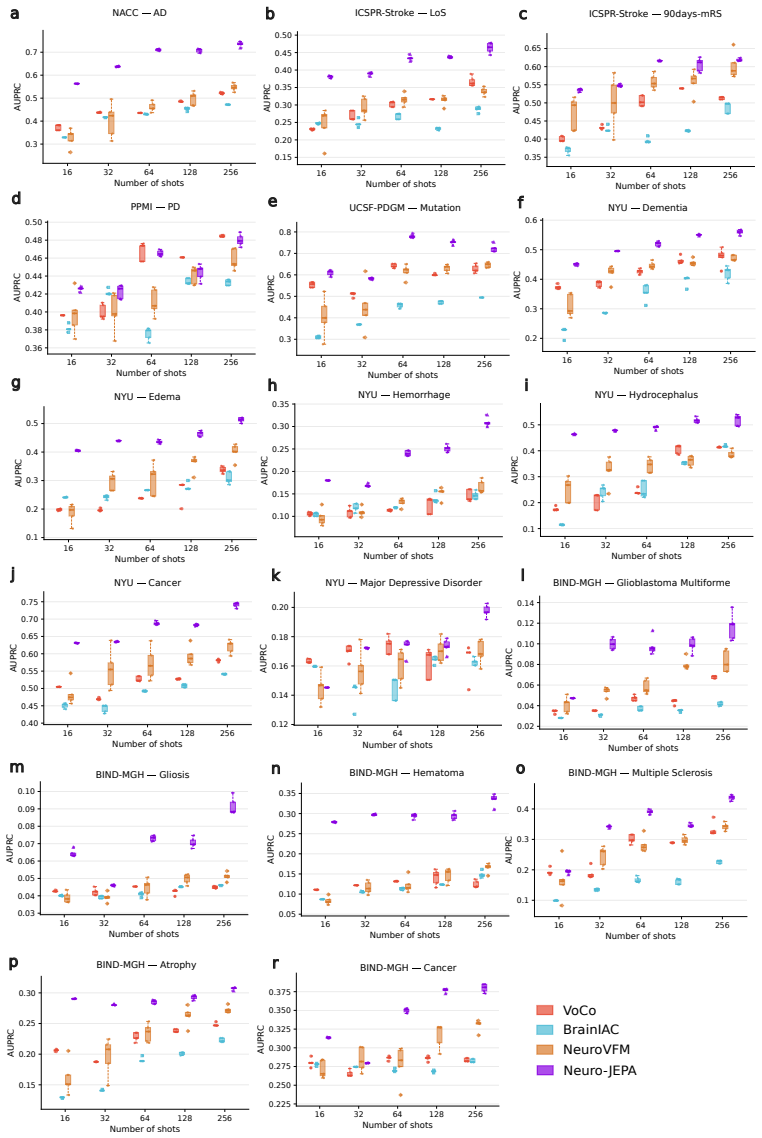
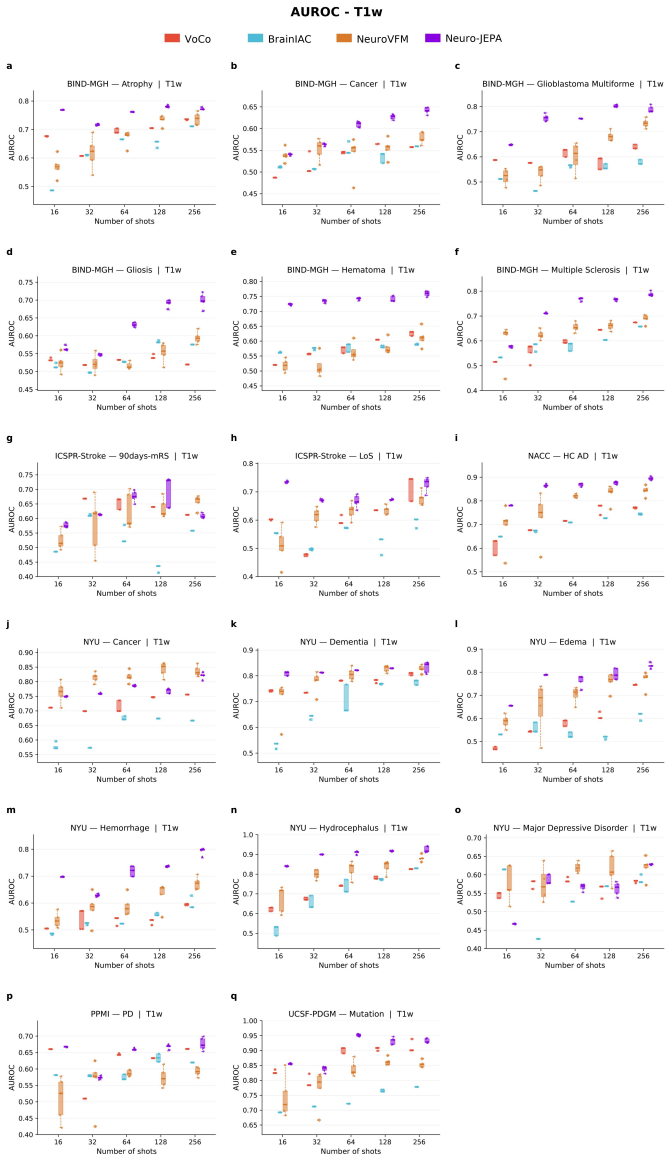
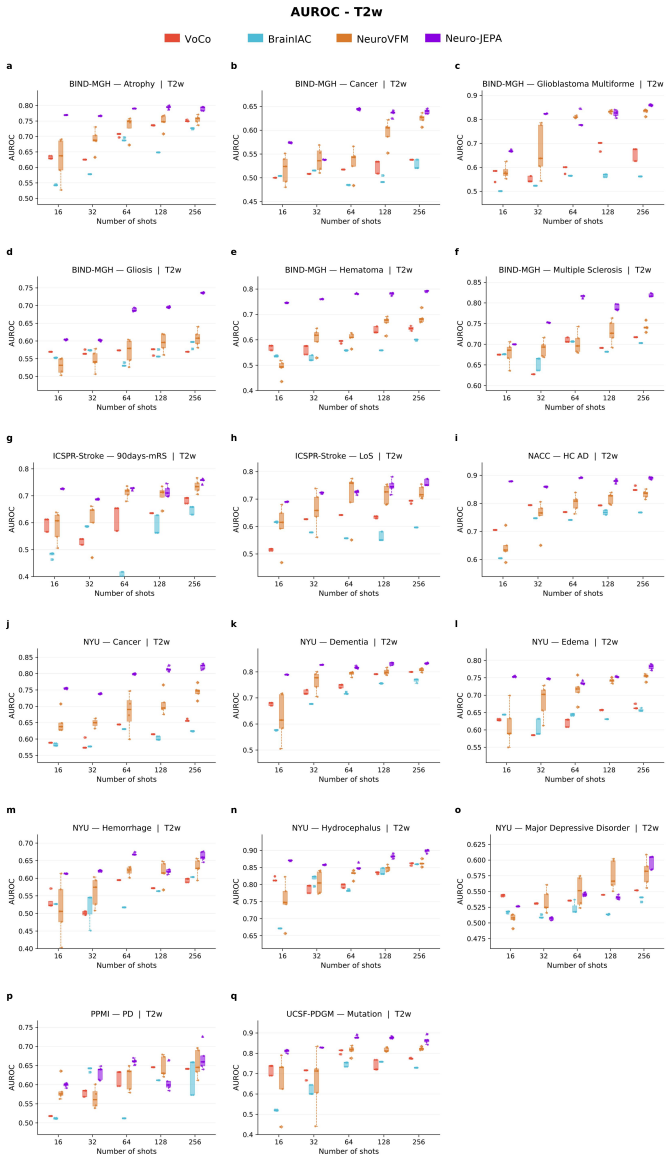
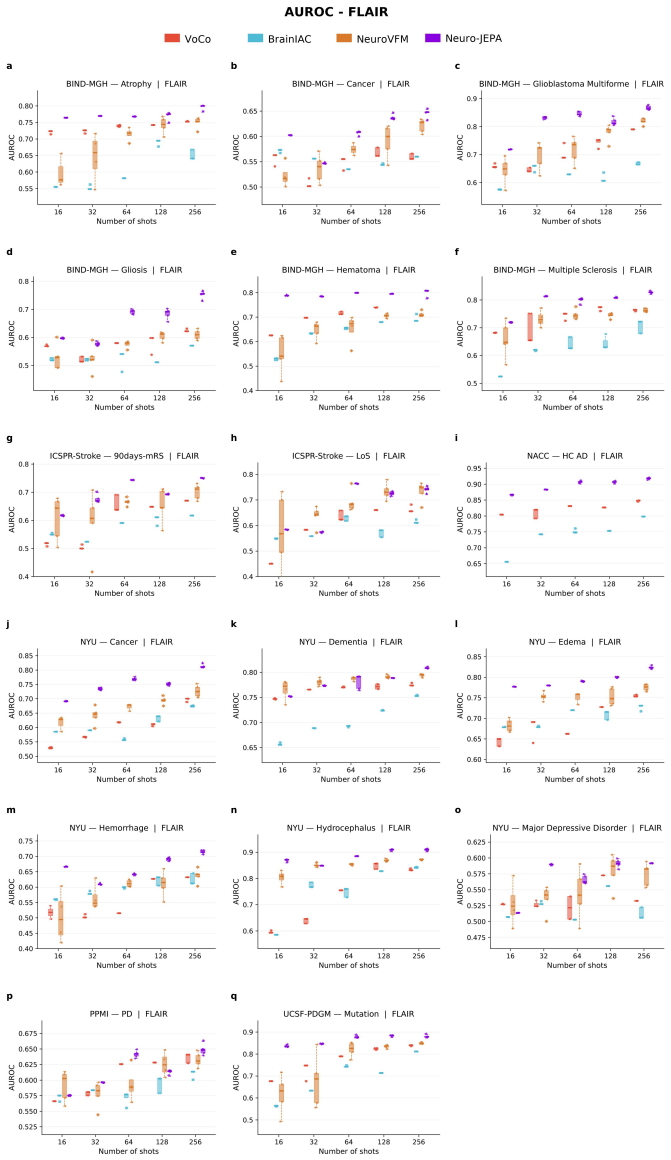
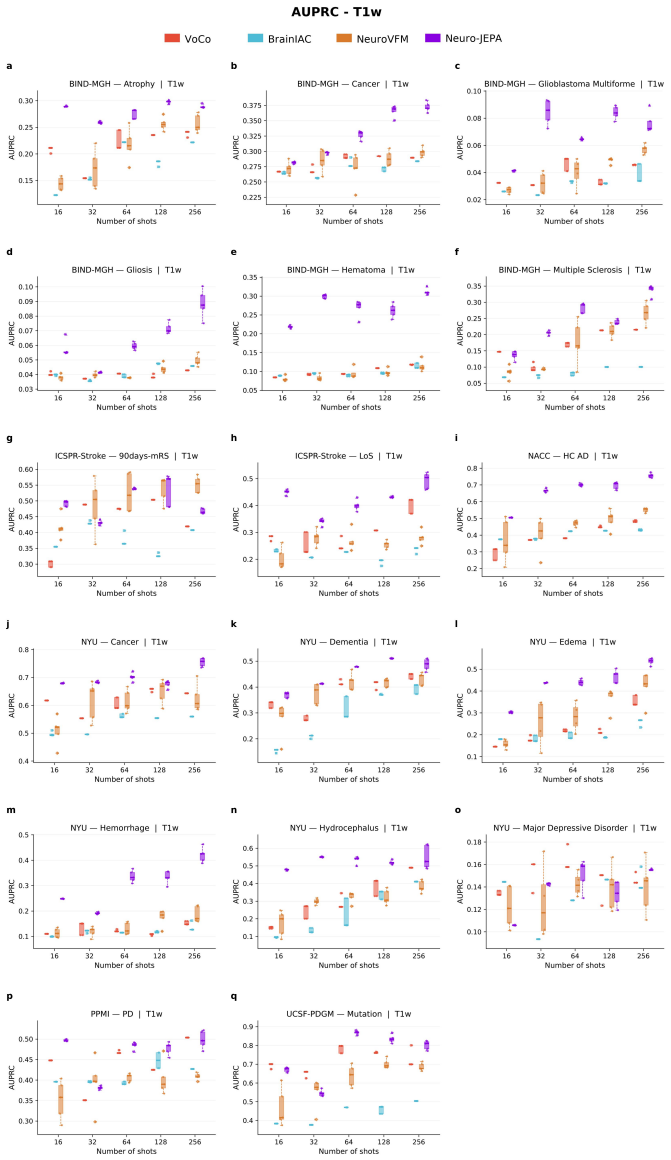
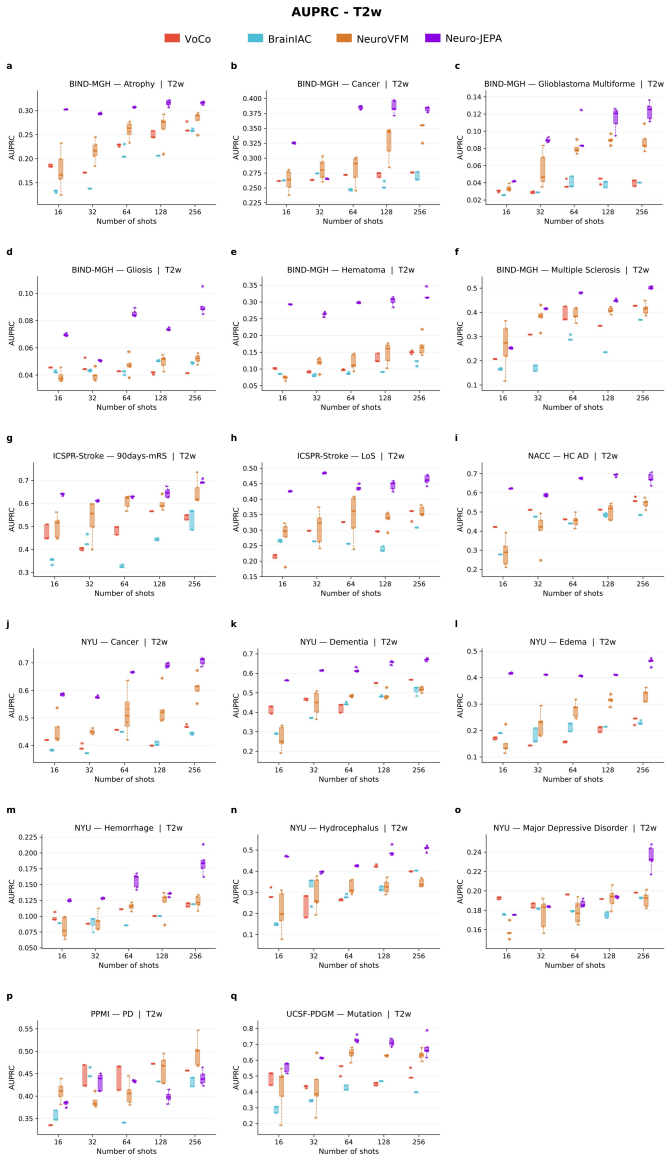
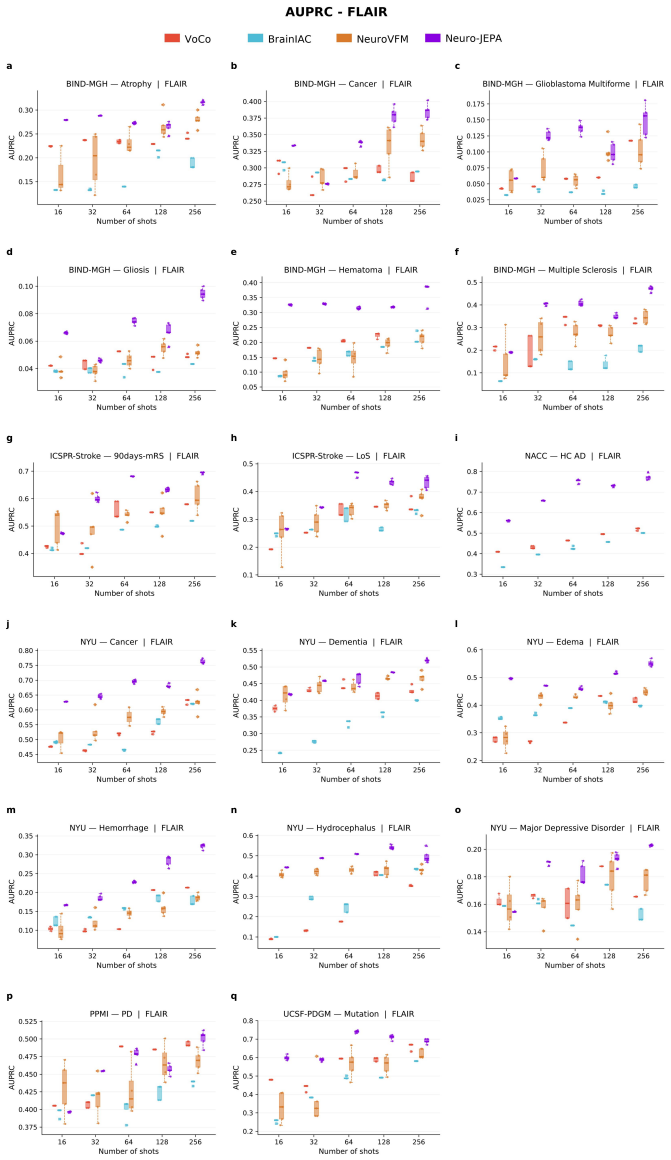
Neuro-JEPA, pretrained on 1,551,862 scans from 428,647 studies after modality-specific preprocessing, achieves stronger and more consistent performance than existing neuroimaging foundation models and a simple convolutional neural network baseline across unimodal, multimodal, and cross-domain evaluation configurations on 25 tasks from NYU Langone, NYU Long Island, and Massachusetts General Hospital plus 22 tasks from 12 public datasets.
What carries the argument
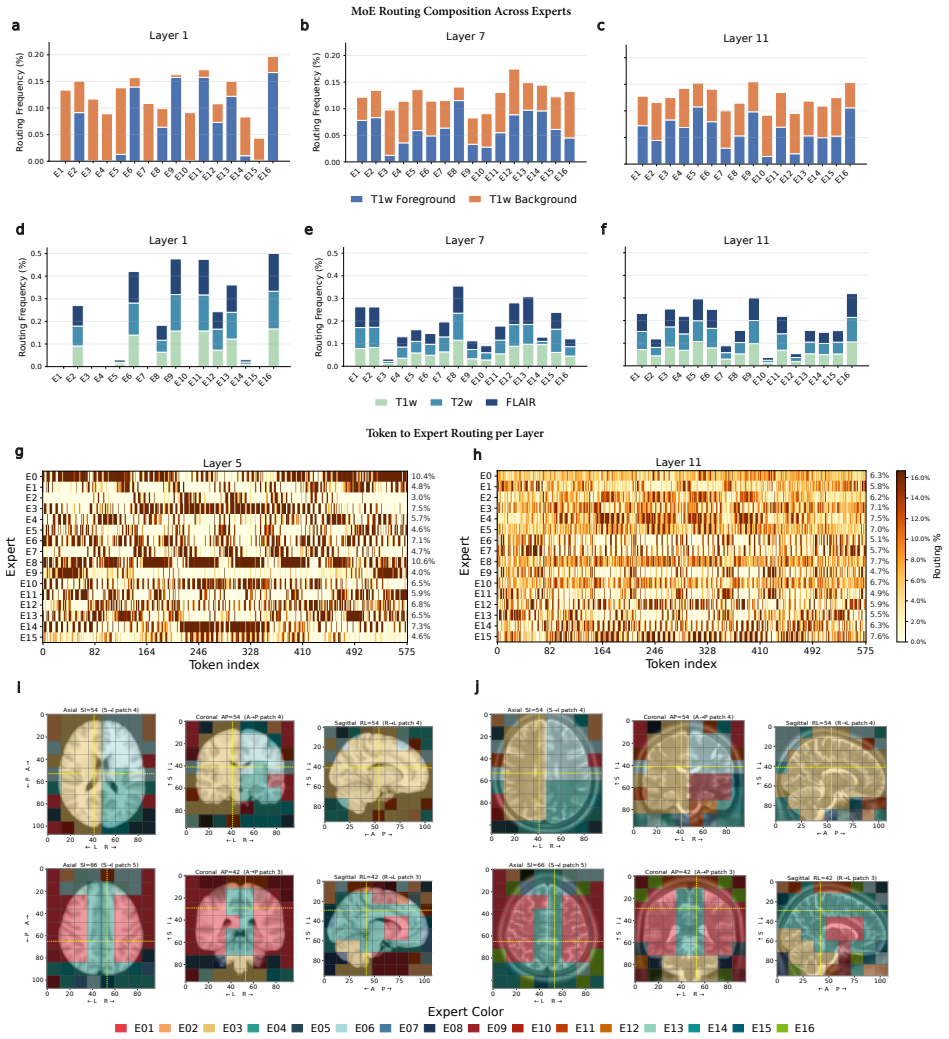
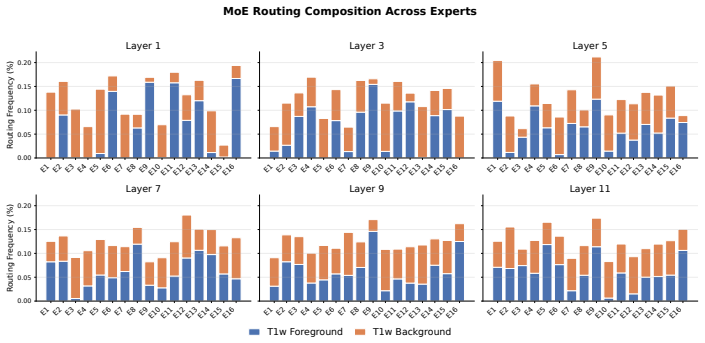
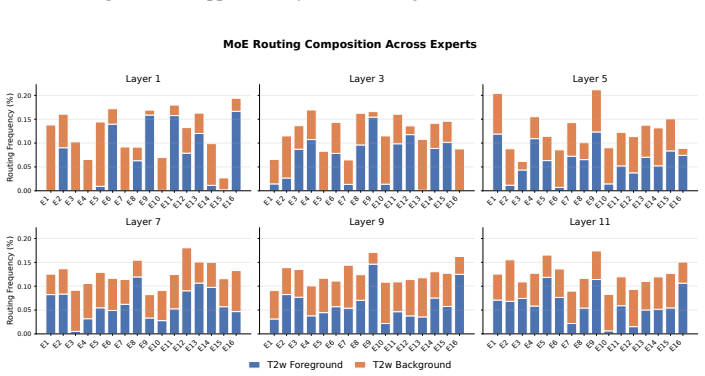
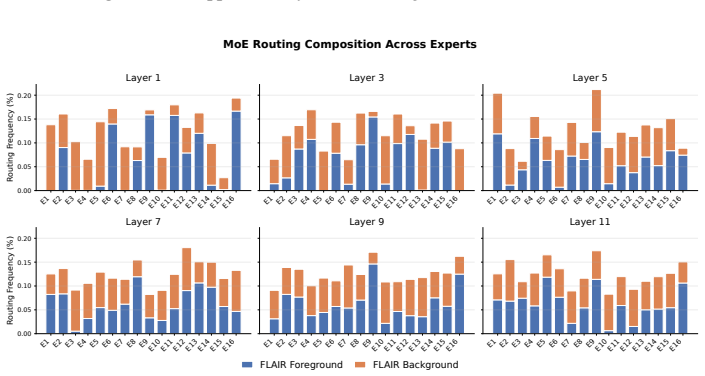
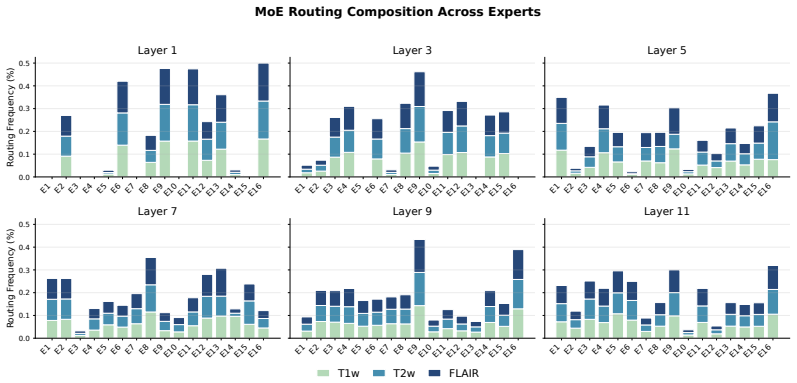
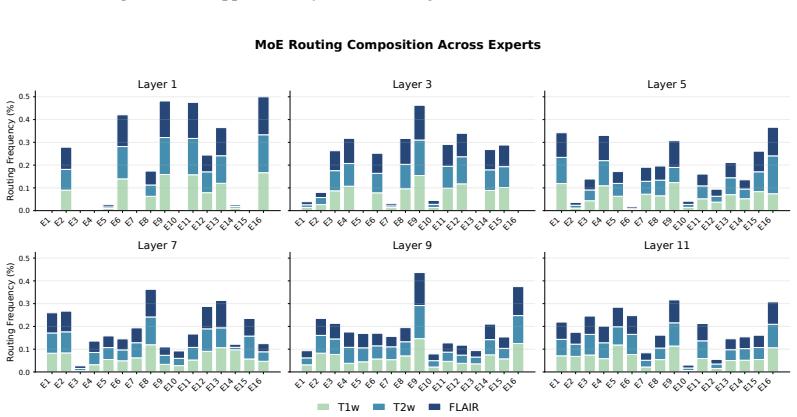
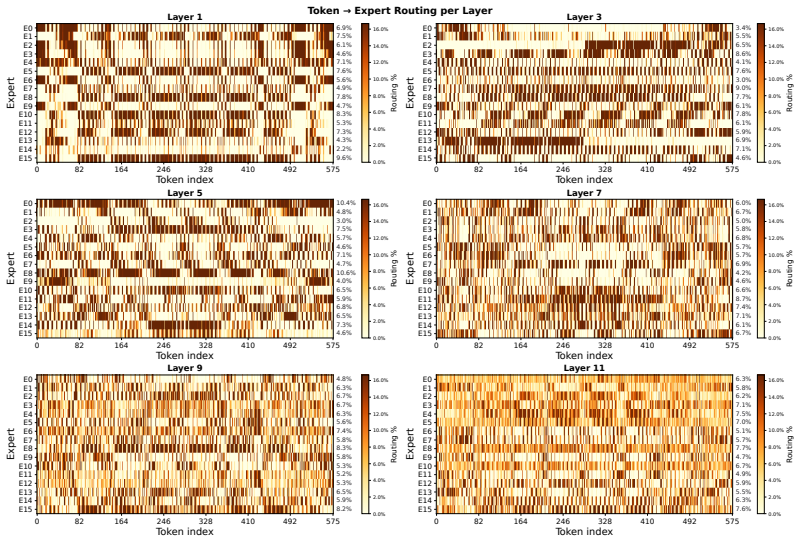
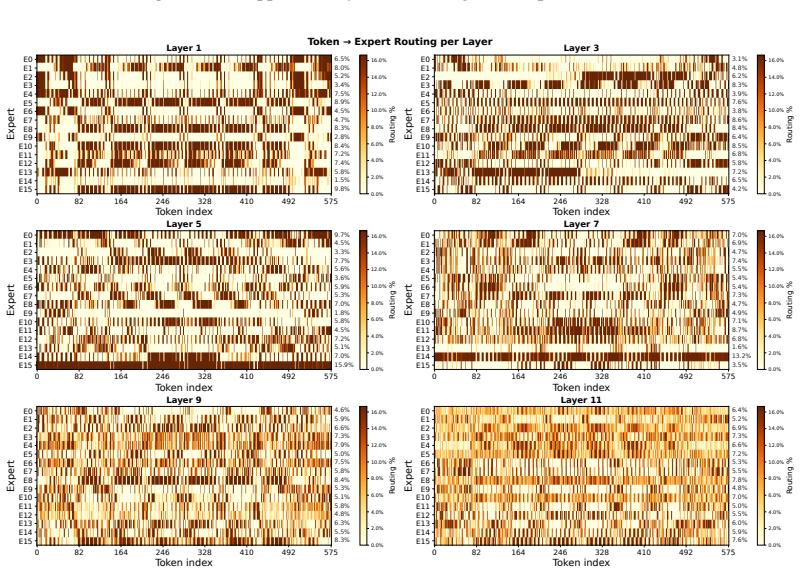
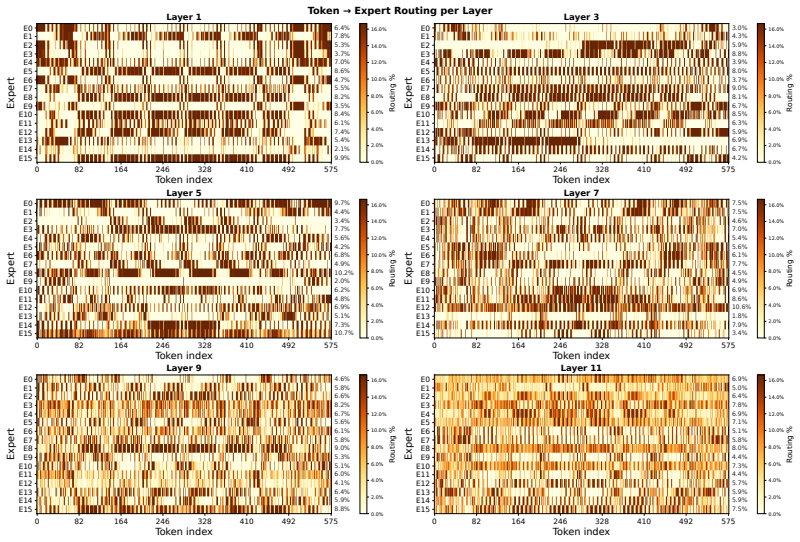
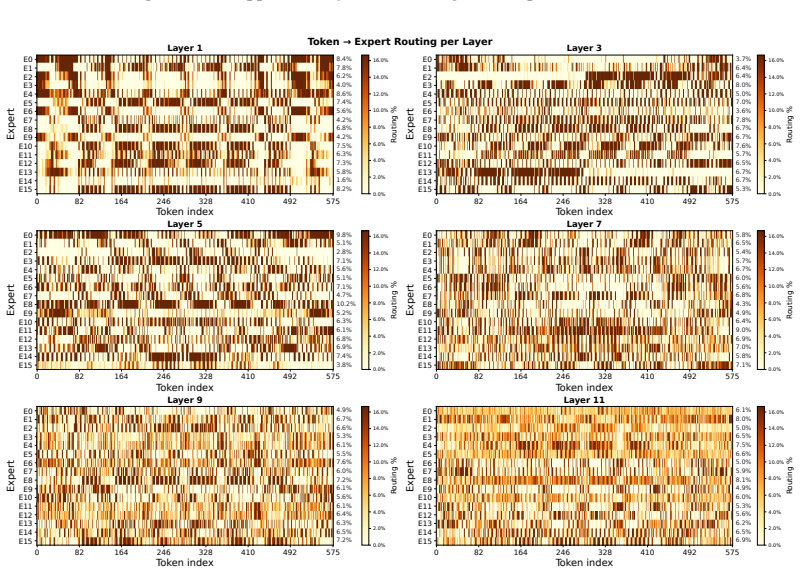
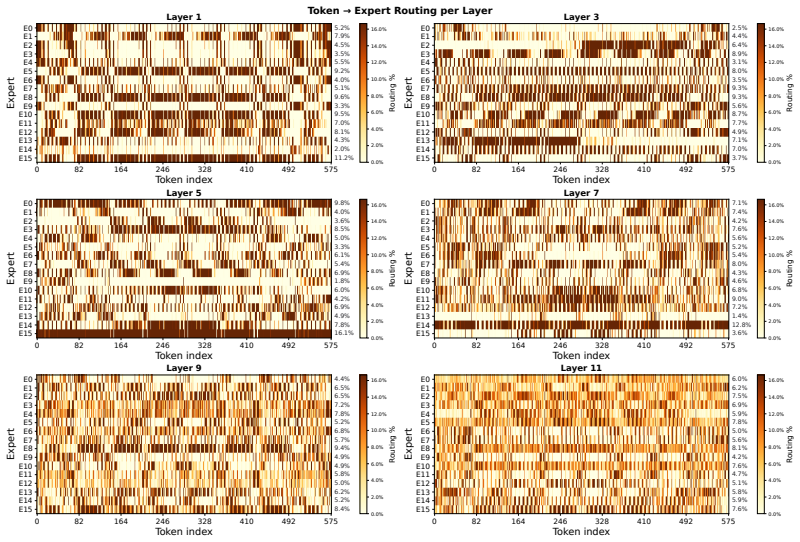
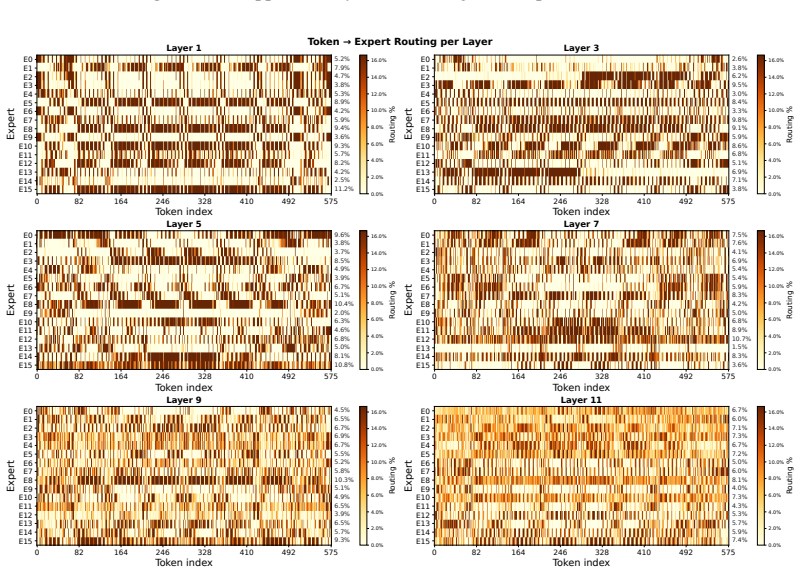
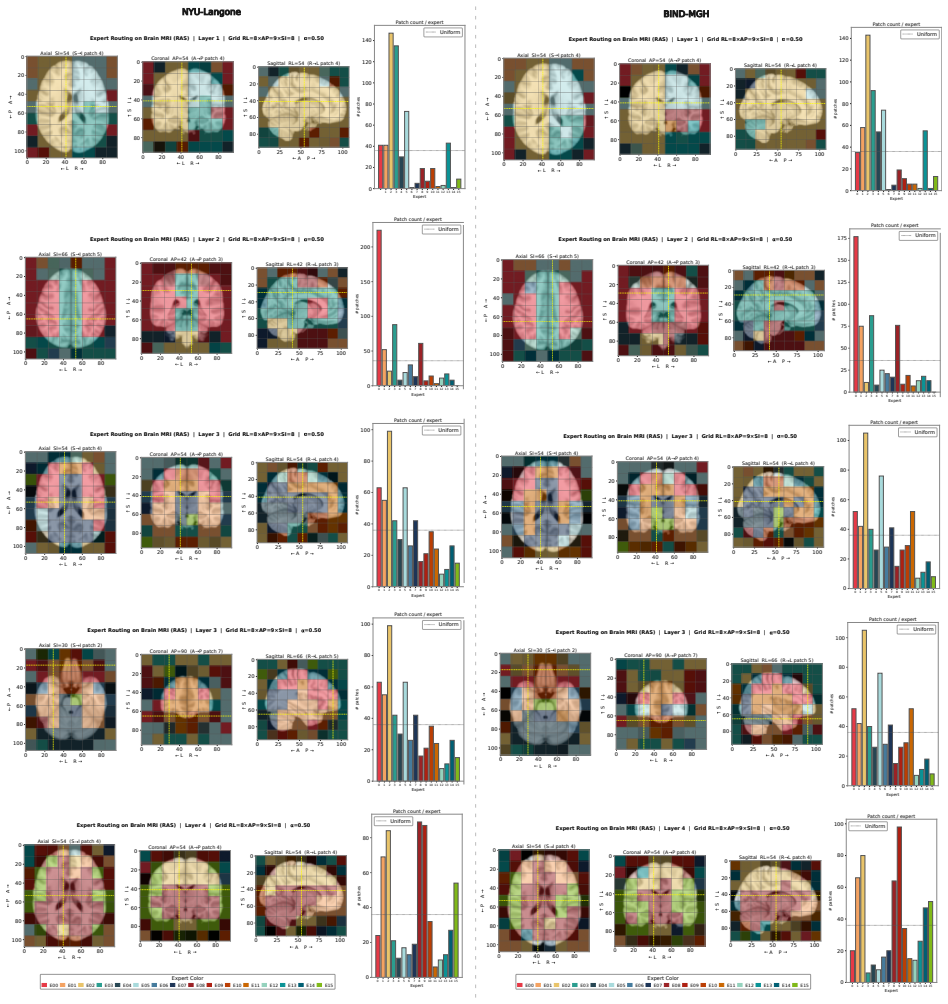
Neuro-JEPA: a sparse multimodal neuroimaging foundation model that combines a latent predictive objective with a Mixture-of-Experts architecture to encode brain MRI across T1w, T2w, and FLAIR sequences.
If this is right
- A scalable methodological framework exists for multimodal neuroimaging representation learning.
- Foundation model evaluations in neuroimaging should routinely include simple CNN baselines, clinically heterogeneous cohorts, and controlled multimodal comparisons.
- The latent predictive plus Mixture-of-Experts design supports robust performance in unimodal, multimodal, and cross-domain settings.
Where Pith is reading between the lines
- The same sparse predictive approach might transfer to other multi-sequence medical imaging domains such as CT or PET.
- Requiring simple baselines in every evaluation could reduce over-claiming of gains in medical foundation model papers.
- Pretraining directly on multi-site health-system data may reduce the usual domain-shift problems when models move into new hospitals.
Load-bearing premise
The chosen 25 tasks from three health systems plus 22 public tasks provide a representative test of multimodal performance without hidden selection effects or site-specific biases.
What would settle it
Neuro-JEPA would lose its claim of consistent superiority if it failed to outperform the CNN baseline on a fresh collection of tasks drawn from additional health systems that use different scanner vendors or acquisition protocols.
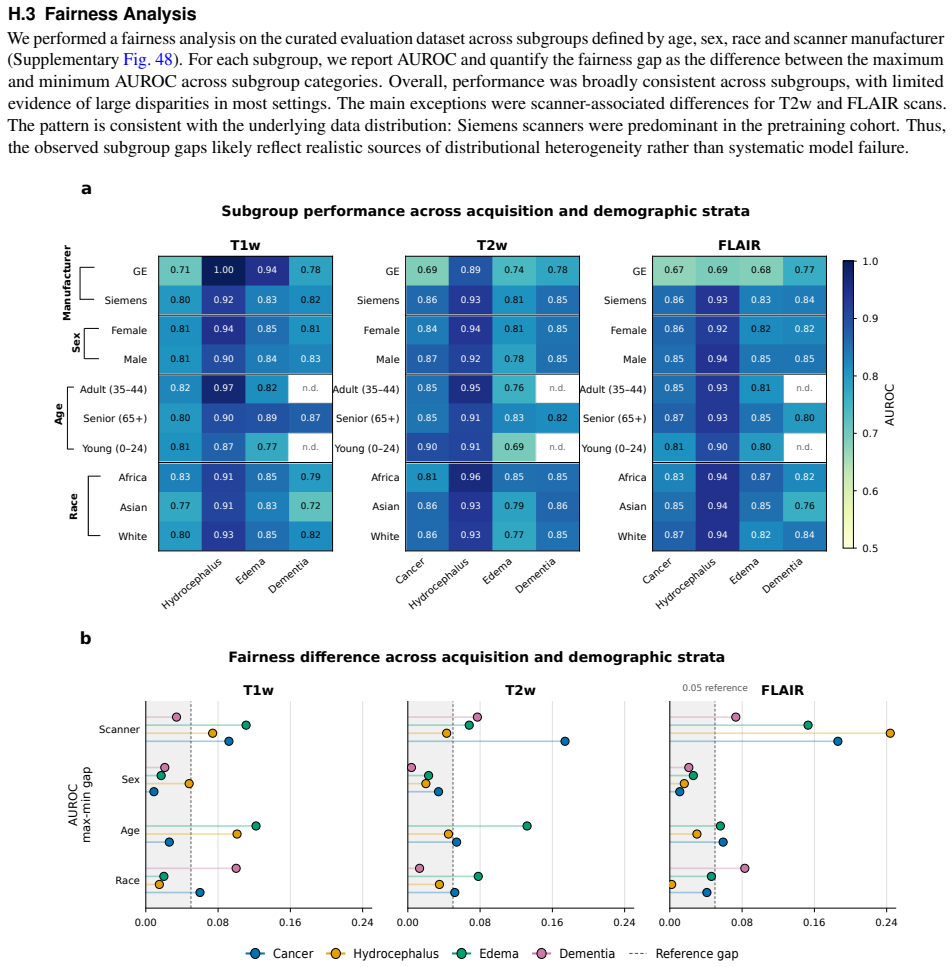
Figures

read the original abstract
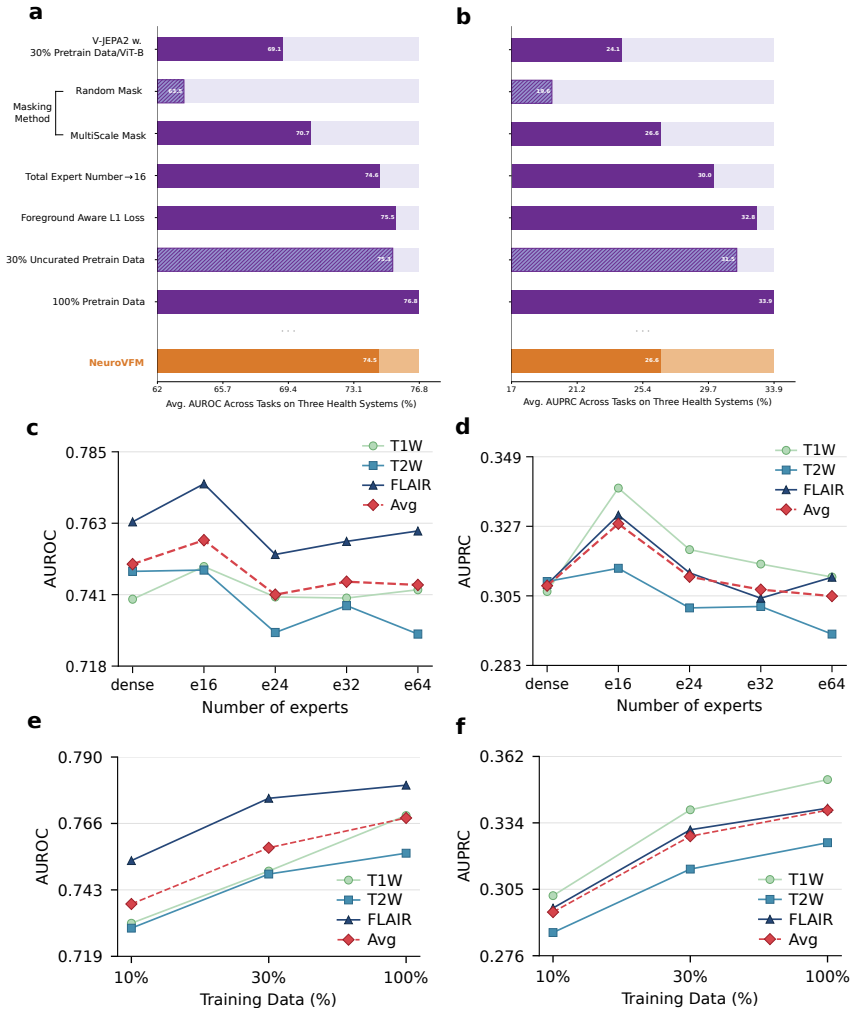
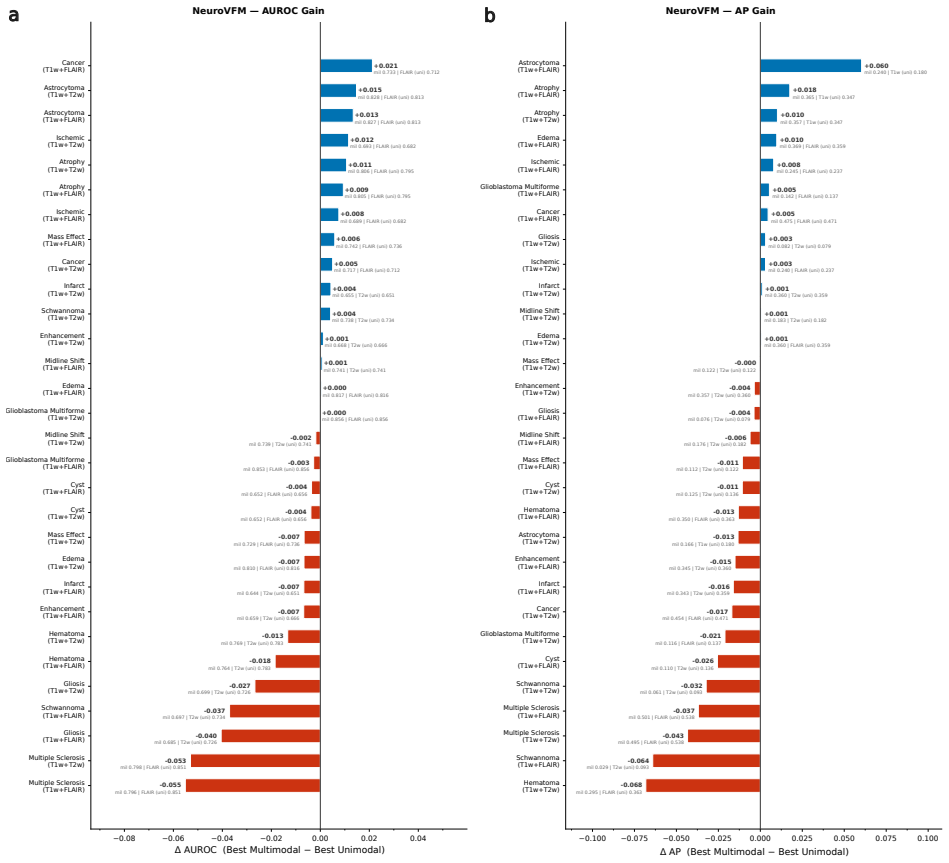
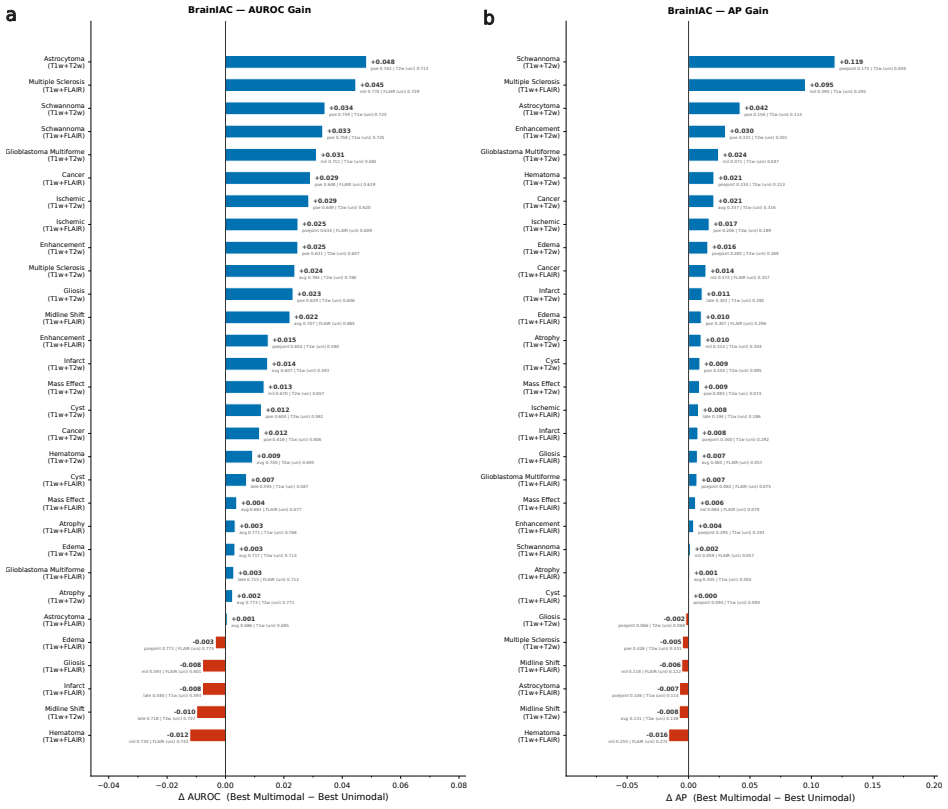
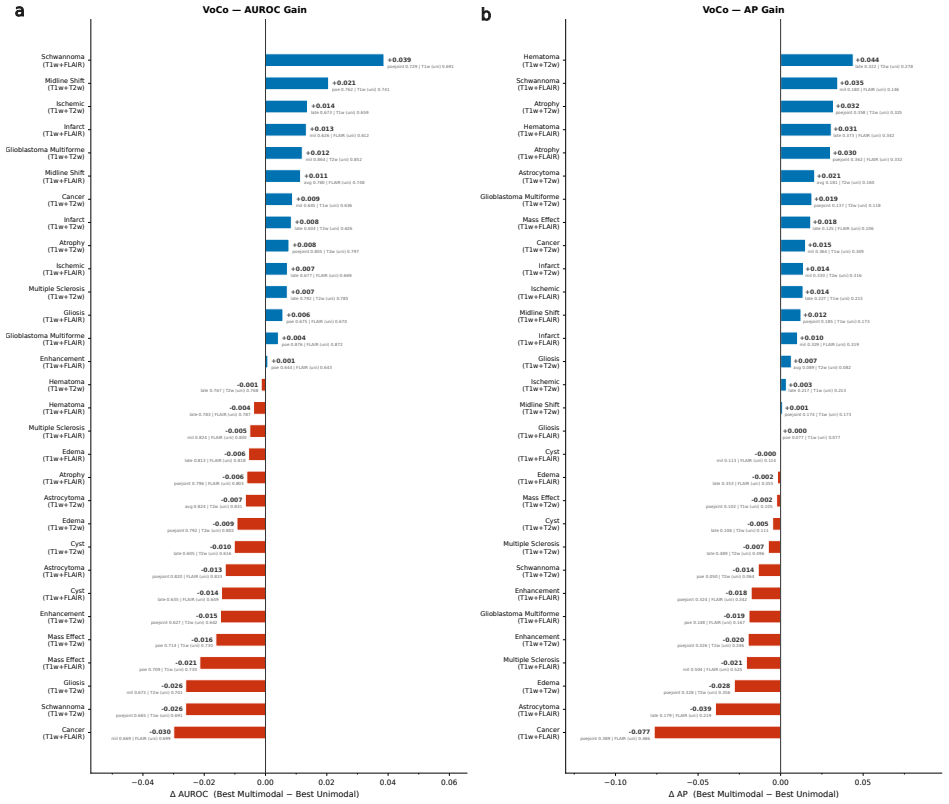
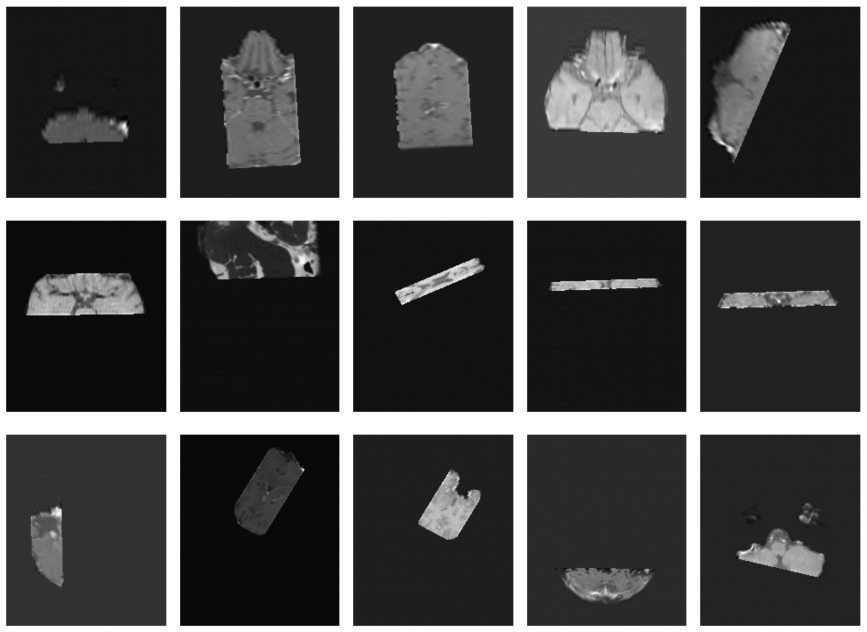
Brain MRIs are routinely acquired as multiple complementary sequences with unique contrast weighting, including T1-weighed imaging (T1w) anatomic and fluid-sensitive T2-weighted (T2w) contrasts. However, methods for learning unified representations across the multitude of MRI contrast mechanisms at health-system scale are lacking. In this study, we introduce Neuro-JEPA, a sparse multimodal neuroimaging foundation model that combines a latent predictive objective with a Mixture-of-Experts architecture to encode brain MRI across core T1w, T2w, and fluid-suppressed FLAIR imaging (FLAIR). We further provide a systematic methodological study of architectural, masking, objective, and sparsity design choices beneficial for robust neuroimaging multimodal representation learning. Neuro-JEPA was pretrained on 1,551,862 scans from 428,647 studies after modality-specific preprocessing with data curation across three core structural brain MRI sequences. We evaluated the learned representations across clinical and research settings, including 25 tasks from three health systems: NYU Langone, NYU Long Island, and Massachusetts General Hospital, and 22 tasks from 12 public datasets, covering unimodal, multimodal and cross-domain evaluation configurations. Across these benchmarks, existing neuroimaging foundation models showed inconsistent gains over a simple convolutional neural network (CNN) baseline, whereas Neuro-JEPA achieved stronger and more consistent performance across all evaluated settings. These results establish a scalable methodological framework for multimodal neuroimaging representation learning and highlight the need for foundation model evaluation protocols that include simple baselines, clinically heterogeneous cohorts and controlled multimodal comparisons.
Editorial analysis
A structured set of objections, weighed in public.
Referee Report
Summary. The paper introduces Neuro-JEPA, a sparse multimodal neuroimaging foundation model combining a latent predictive objective with a Mixture-of-Experts architecture to encode brain MRI across T1w, T2w, and FLAIR sequences. Pretrained on 1,551,862 scans from 428,647 studies, the model is evaluated on 25 tasks from three health systems (NYU Langone, NYU Long Island, MGH) and 22 tasks from 12 public datasets. The central claim is that Neuro-JEPA delivers stronger and more consistent performance across unimodal, multimodal, and cross-domain settings than existing neuroimaging foundation models, which showed inconsistent gains over a simple CNN baseline. The work also reports a systematic study of architectural, masking, objective, and sparsity choices.
Significance. If the performance claims hold with appropriate controls, this would represent a meaningful advance in scalable multimodal representation learning for neuroimaging by addressing the lack of unified methods across MRI contrasts at health-system scale. The large pretraining corpus and explicit inclusion of a CNN baseline are notable strengths that could help establish more reliable evaluation practices.
major comments (2)
- [Abstract] Abstract: The assertion that Neuro-JEPA 'achieved stronger and more consistent performance across all evaluated settings' is presented without any quantitative metrics, error bars, statistical tests, result tables, or ablation summaries. This absence is load-bearing for the central empirical claim, as it prevents verification of the reported gains relative to the CNN baseline or prior models.
- [Benchmark suite description] Benchmark suite description (25 tasks from three health systems plus 22 public tasks): No information is supplied on a priori task registration, exclusion criteria, potential subject overlap with the pretraining data, or statistical adjustment for scanner/protocol heterogeneity across sites. These details are required to isolate the consistency claim from selection bias or site effects.
Simulated Author's Rebuttal
We thank the referee for the constructive comments. We address each major point below and indicate revisions to strengthen the manuscript.
read point-by-point responses
-
Referee: [Abstract] Abstract: The assertion that Neuro-JEPA 'achieved stronger and more consistent performance across all evaluated settings' is presented without any quantitative metrics, error bars, statistical tests, result tables, or ablation summaries. This absence is load-bearing for the central empirical claim, as it prevents verification of the reported gains relative to the CNN baseline or prior models.
Authors: The abstract is a concise summary; full quantitative results with metrics, error bars, statistical tests, tables vs. CNN baseline and prior models, and ablations appear in Section 4 and supplements. We will revise the abstract to include key quantitative highlights (e.g., average gains and consistency metrics) while respecting length limits. revision: yes
-
Referee: [Benchmark suite description] Benchmark suite description (25 tasks from three health systems plus 22 public tasks): No information is supplied on a priori task registration, exclusion criteria, potential subject overlap with the pretraining data, or statistical adjustment for scanner/protocol heterogeneity across sites. These details are required to isolate the consistency claim from selection bias or site effects.
Authors: We agree these details strengthen the consistency claims. The Methods section describes the tasks but omits explicit selection process. We will add a subsection on benchmark construction covering a priori criteria, exclusion rules, overlap verification (public datasets are disjoint; clinical tasks use held-out studies), and site-heterogeneity handling via per-site normalization and mixed-effects models. revision: yes
Circularity Check
No circularity: empirical claims rest on external benchmarks without self-referential fitting or derivation
full rationale
The paper introduces Neuro-JEPA via pretraining on 1.55M scans followed by evaluation on 47 tasks across health systems and public datasets. No equations, latent predictive objectives, or architectural choices are shown to reduce by construction to fitted inputs or self-citations; performance claims are presented as direct empirical outcomes against a CNN baseline and other models. The derivation chain is therefore self-contained and externally falsifiable.
Axiom & Free-Parameter Ledger
invented entities (1)
-
Neuro-JEPA
no independent evidence
Reference graph
Works this paper leans on
-
[1]
Commun.13, 3404, DOI: 10.1038/s41467-022-31037-5 (2022)
Qiu, S.et al.Multimodal deep learning for alzheimer’s disease dementia assessment.Nat. Commun.13, 3404, DOI: 10.1038/s41467-022-31037-5 (2022). 2.Castellano, A. & Falini, A. Progress in neuro-imaging of brain tumors.Curr Opin Oncol28, 484–493 (2016). 3.Gupta, A.et al.Neuroimaging of cerebrovascular disease in the aging brain.Aging Dis3, 414–425 (2012). 4....
-
[2]
D., Leslie, S
Patel, D. D., Leslie, S. W. & Shetty, M.Appropriate Magnetic Resonance Imaging Ordering(StatPearls Publishing, Treasure Island (FL), 2026). [Updated 2025 Nov 7]
2026
-
[3]
InInternational Conference on Learning Representations(2021)
Dosovitskiy, A.et al.An image is worth 16x16 words: Transformers for image recognition at scale. InInternational Conference on Learning Representations(2021)
2021
-
[5]
Assran, M.et al.V-jepa 2: Self-supervised video models enable understanding, prediction and planning.arXiv preprint arXiv:2506.09985(2025)
Pith/arXiv arXiv 2025
-
[6]
A path towards autonomous machine intelligence version 0.9.2, 2022-06-27.Open Rev.62, 1–62 (2022)
LeCun, Y . A path towards autonomous machine intelligence version 0.9.2, 2022-06-27.Open Rev.62, 1–62 (2022)
2022
-
[7]
& Shazeer, N
Fedus, W., Zoph, B. & Shazeer, N. Switch transformers: Scaling to trillion parameter models with simple and efficient sparsity.J. Mach. Learn. Res.23, 1–39 (2022)
2022
-
[8]
In Ranzato, M., Beygelzimer, A., Dauphin, Y ., Liang, P
Riquelme, C.et al.Scaling vision with sparse mixture of experts. In Ranzato, M., Beygelzimer, A., Dauphin, Y ., Liang, P. & Vaughan, J. W. (eds.)Advances in Neural Information Processing Systems, vol. 34, 8583–8595 (Curran Associates, Inc., 2021)
2021
-
[9]
Jordan, M. & Jacobs, R. Hierarchical mixtures of experts and the em algorithm. InProceedings of 1993 International Conference on Neural Networks (IJCNN-93-Nagoya, Japan), vol. 2, 1339–1344 vol.2, DOI: 10.1109/ IJCNN.1993.716791 (1993)
arXiv 1993
-
[10]
R., Puigcerver, J., Jenatton, R
Mustafa, B., Ruiz, C. R., Puigcerver, J., Jenatton, R. & Houlsby, N. Multimodal contrastive learning with LIMoe: the language-image mixture of experts. In Oh, A. H., Agarwal, A., Belgrave, D. & Cho, K. (eds.)Advances in Neural Information Processing Systems(2022)
2022
-
[11]
InInternational Conference on Learning Representations(2017)
Shazeer, N.et al.Outrageously large neural networks: The sparsely-gated mixture-of-experts layer. InInternational Conference on Learning Representations(2017). 21
2017
-
[12]
Tak, D.et al.A generalizable foundation model for analysis of human brain mri.Nat. Neurosci.DOI: 10.1038/s4 1593-026-02202-6 (2026)
work page doi:10.1038/s4 2026
-
[13]
& Chen, H
Wu, L., Zhuang, J. & Chen, H. Large-scale 3d medical image pre-training with geometric context priors.IEEE Transactions on Pattern Analysis Mach. Intell.(2025)
2025
-
[14]
Wu, L., Zhuang, J. & Chen, H. Large-scale 3d medical image pre-training with geometric context priors.IEEE Transactions on Pattern Analysis Mach. Intell.48, 3801–3818, DOI: 10.1109/TPAMI.2025.3639593 (2026). 18.Kondepudi, A.et al.Health system learning achieves generalist neuroimaging models (2025). 2511.18640
-
[15]
Medicine30, 2924–2935, DOI: 10.1038/s41591-024-03141-0 (2024)
V orontsov, E.et al.A foundation model for clinical-grade computational pathology and rare cancers detection.Nat. Medicine30, 2924–2935, DOI: 10.1038/s41591-024-03141-0 (2024)
-
[16]
J.et al.Towards a general-purpose foundation model for computational pathology.Nat
Chen, R. J.et al.Towards a general-purpose foundation model for computational pathology.Nat. Medicine(2024)
2024
-
[17]
In Linguraru, M
Isensee, F.et al.nnu-net revisited: A call for rigorous validation in 3d medical image segmentation. In Linguraru, M. G.et al.(eds.)Medical Image Computing and Computer Assisted Intervention – MICCAI 2024, 488–498 (Springer Nature Switzerland, Cham, 2024)
2024
-
[18]
InThe Thirteenth International Conference on Learning Representations(2025)
Xu, Z.et al.Specialized foundation models struggle to beat supervised baselines. InThe Thirteenth International Conference on Learning Representations(2025)
2025
-
[19]
URLhttps://doi.org/10.1038/s41592-025-02772-6
Ahlmann-Eltze, C., Huber, W. & Anders, S. Deep-learning-based gene perturbation effect prediction does not yet outperform simple linear baselines.Nat. Methods22, 1657–1661, DOI: 10.1038/s41592-025-02772-6 (2025)
-
[20]
Liu, S.et al.Generalizable deep learning model for early alzheimer’s disease detection from structural mris.Sci. Reports12, 17106, DOI: 10.1038/s41598-022-20674-x (2022). 25.Asadi, M.et al.Mirage the illusion of visual understanding.arXiv preprint arXiv:2603.21687(2026)
-
[21]
In: 2009 IEEE Conference on Computer Vision and Pattern Recognition, pp
Wang, W., Tran, D. & Feiszli, M. What makes training multi-modal classification networks hard? In2020 IEEE/CVF Conference on Computer Vision and Pattern Recognition (CVPR), 12692–12702, DOI: 10.1109/CVPR 42600.2020.01271 (2020)
-
[22]
& Parikh, D.RUBi: reducing unimodal biases for visual question answering(Curran Associates Inc., Red Hook, NY , USA, 2019)
Cadene, R., Dancette, C., Ben-younes, H., Cord, M. & Parikh, D.RUBi: reducing unimodal biases for visual question answering(Curran Associates Inc., Red Hook, NY , USA, 2019)
2019
-
[23]
Pawłowski, M., Wróblewska, A. & Sysko-Roma´nczuk, S. Effective techniques for multimodal data fusion: A comparative analysis.Sensors23, DOI: 10.3390/s23052381 (2023). 29.Liang, P. P. Foundations of multisensory artificial intelligence (2024). 2404.18976
-
[24]
Assembly101: A large-scale multi-view video dataset for understanding procedural activities
Liu, Z.et al.A convnet for the 2020s. In2022 IEEE/CVF Conference on Computer Vision and Pattern Recognition (CVPR), 11966–11976, DOI: 10.1109/CVPR52688.2022.01167 (2022)
-
[25]
Tong, S.et al.Beyond language modeling: An exploration of multimodal pretraining.arXiv preprint arXiv:2603.03276(2026)
arXiv 2026
-
[26]
Lyu, Y .et al.Learning neuroimaging models from health system-scale data.Nat. Biomed. Eng.DOI: 10.1038/s415 51-025-01608-0 (2026). 33.Team, G.et al.Gemini: a family of highly capable multimodal models.arXiv preprint arXiv:2312.11805(2023)
work page internal anchor Pith review Pith/arXiv arXiv doi:10.1038/s415 2026
-
[27]
& Liang, P
Dai, W., Chen, P., Ekbote, C. & Liang, P. P. Qoq-med: Building multimodal clinical foundation models with domain-aware GRPO training. InThe Thirty-ninth Annual Conference on Neural Information Processing Systems (2025)
2025
-
[28]
InThe Thirteenth International Conference on Learning Representations(2025)
Zhou, C.et al.Transfusion: Predict the next token and diffuse images with one multi-modal model. InThe Thirteenth International Conference on Learning Representations(2025). 36.Bai, S.et al.Qwen3-vl technical report (2025). 2511.21631
Pith/arXiv arXiv 2025
-
[29]
InProceedings of the IEEE/CVF International Conference on Computer Vision (ICCV)(2025)
Shukor, M.et al.Scaling laws for native multimodal models. InProceedings of the IEEE/CVF International Conference on Computer Vision (ICCV)(2025)
2025
-
[30]
Oquab, M.et al.DINOv2: Learning robust visual features without supervision.Transactions on Mach. Learn. Res. (2024). Featured Certification
2024
-
[31]
Balestriero, R. & LeCun, Y . Lejepa: Provable and scalable self-supervised learning without the heuristics (2025). 2511.08544
Pith/arXiv arXiv 2025
-
[32]
Maes, L., Lidec, Q. L., Scieur, D., LeCun, Y . & Balestriero, R. Leworldmodel: Stable end-to-end joint-embedding predictive architecture from pixels (2026). 2603.19312
Pith/arXiv arXiv 2026
-
[33]
Jenkinson, M., Beckmann, C. F., Behrens, T. E., Woolrich, M. W. & Smith, S. M. Fsl.NeuroImage62, 782–790, DOI: https://doi.org/10.1016/j.neuroimage.2011.09.015 (2012). 20 YEARS OF fMRI. 22
-
[34]
S., Dalca, A
Hoopes, A., Mora, J. S., Dalca, A. V ., Fischl, B. & Hoffmann, M. SynthStrip: skull-stripping for any brain image. NeuroImage260, 119474 (2022)
2022
-
[35]
Medicine30, 2977–2989, DOI: 10.1038/s41591-024-03118-z (2024)
Xue, C.et al.Ai-based differential diagnosis of dementia etiologies on multimodal data.Nat. Medicine30, 2977–2989, DOI: 10.1038/s41591-024-03118-z (2024)
-
[36]
& Morcos, A
Sorscher, B., Geirhos, R., Shekhar, S., Ganguli, S. & Morcos, A. Beyond neural scaling laws: beating power law scaling via data pruning. In Koyejo, S.et al.(eds.)Advances in Neural Information Processing Systems, vol. 35, 19523–19536 (Curran Associates, Inc., 2022)
2022
-
[37]
In Proceedings of the 37th International Conference on Neural Information Processing Systems, NIPS ’23 (Curran Associates Inc., Red Hook, NY , USA, 2023)
Penedo, G.et al.The refinedweb dataset for falcon llm: outperforming curated corpora with web data only. In Proceedings of the 37th International Conference on Neural Information Processing Systems, NIPS ’23 (Curran Associates Inc., Red Hook, NY , USA, 2023)
2023
-
[38]
InThe Twelfth International Conference on Learning Representations (2024)
Xu, H.et al.Demystifying CLIP data. InThe Twelfth International Conference on Learning Representations (2024)
2024
-
[39]
Apicella, A., Isgrò, F. & Prevete, R. Don’t push the button! exploring data leakage risks in machine learning and transfer learning.Artif. Intell. Rev.58, 339, DOI: 10.1007/s10462-025-11326-3 (2025)
-
[40]
& Ranganath, R
Compton, R., Zhang, L., Puli, A. & Ranganath, R. When more is less: Incorporating additional datasets can hurt performance by introducing spurious correlations. In Deshpande, K.et al.(eds.)Proceedings of the 8th Machine Learning for Healthcare Conference, vol. 219 ofProceedings of Machine Learning Research, 110–127 (PMLR, 2023)
2023
-
[41]
Image Analysis63, 101694, DOI: https://doi.org/10.1016/j.media.2020.101694 (2020)
Wen, J.et al.Convolutional neural networks for classification of alzheimer’s disease: Overview and reproducible evaluation.Med. Image Analysis63, 101694, DOI: https://doi.org/10.1016/j.media.2020.101694 (2020)
-
[42]
DeGrave, A. J., Janizek, J. D. & Lee, S.-I. Ai for radiographic covid-19 detection selects shortcuts over signal.Nat. Mach. Intell.3, 610–619, DOI: 10.1038/s42256-021-00338-7 (2021). 51.Samala, R. K., Chan, H.-P., Hadjiiski, L. & Helvie, M. A. Risks of feature leakage and sample size dependencies in deep feature extraction for breast mass classification.M...
-
[43]
Medicine2, 99, DOI: 10.1038/s41746-019-0178-x (2019)
Chaibub Neto, E.et al.Detecting the impact of subject characteristics on machine learning-based diagnostic applications.npj Digit. Medicine2, 99, DOI: 10.1038/s41746-019-0178-x (2019)
-
[44]
https://www.medrxiv.org/content/earl y/2025/10/02/2025.10.01.25337054.full.pdf
Maschke, C.et al.The brain imaging and neurophysiology database: Binding multimodal neural data into a large-scale repository.medRxivDOI: 10.1101/2025.10.01.25337054 (2025). https://www.medrxiv.org/content/earl y/2025/10/02/2025.10.01.25337054.full.pdf
-
[45]
https://huggingface.co/ContactDoctor/Bio-Medical-Llama-3-8B (2024)
Contactdoctor-bio-medical: A high-performance biomedical language model. https://huggingface.co/ContactDoctor/Bio-Medical-Llama-3-8B (2024)
2024
-
[46]
Psychiatry19, 659–667, DOI: 10.1038/mp.2013.78 (2014)
Di Martino, A.et al.The autism brain imaging data exchange: towards a large-scale evaluation of the intrinsic brain architecture in autism.Mol. Psychiatry19, 659–667, DOI: 10.1038/mp.2013.78 (2014). 56.Bellec, P.et al.The neuro bureau ADHD-200 preprocessed repository.Neuroimage144, 275–286 (2016)
-
[47]
C.et al.Alzheimer’s disease neuroimaging initiative (ADNI): clinical characterization.Neurology74, 201–209 (2009)
Petersen, R. C.et al.Alzheimer’s disease neuroimaging initiative (ADNI): clinical characterization.Neurology74, 201–209 (2009)
2009
-
[48]
Data10, 548, DOI: 10.1038/s41597-023-02457-9 (2023)
Liu, C.-F.et al.A large public dataset of annotated clinical mris and metadata of patients with acute stroke.Sci. Data10, 548, DOI: 10.1038/s41597-023-02457-9 (2023)
-
[49]
O.et al.The mayo clinic study of aging: design and sampling, participation, baseline measures and sample characteristics.Neuroepidemiology30, 58–69 (2008)
Roberts, R. O.et al.The mayo clinic study of aging: design and sampling, participation, baseline measures and sample characteristics.Neuroepidemiology30, 58–69 (2008)
2008
-
[50]
L.et al.The national alzheimer’s coordinating center (NACC) database: The uniform data set.Alzheimer Dis
Beekly, D. L.et al.The national alzheimer’s coordinating center (NACC) database: The uniform data set.Alzheimer Dis. Assoc. Disord.21, 249–258 (2007)
2007
-
[51]
S., Fotenos, A
Marcus, D. S., Fotenos, A. F., Csernansky, J. G., Morris, J. C. & Buckner, R. L. Open access series of imaging studies: longitudinal MRI data in nondemented and demented older adults.J. Cogn. Neurosci.22, 2677–2684 (2010)
2010
-
[52]
The parkinson progression marker initiative (PPMI).Prog
Parkinson Progression Marker Initiative. The parkinson progression marker initiative (PPMI).Prog. Neurobiol.95, 629–635 (2011)
2011
-
[53]
Data11, 839, DOI: 10.1038/s41597-024-03667-5 (2024)
Absher, J.et al.The stroke outcome optimization project: Acute ischemic strokes from a comprehensive stroke center.Sci. Data11, 839, DOI: 10.1038/s41597-024-03667-5 (2024)
-
[54]
J., Durnez, J
Gorgolewski, K. J., Durnez, J. & Poldrack, R. A. Preprocessed consortium for neuropsychiatric phenomics dataset. 23 F1000Res.6, 1262 (2017)
2017
-
[55]
Calabrese, E.et al.The university of california san francisco preoperative diffuse glioma mri (ucsf-pdgm), DOI: 10.7937/tcia.bdgf-8v37 (2022)
-
[56]
Zhu, W.et al.3d foundation model for generalizable disease detection in head computed tomography.Nat. Biomed. Eng.DOI: 10.1038/s41551-026-01668-w (2026)
-
[57]
InProceedings of the International Conference on Computer Vision (ICCV)(2021)
Caron, M.et al.Emerging properties in self-supervised vision transformers. InProceedings of the International Conference on Computer Vision (ICCV)(2021). 68.Siméoni, O.et al.Dinov3 (2025). 2508.10104
Pith/arXiv arXiv 2021
-
[58]
Terver, B., Yang, T.-Y ., Ponce, J., Bardes, A. & LeCun, Y . What drives success in physical planning with joint-embedding predictive world models? (2026). 2512.24497. 70.Munim, A.et al.Echojepa: A latent predictive foundation model for echocardiography (2026). 2602.02603
Pith/arXiv arXiv 2026
-
[59]
In Globerson, A.et al.(eds.)Advances in Neural Information Processing Systems, vol
Dong, Z.et al.Brain-jepa: Brain dynamics foundation model with gradient positioning and spatiotemporal masking. In Globerson, A.et al.(eds.)Advances in Neural Information Processing Systems, vol. 37, 86048–86073, DOI: 10.52202/079017-2732 (Curran Associates, Inc., 2024)
-
[60]
Su, J. A journey through moe: 5. reflections on uniform distribution. https://kexue.fm/archives/10945 (2025). Accessed 2026-03-25. 73.Team, K.et al.Kimi k2: Open agentic intelligence (2026). 2507.20534
Pith/arXiv arXiv 2025
-
[61]
Guo, D.et al.Deepseek-r1 incentivizes reasoning in llms through reinforcement learning.Nature645, 633–638, DOI: 10.1038/s41586-025-09422-z (2025)
-
[62]
Wang, L., Gao, H., Zhao, C., Sun, X. & Dai, D. Auxiliary-loss-free load balancing strategy for mixture-of-experts (2024). 2408.15664
Pith/arXiv arXiv 2024
-
[63]
Nam, H., Lidec, Q. L., Maes, L., LeCun, Y . & Balestriero, R. Causal-jepa: Learning world models through object-level latent interventions (2026). 2602.11389
Pith/arXiv arXiv 2026
-
[64]
Assembly101: A large-scale multi-view video dataset for understanding procedural activities
Tang, Y .et al.Self-supervised pre-training of swin transformers for 3d medical image analysis. In2022 IEEE/CVF Conference on Computer Vision and Pattern Recognition (CVPR), 20698–20708, DOI: 10.1109/CVPR52688.2022 .02007 (2022)
-
[65]
& Hinton, G
Chen, T., Kornblith, S., Norouzi, M. & Hinton, G. A simple framework for contrastive learning of visual representations. In III, H. D. & Singh, A. (eds.)Proceedings of the 37th International Conference on Machine Learning, vol. 119 ofProceedings of Machine Learning Research, 1597–1607 (PMLR, 2020)
2020
-
[66]
FlashAttention-2: Faster attention with better parallelism and work partitioning
Dao, T. FlashAttention-2: Faster attention with better parallelism and work partitioning. InInternational Conference on Learning Representations (ICLR)(2024)
2024
-
[67]
P.et al.Quantifying & modeling multimodal interactions: An information decomposition framework
Liang, P. P.et al.Quantifying & modeling multimodal interactions: An information decomposition framework. In Thirty-seventh Conference on Neural Information Processing Systems(2023)
2023
-
[68]
& Jurie, F
Pérez-Rúa, J.-M., Vielzeuf, V ., Pateux, S., Baccouche, M. & Jurie, F. Mfas: Multimodal fusion architecture search. InProceedings of the IEEE Conference on Computer Vision and Pattern Recognition, 6966–6975 (2019)
2019
-
[69]
Madaan, D., Makino, T., Chopra, S. & Cho, K. Jointly modeling inter- & intra-modality dependencies for multi-modal learning. InThe Thirty-eighth Annual Conference on Neural Information Processing Systems(2024). 83.Hoffmann, J.et al.Training compute-optimal large language models (2022). 2203.15556
Pith/arXiv arXiv 2024
-
[70]
& Song, J
Pearce, T. & Song, J. Reconciling kaplan and chinchilla scaling laws.Transactions on Mach. Learn. Res.(2024). Reproducibility Certification
2024
-
[71]
InThe Thirteenth International Conference on Learning Representations (2025)
Kumar, T.et al.Scaling laws for precision. InThe Thirteenth International Conference on Learning Representations (2025)
2025
-
[72]
Hinton, G. E. Training products of experts by minimizing contrastive divergence.Neural Comput.14, 1771–1800, DOI: 10.1162/089976602760128018 (2002)
-
[73]
Isensee, F., Jaeger, P. F., Kohl, S. A. A., Petersen, J. & Maier-Hein, K. H. nnu-net: a self-configuring method for deep learning-based biomedical image segmentation.Nat. Methods18, 203–211, DOI: 10.1038/s41592-020-01008-z (2021)
-
[74]
Commun.15, 654, DOI: 10.1038/s41467-024-44824-z (2024)
Ma, J.et al.Segment anything in medical images.Nat. Commun.15, 654, DOI: 10.1038/s41467-024-44824-z (2024)
-
[75]
Methods22, 166–176, DOI: 10.1038/s41592-024-02499-w (2025)
Zhao, T.et al.A foundation model for joint segmentation, detection and recognition of biomedical objects across nine modalities.Nat. Methods22, 166–176, DOI: 10.1038/s41592-024-02499-w (2025). 24
-
[76]
Live: Learning video llm with stream- ing speech transcription at scale
He, Y .et al.Vista3d: A unified segmentation foundation model for 3d medical imaging. In2025 IEEE/CVF Conference on Computer Vision and Pattern Recognition (CVPR), 20863–20873, DOI: 10.1109/CVPR52734.2025 .01943 (2025). 91.Asadi, M.et al.Mirage: The illusion of visual understanding (2026). 2603.21687
-
[77]
Madaan, D., Muhunthan, V ., Cho, K. & Chopra, S. Multi-modal data spectrum: Multi-modal datasets are multi-dimensional. InThe Fourteenth International Conference on Learning Representations(2026). 25 Appendix Contents References 21 A Dataset Details 27 A.1 Pretrain Data Demographics . . . . . . . . . . . . . . . . . . . . . . . . . . . . . . . . . . . . ....
arXiv 2026
discussion (0)
Sign in with ORCID, Apple, or X to comment. Anyone can read and Pith papers without signing in.