REVIEW 2 major objections 2 minor 87 references
Only Class II disks with substructures in Ophiuchus exhibit a steeper millimeter size-luminosity relation than smooth disks.
Reviewed by Pith at T0; open to challenge. T0 means a machine referee read the full paper against a public rubric. the ladder, T0–T4 →
T0 review · grok-4.3
2026-06-26 19:41 UTC pith:2KMTIBLY
load-bearing objection The paper's main result is that the size-luminosity slope reaches 0.8 only for Class II disks with substructures while staying near 0.4-0.5 elsewhere, but this split rests on substructure detection whose robustness is not quantified in the abstract. the 2 major comments →
ALMA 2D super-resolution imaging survey of Ophiuchus Class I/flat spectrum/II disks. II. Statistical analysis of stellar and disk properties
The pith
A machine-rendered reading of the paper's core claim, the machinery that carries it, and where it could break.
Core claim
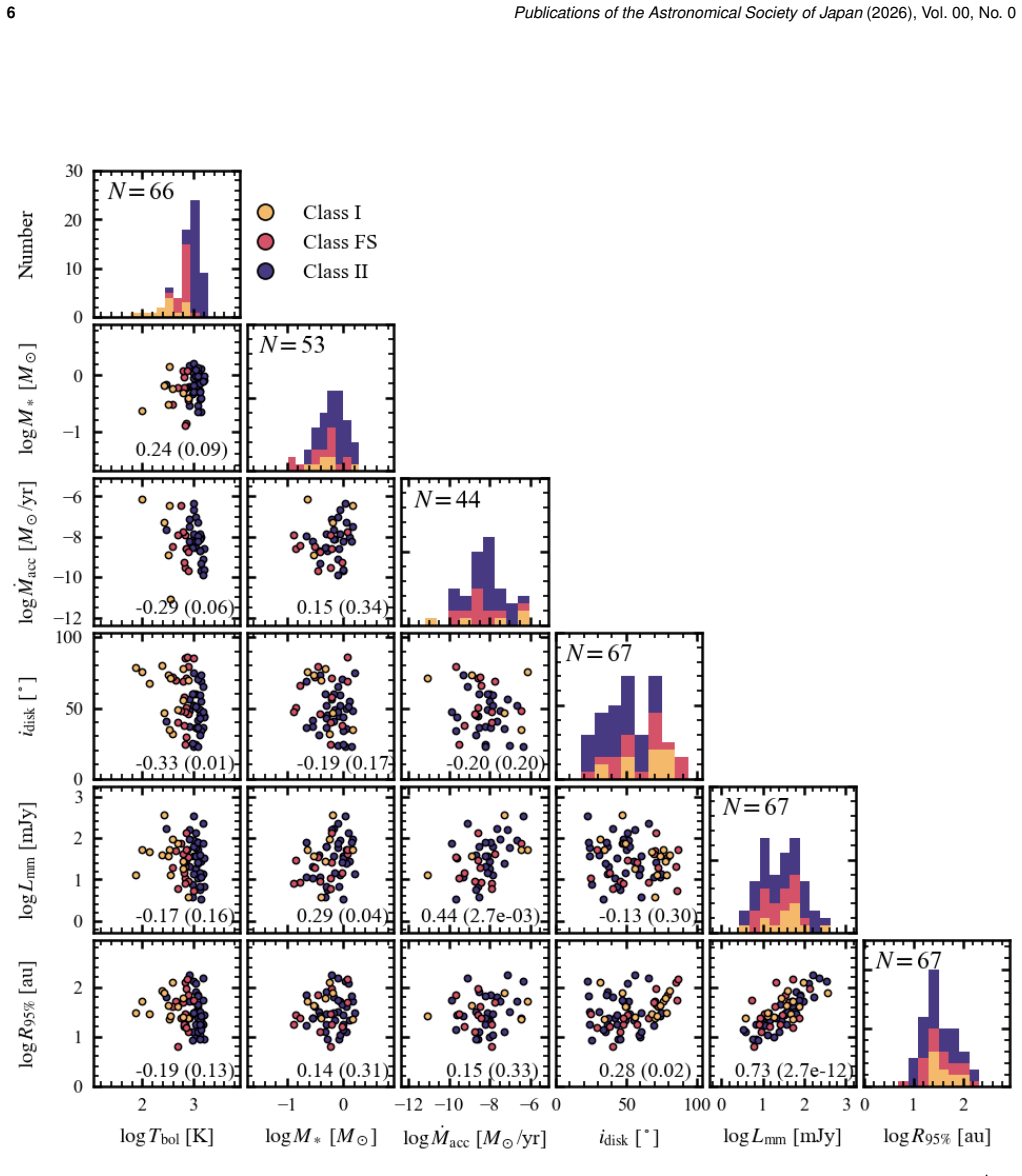
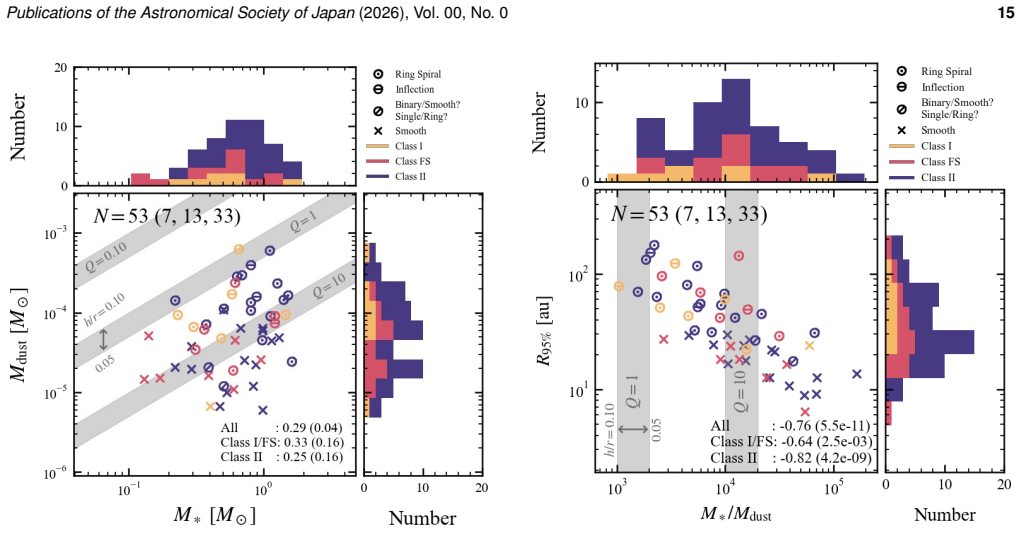
The analysis of 67 systems with robust dust-radius measurements shows a tight size-luminosity relation between R95% and Lmm. Only the Class II disks that contain detectable substructures obey the steeper scaling R95% ∝ Lmm^0.8, whereas Class I/flat-spectrum disks and Class II disks without substructures remain consistent with R95% ∝ Lmm^0.4-0.5. This difference is described as qualitatively consistent with disk evolution models in which planet-induced pressure bumps produce a steeper size-luminosity relation than smooth disks.
What carries the argument
The size-luminosity relation R95%-Lmm differentiated by evolutionary stage (Class I/FS versus Class II) and by the presence or absence of substructures in the super-resolution images.
Load-bearing premise
The substructures identified in the super-resolution images are genuine physical features rather than reconstruction artifacts, and the sample of 67 systems is representative without strong selection bias in substructure detection or radius measurement.
What would settle it
A re-analysis of the same ALMA data using conventional imaging that fails to recover the substructures, yet still finds the steeper R95%-Lmm relation confined to the Class II group, would undermine the claimed link between substructures and the steeper scaling.
If this is right
- Substructures occur preferentially in relatively massive and extended disks.
- Disk substructures play an important role in shaping the evolution of dust and global disk properties.
- The results supply empirical constraints on accretion, dust trapping, and possible gravitational instability in young disks.
- The observed scaling behavior supports models in which planet-induced pressure bumps produce steeper size-luminosity relations for structured disks.
Where Pith is reading between the lines
- If the steeper relation traces planet-induced bumps, planet formation must begin to alter global disk structure by the Class II stage.
- Surveys of additional star-forming regions could test whether the same subsample-dependent scaling appears outside Ophiuchus.
- Disks that already show substructures may be the ones most likely to retain dust long enough for further planet growth.
Editorial analysis
A structured set of objections, weighed in public.
Referee Report
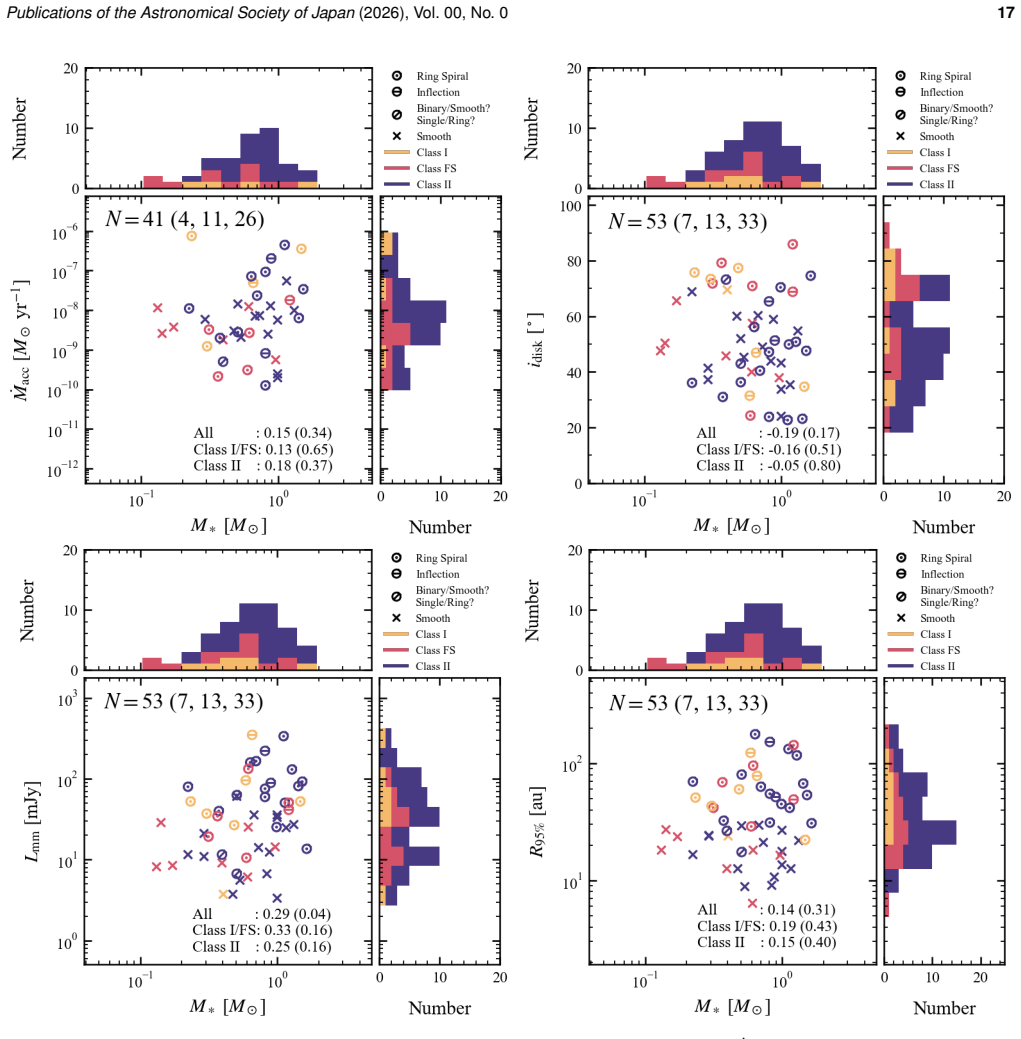
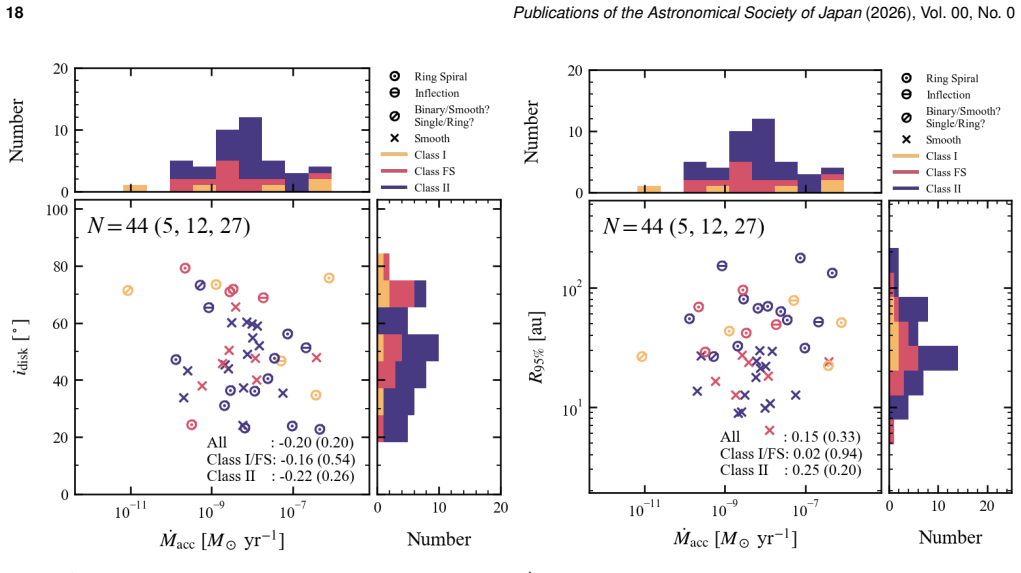
Summary. The manuscript presents a statistical analysis of stellar and disk properties for 67 Ophiuchus YSOs (Class I/FS and Class II), using 2D super-resolution PRIISM imaging of ALMA Band 6 archival data. It reports pairwise correlations among T_bol, M_*, \dot{M}_acc, i_disk, L_mm, and R_95%, identifies substructure preferences in more massive and extended disks, and finds a size-luminosity relation R_95% ∝ L_mm^α that is steeper (α ≈ 0.8) only for Class II disks with substructures while other subsamples follow α ≈ 0.4-0.5, qualitatively matching models with planet-induced pressure bumps.
Significance. If the substructure classifications hold, the result supplies empirical evidence that substructures shape global disk evolution, dust trapping, and accretion, offering testable constraints on disk models. The expanded sample from super-resolved archival data and the evolutionary-stage partitioning are strengths for the field.
major comments (2)
- [Abstract and substructure classification section] Abstract and the section describing substructure identification: the headline distinction in size-luminosity slopes (0.8 vs 0.4-0.5) is load-bearing for the central claim yet rests on visual/algorithmic classification of features in the PRIISM images; the manuscript provides no quantitative false-positive rate or end-to-end simulations matched to the actual uv-coverage and noise of the archival observations, leaving open the possibility that reconstruction artifacts drive the reported difference.
- [Results on size-luminosity relation] The reporting of the power-law fits (abstract and results section): the scalings are stated without uncertainties on the exponents, p-values, covariance between variables, or assessment of how the post-hoc subsample definitions affect the fits, so it is not possible to evaluate whether the slope difference is statistically significant.
minor comments (2)
- [Throughout] Notation for R_95% and L_mm should be checked for consistency across text, tables, and figures.
- [Sample description] The sample selection criteria and any luminosity or inclination biases in substructure detection should be stated more explicitly.
Simulated Author's Rebuttal
We thank the referee for the constructive comments on our manuscript. We address each major point below and outline the revisions we will make.
read point-by-point responses
-
Referee: [Abstract and substructure classification section] Abstract and the section describing substructure identification: the headline distinction in size-luminosity slopes (0.8 vs 0.4-0.5) is load-bearing for the central claim yet rests on visual/algorithmic classification of features in the PRIISM images; the manuscript provides no quantitative false-positive rate or end-to-end simulations matched to the actual uv-coverage and noise of the archival observations, leaving open the possibility that reconstruction artifacts drive the reported difference.
Authors: We acknowledge that the current manuscript does not present a dedicated quantitative false-positive analysis or end-to-end simulations matched to the specific archival uv-coverage and noise properties. The substructure classification builds directly on the validation performed in the companion Paper I (Shoshi et al. 2025b), where PRIISM was tested on simulated data; however, those tests were not tailored to every archival dataset here. We will add a dedicated subsection in the revised manuscript discussing the robustness of the classification, including a qualitative assessment of possible artifacts and why a systematic bias confined to the Class II substructured subsample is unlikely given the uniform imaging pipeline. If feasible within the revision timeline, we will also include targeted injection-recovery tests on a subset of the data. revision: partial
-
Referee: [Results on size-luminosity relation] The reporting of the power-law fits (abstract and results section): the scalings are stated without uncertainties on the exponents, p-values, covariance between variables, or assessment of how the post-hoc subsample definitions affect the fits, so it is not possible to evaluate whether the slope difference is statistically significant.
Authors: We agree that the power-law fits require fuller statistical reporting to allow evaluation of significance. In the revised manuscript we will (i) report uncertainties on the fitted exponents, (ii) provide p-values and goodness-of-fit metrics, (iii) discuss covariance between R_95% and L_mm, and (iv) assess the effect of the post-hoc subsample definitions via bootstrap resampling or similar methods. These additions will be placed in the results section and referenced in the abstract. revision: yes
Circularity Check
Pure observational correlation study with no circular derivations
full rationale
This is an empirical statistical analysis of measured quantities (R_95%, L_mm, substructure presence) extracted from ALMA archival data via PRIISM imaging in the cited prior paper. The reported power-law indices (0.8 vs 0.4-0.5) are obtained by direct fitting to partitioned observational data; no equation, prediction, or central claim reduces by construction to a parameter fitted in the present work or to a self-citation that defines the target result. The self-citation supplies the input catalog but does not create a definitional loop or force the reported slopes. The analysis is therefore self-contained against external benchmarks.
Axiom & Free-Parameter Ledger
free parameters (1)
- size-luminosity scaling exponent
axioms (1)
- domain assumption PRIISM super-resolution imaging recovers true dust radii and correctly flags substructures in ALMA Band 6 data
read the original abstract
We present a statistical study of stellar and dust disk properties for young stellar objects in the Ophiuchus star-forming region. Building on our previous paper (Shoshi et al. 2025b), which applied two-dimensional super-resolution imaging with PRIISM to ALMA archival Band 6 continuum data and spatially resolved 78 disks, we analyze a sample of 67 systems with robust dust-radius measurements. We combine stellar parameters from the literature, including bolometric temperature $T_{\rm bol}$, stellar mass $M_\ast$, and mass accretion rate $\dot{M}_{\rm acc}$, with disk parameters derived from the super-resolution images, including inclination $i_{\rm disk}$, millimeter luminosity $L_{\rm mm}$, and dust radius $R_{95\%}$. We quantify pairwise correlations and compare their behavior across evolutionary stages (Class I/FS and Class II) and between disks with and without detectable substructures. We identify substructure dependencies in $L_{\rm mm}$ and $R_{95\%}$, indicating that substructures tend to be found preferentially in relatively massive and extended disks. Moreover, we find a tight size-luminosity relation between $R_{95\%}$ and $L_{\rm mm}$. In particular, only Class II disks with substructures exhibit a steeper scaling, $R_{95\%}\propto L_{\rm mm}^{0.8}$, while the other subsamples are broadly consistent with $R_{95\%}\propto L_{\rm mm}^{0.4\text{-}0.5}$. This behavior is qualitatively consistent with disk evolution models in which disks with planet-induced pressure bumps follow a steeper size-luminosity relation than smooth disks. Overall, our results suggest that disk substructures play an important role in shaping the evolution of dust and global disk properties, while providing empirical constraints on accretion, dust trapping, and possible gravitational instability in young disks.
Figures





Reference graph
Works this paper leans on
-
[1]
L., Pérez, L
ALMA Partnership, Brogan, C. L., Pérez, L. M., et al. 2015, ApJL, 808, L3
2015
-
[2]
P., van der Marel, N., et al
Ansdell, M., Williams, J. P., van der Marel, N., et al. 2016, ApJ, 828, 46 Astropy Collaboration, Price-Whelan, A. M., Lim, P. L., et al. 2022, ApJ, 935, 167
2016
-
[3]
A., Carpenter, J
Barenfeld, S. A., Carpenter, J. M., Sargent, A. I., Isella, A., & Ricci, L. 2017, ApJ, 851, 85
2017
-
[4]
Beckwith, S. V . W., Sargent, A. I., Chini, R. S., & Guesten, R. 1990, AJ, 99, 924
1990
-
[5]
Bhowmik, T., Cieza, L., Miley, J. M., et al. 2026, arXiv e-prints, arXiv:2604.19246
work page internal anchor Pith review Pith/arXiv arXiv 2026
-
[6]
M., van der Marel, N., & Mulders, G
Bosschaart, Q., Guerra-Alvarado, O. M., van der Marel, N., & Mulders, G. D. 2026, A&A, 708, A143 CASA Team, Bean, B., Bhatnagar, S., et al. 2022, PASP, 134, 114501
2026
-
[7]
F., Liu, H
Cazzoletti, P., Manara, C. F., Liu, H. B., et al. 2019, A&A, 626, A11
2019
-
[8]
C., Ladd, E
Chen, H., Myers, P. C., Ladd, E. F., & Wood, D. O. S. 1995, ApJ, 445, 377
1995
-
[9]
E., Hirano, N., & Yamaguchi, M
Chou, H.-I. E., Hirano, N., & Yamaguchi, M. 2025, ApJ, 995, 225
2025
-
[10]
A., Schreiber, M
Cieza, L. A., Schreiber, M. R., Romero, G. A., et al. 2010, ApJ, 712, 925
2010
-
[11]
A., Ruíz-Rodríguez, D., Hales, A., et al
Cieza, L. A., Ruíz-Rodríguez, D., Hales, A., et al. 2019, MNRAS, 482, 698
2019
-
[12]
A., González-Ruilova, C., Hales, A
Cieza, L. A., González-Ruilova, C., Hales, A. S., et al. 2021, MNRAS, 501, 2934
2021
-
[13]
A., González-Ruilova, C., et al
Dasgupta, A., Cieza, L. A., González-Ruilova, C., et al. 2025, ApJL, 981, L4
2025
-
[14]
2015, ApJ, 809, 93
Dong, R., Zhu, Z., & Whitney, B. 2015, ApJ, 809, 93
2015
-
[15]
M., Allen, L
Dunham, M. M., Allen, L. E., Evans, II, N. J., et al. 2015, ApJS, 220, 11
2015
-
[16]
H., Boss, A
Durisen, R. H., Boss, A. P., Mayer, L., et al. 2007, in Protostars and Planets V , ed. B. Reipurth, D. Jewitt, & K. Keil, 607
2007
-
[17]
L., & Luhman, K
Esplin, T. L., & Luhman, K. L. 2020, AJ, 159, 282
2020
-
[18]
J., Dunham, M
Evans, II, N. J., Dunham, M. M., Jørgensen, J. K., et al. 2009, ApJS, 181, 321
2009
-
[19]
F., et al
Fiorellino, E., Tychoniec, Ł., Manara, C. F., et al. 2022, ApJL, 937, L9
2022
-
[20]
S., Reipurth, B., & Duchêne, G
Flores, C., Connelley, M. S., Reipurth, B., & Duchêne, G. 2022, ApJ, 925, 21
2022
-
[21]
J., et al
Flores, C., Ohashi, N., Tobin, J. J., et al. 2023, ApJ, 958, 98
2023
-
[22]
M., McClure, M
Furlan, E., Watson, D. M., McClure, M. K., et al. 2009, ApJ, 703, 1964
2009
-
[23]
J., Ali, B., et al
Furlan, E., Fischer, W. J., Ali, B., et al. 2016, ApJS, 224, 5 Gaia Collaboration, Brown, A. G. A., Vallenari, A., et al. 2018, A&A, 616, A1 Gaia Collaboration, Vallenari, A., Brown, A. G. A., et al. 2023, A&A, 674, A1
2016
-
[24]
P., Wilking, B
Greene, T. P., Wilking, B. A., Andre, P., Young, E. T., & Lada, C. J. 1994, ApJ, 434, 614
1994
-
[25]
M., van der Marel, N., Williams, J
Guerra-Alvarado, O. M., van der Marel, N., Williams, J. P., et al. 2025, A&A, 696, A232
2025
-
[26]
R., Millman, K
Harris, C. R., Millman, K. J., van der Walt, S. J., et al. 2020, Nature, 585, 357
2020
-
[27]
2020, ApJ, 895, 126
Hendler, N., Pascucci, I., Pinilla, P., et al. 2020, ApJ, 895, 126
2020
-
[28]
G., Maureira, M
Hsieh, C.-H., Arce, H. G., Maureira, M. J., et al. 2025, A&A, 700, A235
2025
-
[29]
M., Dullemond, C
Huang, J., Andrews, S. M., Dullemond, C. P., et al. 2018, ApJL, 869, L42
2018
-
[30]
Hunter, J. D. 2007, Computing in Science and Engineering, 9, 90
2007
-
[31]
D., Huang, J., Czekala, I., et al
Jiang, S. D., Huang, J., Czekala, I., et al. 2026, arXiv e-prints, arXiv:2601.18884
-
[32]
S., Mac Low, M.-M., et al
Johansen, A., Oishi, J. S., Mac Low, M.-M., et al. 2007, Nature, 448, 1022
2007
-
[33]
2009, ApJ, 697, 1269
Johansen, A., Youdin, A., & Klahr, H. 2009, ApJ, 697, 1269
2009
-
[34]
D., Muto, T., Tanaka, H., et al
Kanagawa, K. D., Muto, T., Tanaka, H., et al. 2016, PASJ, 68, 43 20Publications of the Astronomical Society of Japan(2026), Vol. 00, No. 0
2016
-
[35]
Kelly, B. C. 2007, ApJ, 665, 1489
2007
-
[36]
J., Hartmann, L
Kenyon, S. J., Hartmann, L. W., Strom, K. M., & Strom, S. E. 1990, AJ, 99, 869
1990
-
[37]
2016, ARA&A, 54, 271
Kratter, K., & Lodato, G. 2016, ARA&A, 54, 271
2016
-
[38]
2022, A&A, 668, A175
Liu, Y ., Linz, H., Fang, M., et al. 2022, A&A, 668, A175
2022
-
[39]
J., Harsono, D., et al
Long, F., Herczeg, G. J., Harsono, D., et al. 2019, ApJ, 882, 49
2019
-
[40]
F., Mordasini, C., Testi, L., et al
Manara, C. F., Mordasini, C., Testi, L., et al. 2019, A&A, 631, L2
2019
-
[41]
F., Testi, L., Natta, A., & Alcalá, J
Manara, C. F., Testi, L., Natta, A., & Alcalá, J. M. 2015, A&A, 579, A66
2015
-
[42]
F., Rosotti, G., Testi, L., et al
Manara, C. F., Rosotti, G., Testi, L., et al. 2016, A&A, 591, L3
2016
-
[43]
2000, ApJ, 531, 350
Masunaga, H., & Inutsuka, S.-i. 2000, ApJ, 531, 350
2000
-
[44]
J., Pineda, J
Maureira, M. J., Pineda, J. E., Liu, H. B., et al. 2024, A&A, 689, L5
2024
-
[45]
K., Furlan, E., Manoj, P., et al
McClure, M. K., Furlan, E., Manoj, P., et al. 2010, ApJS, 188, 75
2010
-
[46]
Michel, A., van der Marel, N., & Matthews, B. C. 2021, ApJ, 921, 72
2021
-
[47]
F., & Bruderer, S
Miotello, A., Facchini, S., van Dishoeck, E. F., & Bruderer, S. 2018, A&A, 619, A113
2018
-
[48]
2011, ApJ, 726, 46
Nakamura, F., Kamada, Y ., Kamazaki, T., et al. 2011, ApJ, 726, 46
2011
-
[49]
2020, PRIISM: Python module for Radio Interferometry Imaging with Sparse Modeling, Astrophysics Source Code Library, record ascl:2006.002
Nakazato, T., & Ikeda, S. 2020, PRIISM: Python module for Radio Interferometry Imaging with Sparse Modeling, Astrophysics Source Code Library, record ascl:2006.002
2020
-
[50]
2020, in Millimeter, Submillimeter, and Far-Infrared Detectors and Instrumentation for Astronomy X, ed
Nakazato, T., Ikeda, S., Kosugi, G., & Honma, M. 2020, in Millimeter, Submillimeter, and Far-Infrared Detectors and Instrumentation for Astronomy X, ed. J. Zmuidzinas & J.-R. Gao, V ol. 11453, International Society for Optics and Photonics (SPIE), 114532V
2020
-
[51]
2006, A&A, 452, 245
Natta, A., Testi, L., & Randich, S. 2006, A&A, 452, 245
2006
-
[52]
J., Jørgensen, J
Ohashi, N., Tobin, J. J., Jørgensen, J. K., et al. 2023, ApJ, 951, 8
2023
-
[53]
A., Guilera, O., et al
Orcajo, S., Cieza, L. A., Guilera, O., et al. 2025, ApJL, 984, L57 Ortiz-León, G. N., Loinard, L., Dzib, S. A., et al. 2018, ApJL, 869, L33
2025
-
[54]
2020, A&A, 635, A105
Pinilla, P., Pascucci, I., & Marino, S. 2020, A&A, 635, A105
2020
-
[55]
2018, ApJ, 859, 32
Pinilla, P., Tazzari, M., Pascucci, I., et al. 2018, ApJ, 859, 32
2018
-
[56]
P., Booth, R
Rosotti, G. P., Booth, R. A., Tazzari, M., et al. 2019, MNRAS, 486, L63 Ruíz-Rodríguez, D., Ireland, M., Cieza, L., & Kraus, A. 2016, MNRAS, 463, 3829
2019
-
[57]
A., González-Ruilova, C., Cieza, L
Ruiz-Rodriguez, D. A., González-Ruilova, C., Cieza, L. A., et al. 2025, ApJ, 989, 2
2025
-
[58]
J., Fischer, W
Safron, E. J., Fischer, W. J., Megeath, S. T., et al. 2015, ApJL, 800, L5
2015
-
[59]
2020, ApJ, 893, 51
Sai, J., Ohashi, N., Saigo, K., et al. 2020, ApJ, 893, 51
2020
-
[60]
D., & Eisner, J
Sheehan, P. D., & Eisner, J. A. 2017, ApJL, 840, L12 —. 2018, ApJ, 857, 18
2017
-
[61]
D., Tobin, J
Sheehan, P. D., Tobin, J. J., Federman, S., Megeath, S. T., & Looney, L. W. 2020, ApJ, 902, 141
2020
-
[62]
2026, ApJ, 998, 214
Shoshi, A., Yamaguchi, M., Omura, M., et al. 2026, ApJ, 998, 214
2026
-
[63]
2024, ApJ, 961, 228
Shoshi, A., Harada, N., Tokuda, K., et al. 2024, ApJ, 961, 228
2024
-
[64]
Z., & Inutsuka, S.-i
Takahashi, S. Z., & Inutsuka, S.-i. 2016, AJ, 152, 184
2016
-
[65]
J., Testi, L., et al
Tazzari, M., Clarke, C. J., Testi, L., et al. 2021, MNRAS, 506, 2804
2021
-
[66]
2017, A&A, 606, A88
Tazzari, M., Testi, L., Natta, A., et al. 2017, A&A, 606, A88
2017
-
[67]
F., et al
Testi, L., Natta, A., Manara, C. F., et al. 2022, A&A, 663, A98
2022
-
[68]
T., Inutsuka, S.-i., & Takahashi, S
Tominaga, R. T., Inutsuka, S.-i., & Takahashi, S. Z. 2023, ApJ, 953, 60
2023
-
[69]
T., Takahashi, S
Tominaga, R. T., Takahashi, S. Z., & Inutsuka, S.-i. 2020, ApJ, 900, 182
2020
-
[70]
1964, ApJ, 139, 1217
Toomre, A. 1964, ApJ, 139, 1217
1964
-
[71]
M., Birnstiel, T., & Wilner, D
Tripathi, A., Andrews, S. M., Birnstiel, T., & Wilner, D. J. 2017, ApJ, 845, 44
2017
-
[72]
2023, in Astronomical Society of the Pacific Conference Series, V ol
Tsukamoto, Y ., Maury, A., Commercon, B., et al. 2023, in Astronomical Society of the Pacific Conference Series, V ol. 534, Protostars and Planets VII, ed. S. Inutsuka, Y . Aikawa, T. Muto, K. Tomida, & M. Tamura, 317 van der Marel, N., & Mulders, G. D. 2021, AJ, 162, 28 van der Marel, N., van Dishoeck, E. F., Bruderer, S., et al. 2016, A&A, 585, A58
2023
-
[73]
Villenave, M., Ménard, F., Dent, W. R. F., et al. 2021, A&A, 653, A46
2021
-
[74]
R., Duchêne, G., et al
Villenave, M., Stapelfeldt, K. R., Duchêne, G., et al. 2022, ApJ, 930, 11
2022
-
[75]
E., et al
Virtanen, P., Gommers, R., Oliphant, T. E., et al. 2020, Nature Methods, 17, 261
2020
-
[76]
V ., & Jenkins, C
Wall, J. V ., & Jenkins, C. R. 2012, Practical Statistics for Astronomers (Cambridge: Cambridge University Press)
2012
-
[77]
P., Cieza, L., Hales, A., et al
Williams, J. P., Cieza, L., Hales, A., et al. 2019, ApJL, 875, L9
2019
-
[78]
C., Rilinger, A
Xin, Z., Espaillat, C. C., Rilinger, A. M., Ribas, Á., & Macías, E. 2023, ApJ, 942, 4
2023
-
[79]
B., Takami, M., & Gu, P.-G
Yamaguchi, M., Liu, H. B., Takami, M., & Gu, P.-G. 2025, ApJ, 993, 85
2025
-
[80]
2021, ApJ, 923, 121
Yamaguchi, M., Tsukagoshi, T., Muto, T., et al. 2021, ApJ, 923, 121
2021
discussion (0)
Sign in with ORCID, Apple, or X to comment. Anyone can read and Pith papers without signing in.