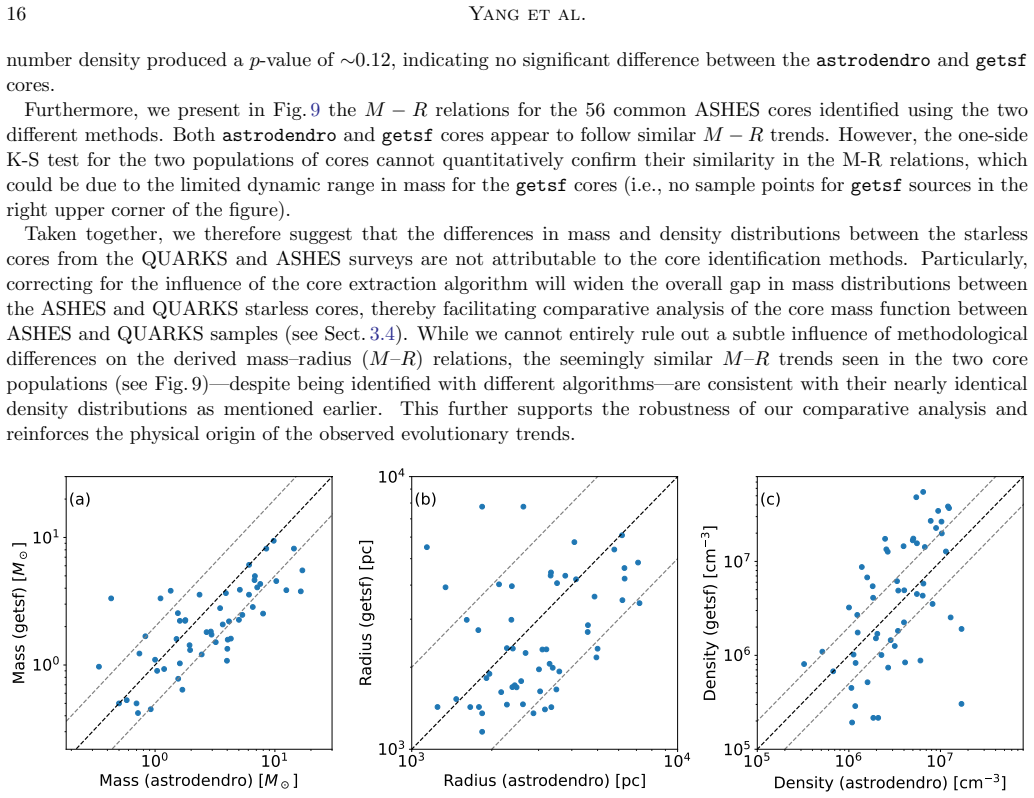
Evolution of starless cores in massive clumps seen by the ALMA ASHES and QUARKS surveys
Pith reviewed 2026-06-26 17:12 UTC · model grok-4.3
The pith
Starless cores in evolved infrared-bright clouds have twice the mass of those in early infrared-dark clouds.
A machine-rendered reading of the paper's core claim, the machinery that carries it, and where it could break.
Core claim
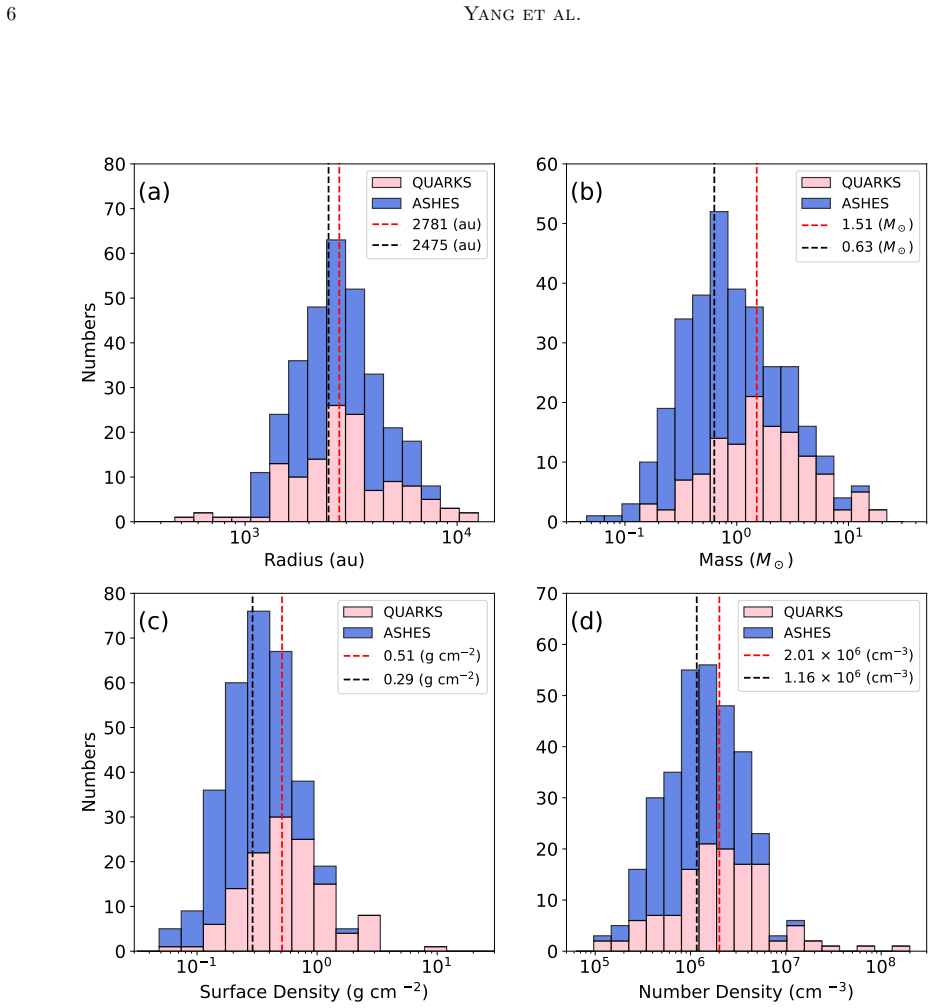
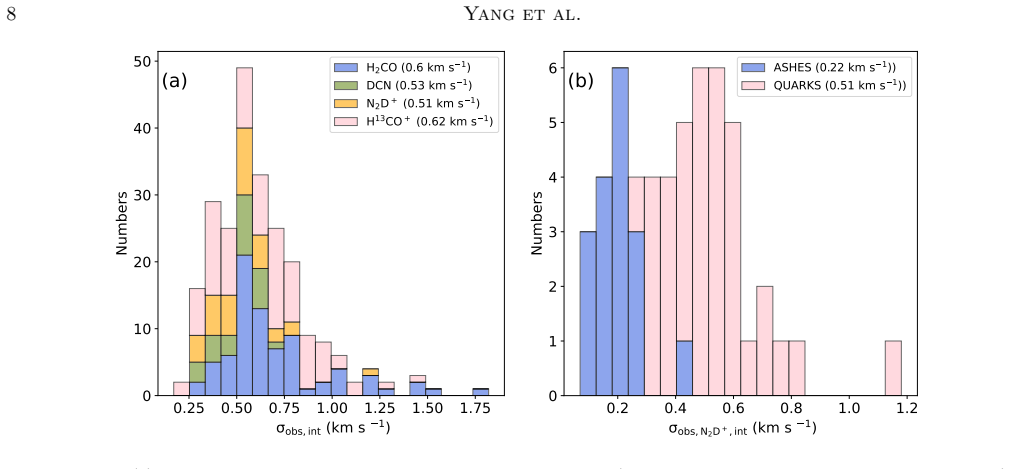
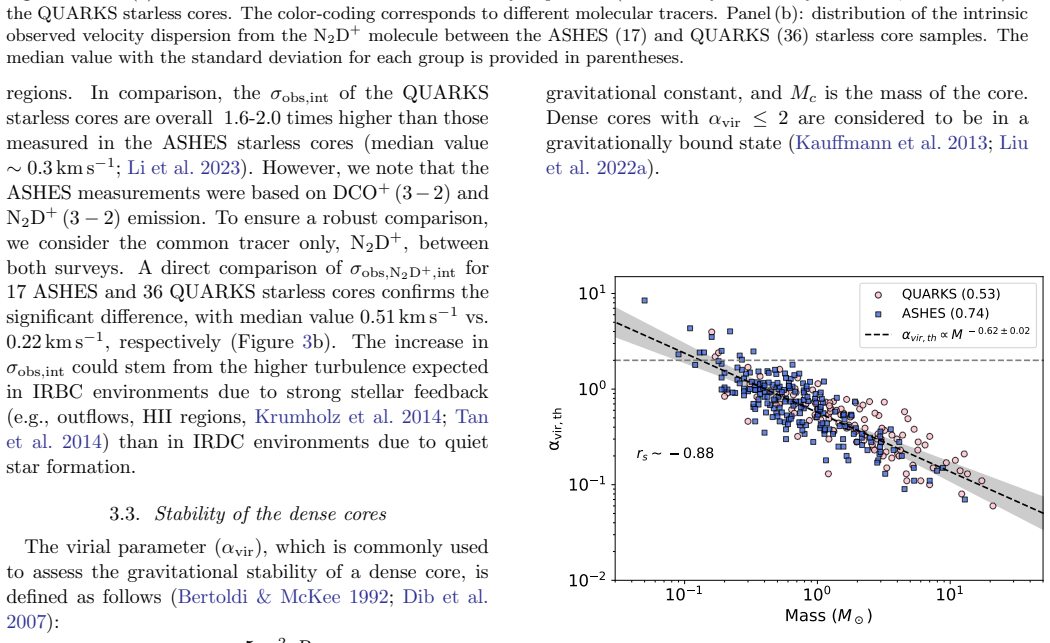
Starless cores in evolved infrared-bright clouds exhibit median masses of 1.5 solar masses versus 0.6 in early infrared-dark clouds, with roughly double the number and surface densities, non-thermal velocity dispersions of 0.5 km/s versus 0.3 km/s, total virial parameters around 2.3 versus 1.0, and steeper density profiles. These differences arise from a combination of new core formation under altered conditions and ongoing dynamical mass growth via accretion from extended reservoirs in feedback-driven, turbulence-enhanced settings.
What carries the argument
Comparative measurement of mass, density, velocity dispersion, virial parameter, and density profile for starless cores across early and evolved stages of massive clumps.
If this is right
- High-mass star formation proceeds via competitive dynamical accretion from reservoirs rather than requiring initially massive prestellar cores.
- New starless cores continue to form even in late-stage infrared-bright environments.
- Core mass growth occurs through accretion in turbulence-enhanced, feedback-active settings.
- Density profiles of cores become steeper and more centrally concentrated as the surrounding clump evolves.
Where Pith is reading between the lines
- Models of high-mass star formation need to allow ongoing core formation and growth across multiple evolutionary phases.
- Matched initial-condition comparisons between cloud samples could isolate evolutionary effects more cleanly.
- Observations at still later stages could test whether core masses stabilize or keep increasing.
Load-bearing premise
Observed differences in core properties between the two samples arise from evolutionary stage rather than selection biases or distinct initial conditions in the clouds.
What would settle it
Detection of starless cores in infrared-bright clouds with masses and densities matching those in infrared-dark clouds, after accounting for survey sensitivity limits, would falsify the evolutionary growth interpretation.
Figures
read the original abstract
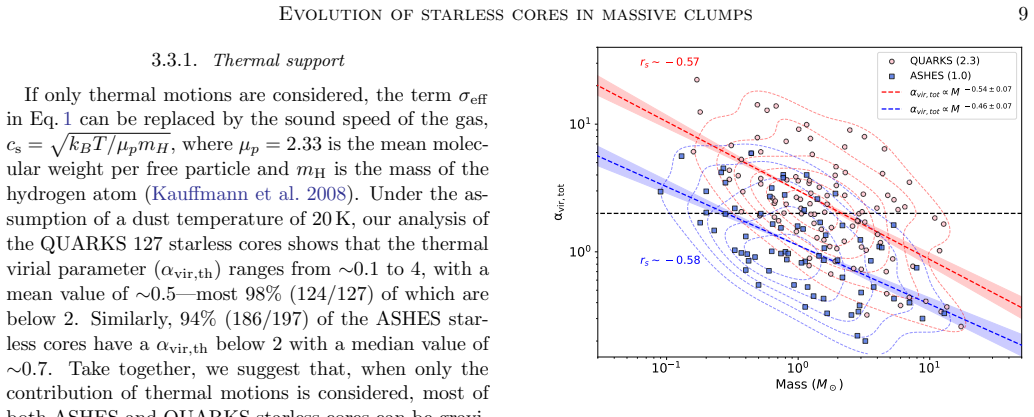
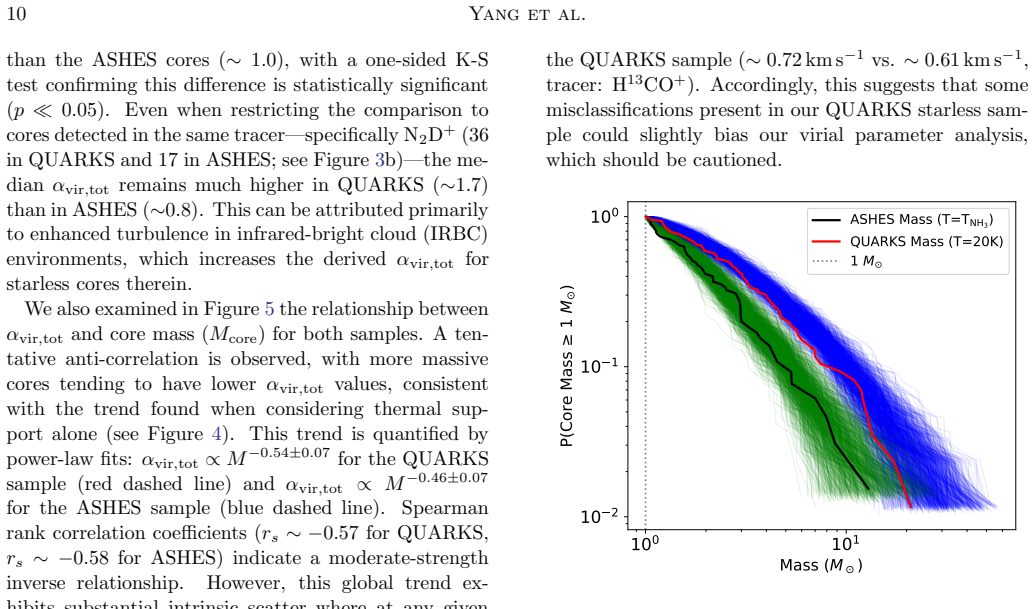
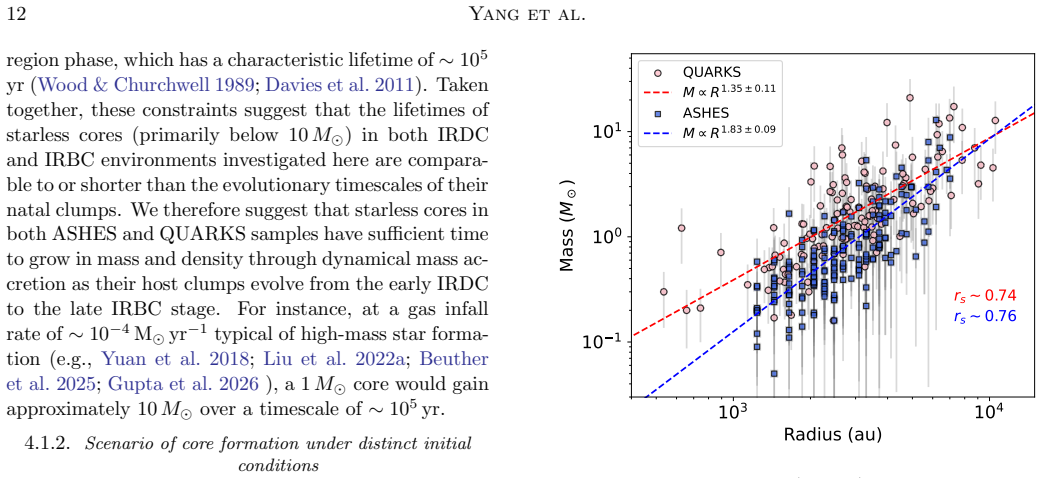
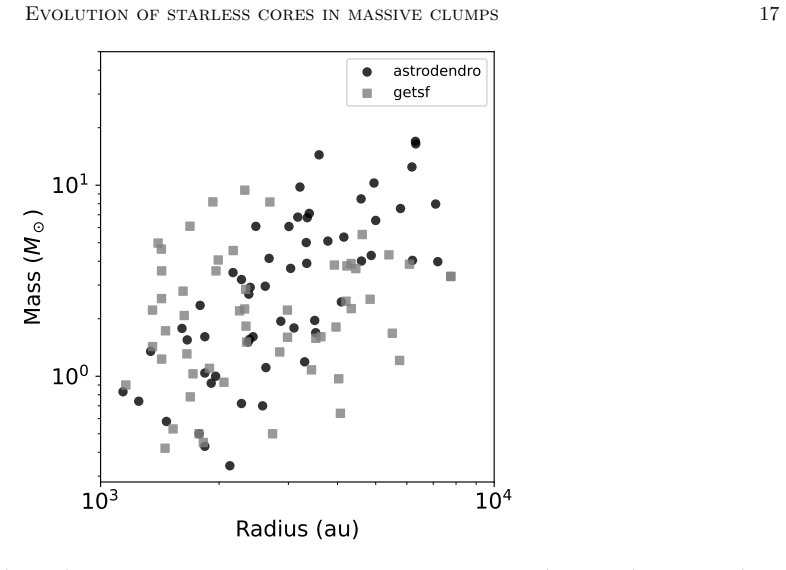
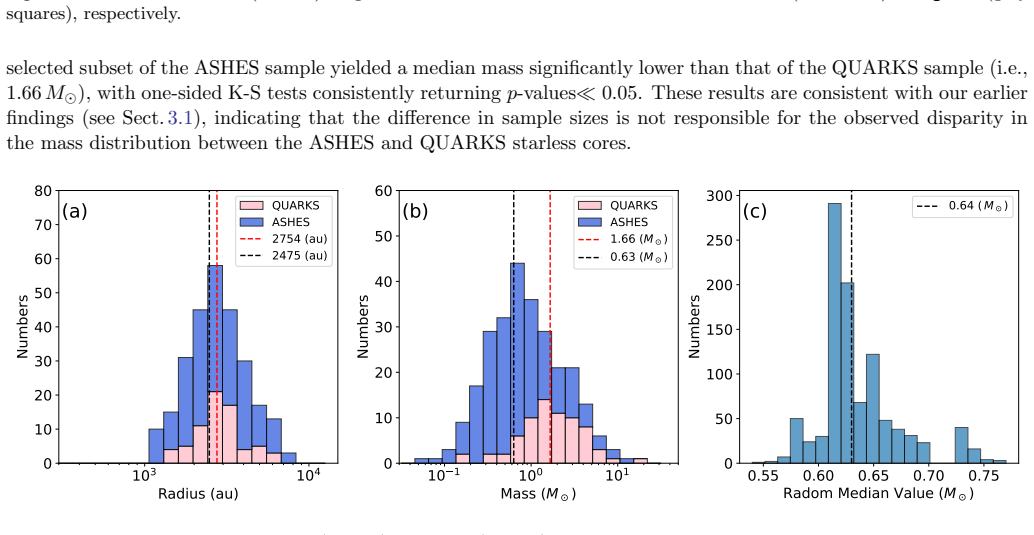
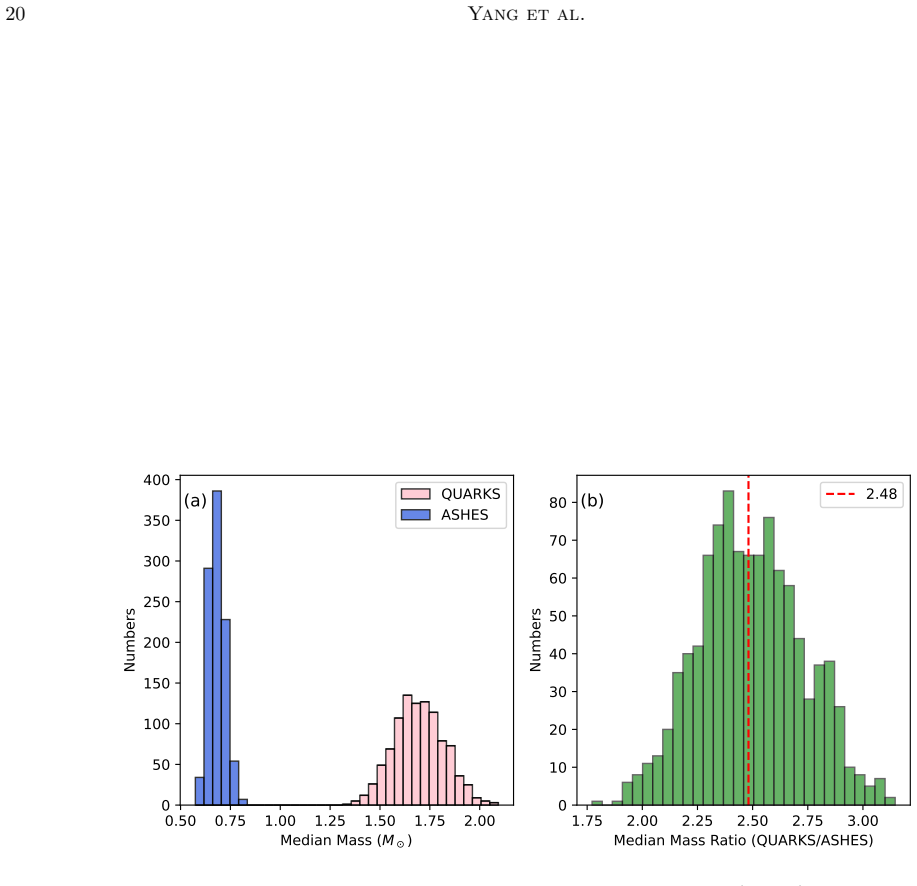
We present a systematic comparative analysis of 324 starless cores in early-phase infrared-dark clouds (IRDCs; ASHES survey) and evolved-phase infrared-bright clouds (IRBCs; QUARKS survey) using 1.3 mm continuum and line data by the Atacama Large Millimeter/submillimeter Array (ALMA). Despite having comparable sizes ($\sim$2500 au),starless cores in IRBCs exhibit systematically higher median mass ($1.5\,M_{\odot}$ vs. $0.6\,M_{\odot}$), number density, and surface density--enhancements of approximately a factor of two relative to starless cores in IRDCs. Starless cores in IRBCs also display relatively stronger non-thermal motions ($\rm\sigma \sim 0.5\,km\,s^{-1}$ vs. $\rm0.3\,km\,s^{-1}$), higher total virial parameters (median $\alpha_{\mathrm{vir,tot}} \sim$ 2.3 vs. 1.0), and steeper density profiles, indicating more centrally concentrated structures in feedback-driven, turbulence-enhanced environments. These findings support a dual evolutionary origin: (i) new core formation in evolved IRBCs under altered initial conditions, and (ii) subsequent dynamical mass growth via accretion from extended reservoirs. The prevalence of low-mass starless cores--even in late-stage IRBC environments--challenges models requiring massive prestellar cores and instead favors competitive-like dynamical mass accretion scenarios for high-mass star formation.
Editorial analysis
A structured set of objections, weighed in public.
Referee Report
Summary. The paper presents a comparative analysis of 324 starless cores detected in ALMA 1.3 mm continuum and line observations from the ASHES survey (early-phase IRDCs) and the QUARKS survey (evolved-phase IRBCs). It reports that cores in IRBCs have systematically higher median mass (1.5 vs. 0.6 M⊙), number density, surface density (factor-of-two enhancements), non-thermal velocity dispersion (0.5 vs. 0.3 km s⁻¹), total virial parameter (median α_vir,tot ~2.3 vs. 1.0), and steeper density profiles despite comparable sizes (~2500 au). The authors interpret these differences as evidence for both new core formation under altered conditions and dynamical mass growth via accretion, supporting competitive-like accretion scenarios for high-mass star formation over models requiring massive prestellar cores.
Significance. If the reported differences can be shown to arise from evolutionary stage rather than unmatched initial conditions or survey-specific selection, the work would supply a statistically substantial observational dataset constraining high-mass star formation pathways, particularly by documenting the continued presence of low-mass starless cores in feedback-active environments. The direct use of two independent ALMA surveys on distinct cloud populations is a methodological strength.
major comments (2)
- [Abstract and §3] Abstract and §3 (results): the reported median masses, densities, and virial parameters are presented without accompanying uncertainties, Kolmogorov-Smirnov or similar statistical tests, or explicit sample selection criteria; the central claim that these constitute a factor-of-two evolutionary enhancement therefore cannot be evaluated for robustness against measurement scatter or detection thresholds.
- [§4 and methods] §4 (discussion) and methods: the interpretation that higher core masses and densities in QUARKS IRBCs indicate later-stage dynamical growth from low-mass seeds is load-bearing, yet the manuscript does not demonstrate that the parent clump mass, turbulence, or density distributions are matched between the ASHES and QUARKS samples, nor does it apply completeness corrections for low-mass cores; without these controls the factor-of-two differences remain vulnerable to initial-condition or sensitivity differences between the two cloud populations.
minor comments (2)
- [Abstract] Abstract: the core size is stated as ~2500 au; clarify whether this is the median, mean, or a characteristic value and provide the corresponding distribution statistic.
- [Throughout] Throughout: ensure uniform notation for velocity dispersion (e.g., consistently use σ_nt or σ) and report the exact temperature assumptions used for mass derivation from 1.3 mm flux.
Simulated Author's Rebuttal
We thank the referee for the constructive comments, which highlight opportunities to strengthen the statistical presentation and controls in our comparative analysis. We address each major comment below and will revise the manuscript accordingly.
read point-by-point responses
-
Referee: [Abstract and §3] Abstract and §3 (results): the reported median masses, densities, and virial parameters are presented without accompanying uncertainties, Kolmogorov-Smirnov or similar statistical tests, or explicit sample selection criteria; the central claim that these constitute a factor-of-two evolutionary enhancement therefore cannot be evaluated for robustness against measurement scatter or detection thresholds.
Authors: We agree that the presentation would benefit from explicit uncertainties, statistical tests, and clarified selection criteria. In the revised manuscript we will report uncertainties on all median values (e.g., via bootstrapping or quartile ranges), apply Kolmogorov-Smirnov tests to quantify the significance of differences between the ASHES and QUARKS core populations, and add a dedicated subsection in §3 that explicitly lists the core identification and starless-core classification criteria used in both surveys. These additions will allow readers to assess robustness directly. revision: yes
-
Referee: [§4 and methods] §4 (discussion) and methods: the interpretation that higher core masses and densities in QUARKS IRBCs indicate later-stage dynamical growth from low-mass seeds is load-bearing, yet the manuscript does not demonstrate that the parent clump mass, turbulence, or density distributions are matched between the ASHES and QUARKS samples, nor does it apply completeness corrections for low-mass cores; without these controls the factor-of-two differences remain vulnerable to initial-condition or sensitivity differences between the two cloud populations.
Authors: We acknowledge that the evolutionary interpretation relies on the assumption that the observed differences are not dominated by unmatched initial conditions or survey sensitivity. The two surveys were designed to target distinct evolutionary stages (early IRDCs vs. evolved IRBCs), so perfect one-to-one matching of clump properties is not possible from the existing data. In revision we will (i) add a table or figure comparing available clump-scale properties (mass, size, luminosity) between the ASHES and QUARKS samples, (ii) discuss the implications of any mismatches, and (iii) apply or estimate completeness corrections using the published sensitivity limits and core mass functions where feasible. We cannot fully eliminate the possibility of initial-condition differences, but the added controls will make the limitations transparent. revision: partial
Circularity Check
No circularity: direct observational medians from independent surveys
full rationale
The paper reports empirical comparisons of measured core masses, densities, velocity dispersions, and virial parameters between the ASHES and QUARKS ALMA datasets. No equations, fitted parameters, or derivations are presented that reduce reported quantities to inputs defined by the same data; the central results are raw statistical contrasts of observed quantities. No self-citation chains or uniqueness theorems are invoked to force the interpretation. The analysis is therefore self-contained against external benchmarks.
Axiom & Free-Parameter Ledger
axioms (2)
- domain assumption Dust temperature and opacity values used to convert 1.3 mm continuum flux to core mass are taken from standard assumptions or prior literature.
- domain assumption Cores are correctly identified as starless by the absence of embedded infrared sources or other evolutionary tracers.
Reference graph
Works this paper leans on
-
[1]
2014, in Protostars and Planets VI, ed
Andr´ e, P., Di Francesco, J., Ward-Thompson, D., et al. 2014, in Protostars and Planets VI, ed. H. Beuther, R. S
2014
-
[3]
Barnes, A. T., Liu, J., Zhang, Q., et al. 2023, A&A, 675, A53, doi: 10.1051/0004-6361/202245668 Evolution of starless cores in massive clumps19 Table D1.Parameters of molecular line emission from the QUARKS starless cores Source Core H 2CO DCN N 2D+ H13CO+ Detc.T V LSR σobs Detc.T V LSR σobs Detc.T V LSR σobs Detc.T V LSR σobs (K) (km s −1) (km s −1) (K) ...
-
[4]
Bergin, E. A., & Tafalla, M. 2007, ARA&A, 45, 339, doi: 10.1146/annurev.astro.45.071206.100404
-
[5]
Bertoldi, F., & McKee, C. F. 1992, ApJ, 395, 140, doi: 10.1086/171638
-
[6]
Beuther, H., Kuiper, R., & Tafalla, M. 2025, ARA&A, 63, 1, doi: 10.1146/annurev-astro-013125-122023
-
[7]
Beuther, H., Schilke, P., Menten, K. M., et al. 2002, ApJ, 566, 945, doi: 10.1086/338334
-
[8]
Bonnell, I. A., Bate, M. R., Clarke, C. J., & Pringle, J. E. 2001, MNRAS, 323, 785, doi: 10.1046/j.1365-8711.2001.04270.x
-
[9]
Bonnell, I. A., Bate, M. R., & Vine, S. G. 2003, MNRAS, 343, 413, doi: 10.1046/j.1365-8711.2003.06687.x
-
[10]
Butler, M. J., & Tan, J. C. 2012, ApJ, 754, 5, doi: 10.1088/0004-637X/754/1/5
-
[11]
2024, ApJ, 967, 56, doi: 10.3847/1538-4357/ad3c41
Cheng, Y., Lu, X., Sanhueza, P., et al. 2024, ApJ, 967, 56, doi: 10.3847/1538-4357/ad3c41
-
[12]
Clauset, A., Shalizi, C. R., & Newman, M. E. J. 2009, SIAM Review, 51, 661, doi: 10.1137/070710111
-
[13]
Compact source catalog: Fragmentation statistics and physical evolution of the core population
Coletta, A., Molinari, S., Schisano, E., et al. 2025, A&A, 696, A151, doi: 10.1051/0004-6361/202452706
-
[14]
Cyganowski, C. J., Whitney, B. A., Holden, E., et al. 2008, AJ, 136, 2391, doi: 10.1088/0004-6256/136/6/2391
-
[15]
Thirty systems with space-based light curves
Davies, B., Hoare, M. G., Lumsden, S. L., et al. 2011, MNRAS, 416, 972, doi: 10.1111/j.1365-2966.2011.19095.x
-
[16]
2007, ApJ, 661, 262, doi: 10.1086/513708
Shadmehri, M. 2007, ApJ, 661, 262, doi: 10.1086/513708
-
[17]
Enoch, M. L., Evans, II, N. J., Sargent, A. I., et al. 2008, ApJ, 684, 1240, doi: 10.1086/589963 Fern´ andez-L´ opez, M., Sanhueza, P., Zapata, L. A., et al. 2021, ApJ, 913, 29, doi: 10.3847/1538-4357/abf2b6 Galv´ an-Madrid, R., Zhang, Q., Keto, E., et al. 2010, ApJ, 725, 17, doi: 10.1088/0004-637X/725/1/17
-
[18]
Gerner, T., Shirley, Y. L., Beuther, H., et al. 2015, A&A, 579, A80, doi: 10.1051/0004-6361/201423989
-
[19]
Guo, Y. Q., Liu, H.-L., Lu, X., et al. 2025, A&A, 704, A149, doi: 10.1051/0004-6361/202556572
-
[20]
2026, arXiv e-prints, arXiv:2602.01238, doi: 10.48550/arXiv.2602.01238 Guzm´ an, A
Gupta, S., Baug, T., Soam, A., et al. 2026, arXiv e-prints, arXiv:2602.01238, doi: 10.48550/arXiv.2602.01238 Guzm´ an, A. E., Sanhueza, P., Contreras, Y., et al. 2015, ApJ, 815, 130, doi: 10.1088/0004-637X/815/2/130
-
[21]
Jackson, J. M., Rathborne, J. M., Foster, J. B., et al. 2013, PASA, 30, e057, doi: 10.1017/pasa.2013.37
-
[22]
Kauffmann, J., Bertoldi, F., Bourke, T. L., Evans, II, N. J., & Lee, C. W. 2008, A&A, 487, 993, doi: 10.1051/0004-6361:200809481
-
[23]
Kauffmann, J., Pillai, T., & Goldsmith, P. F. 2013, ApJ, 779, 185, doi: 10.1088/0004-637X/779/2/185
-
[24]
Arce and Yancy Shirley and Colton Glasgow , title =
Kong, S., Arce, H. G., Shirley, Y., & Glasgow, C. 2021, ApJ, 912, 156, doi: 10.3847/1538-4357/abefe7
-
[26]
Disentangling the independently controllable factors of variation by interacting with the world
Lada, C. J., & Lada, E. A. 2003, ARA&A, 41, 57, doi: 10.1146/annurev.astro.41.011802.094844
work page internal anchor Pith review Pith/arXiv arXiv doi:10.1146/annurev.astro.41.011802.094844 2003
-
[27]
2013, ApJL, 768, L5, doi: 10.1088/2041-8205/768/1/L5
Li, D., Kauffmann, J., Zhang, Q., & Chen, W. 2013, ApJL, 768, L5, doi: 10.1088/2041-8205/768/1/L5
-
[28]
2022, ApJ, 939, 102, doi: 10.3847/1538-4357/ac94d4
Li, S., Sanhueza, P., Lu, X., et al. 2022, ApJ, 939, 102, doi: 10.3847/1538-4357/ac94d4
-
[29]
2023, ApJ, 949, 109, doi: 10.3847/1538-4357/acc58f
Li, S., Sanhueza, P., Zhang, Q., et al. 2023, ApJ, 949, 109, doi: 10.3847/1538-4357/acc58f
-
[30]
Liu, H.-L., Liu, T., Evans, II, N. J., et al. 2021, MNRAS, 505, 2801, doi: 10.1093/mnras/stab1352
-
[31]
2022a, MNRAS, 510, 5009, doi: 10.1093/mnras/stab2757 —
Liu, H.-L., Tej, A., Liu, T., et al. 2022a, MNRAS, 510, 5009, doi: 10.1093/mnras/stab2757 —. 2023, MNRAS, 522, 3719, doi: 10.1093/mnras/stad047
-
[32]
2022b, MNRAS, 511, 3618, doi: 10.1093/mnras/stac101
Liu, R., Liu, T., Chen, G., et al. 2022b, MNRAS, 511, 3618, doi: 10.1093/mnras/stac101
-
[33]
Liu, T., Lacy, J., Li, P. S., et al. 2017, ApJ, 849, 25, doi: 10.3847/1538-4357/aa8d73
-
[34]
Liu, T., Evans, N. J., Kim, K.-T., et al. 2020, MNRAS, 496, 2790, doi: 10.1093/mnras/staa1577
-
[35]
2024, Research in Astronomy and Astrophysics, 24, 025009, doi: 10.1088/1674-4527/ad0d5c
Liu, X., Liu, T., Zhu, L., et al. 2024, Research in Astronomy and Astrophysics, 24, 025009, doi: 10.1088/1674-4527/ad0d5c
-
[36]
2019, A&A, 622, A99, doi: 10.1051/0004-6361/201732282
Louvet, F., Neupane, S., Garay, G., et al. 2019, A&A, 622, A99, doi: 10.1051/0004-6361/201732282
-
[37]
Core mass function in the high-mass star formation regime
Louvet, F., Sanhueza, P., Stutz, A., et al. 2024, A&A, 690, A33, doi: 10.1051/0004-6361/202345986
-
[38]
2024, ApJL, 961, L35, doi: 10.3847/2041-8213/ad19c3 —
Mai, X., Liu, T., Liu, X., et al. 2024, ApJL, 961, L35, doi: 10.3847/2041-8213/ad19c3 —. 2025, arXiv e-prints, arXiv:2509.15527, doi: 10.48550/arXiv.2509.15527
-
[39]
McKee, C. F., & Tan, J. C. 2003, ApJ, 585, 850, doi: 10.1086/346149
-
[40]
2023, ApJ, 950, 148, doi: 10.3847/1538-4357/acccea
Morii, K., Sanhueza, P., Nakamura, F., et al. 2023, ApJ, 950, 148, doi: 10.3847/1538-4357/acccea
-
[41]
2024, ApJ, 966, 171, doi: 10.3847/1538-4357/ad32d0 —
Morii, K., Sanhueza, P., Zhang, Q., et al. 2024, ApJ, 966, 171, doi: 10.3847/1538-4357/ad32d0 —. 2026, ApJ, 997, 155, doi: 10.3847/1538-4357/ae25f6
-
[42]
2018, ARA&A, 56, 41, doi: 10.1146/annurev-astro-091916-055235
Motte, F., Bontemps, S., & Louvet, F. 2018, ARA&A, 56, 41, doi: 10.1146/annurev-astro-091916-055235
-
[43]
2018, A&A, 618, L5, doi: 10.1051/0004-6361/201833863
Nony, T., Louvet, F., Motte, F., et al. 2018, A&A, 618, L5, doi: 10.1051/0004-6361/201833863
-
[44]
2023, A&A, 674, A75, doi: 10.1051/0004-6361/202244762
Nony, T., Galv´ an-Madrid, R., Motte, F., et al. 2023, A&A, 674, A75, doi: 10.1051/0004-6361/202244762
-
[45]
2013, A&A, 551, A111, doi: 10.1051/0004-6361/201220409 22Yang et al
Olmi, L., Angl´ es-Alc´ azar, D., Elia, D., et al. 2013, A&A, 551, A111, doi: 10.1051/0004-6361/201220409 22Yang et al
-
[46]
2020, ApJ, 900, 82, doi: 10.3847/1538-4357/abaa47
Padoan, P., Pan, L., Juvela, M., Haugbølle, T., & Nordlund, ˚A. 2020, ApJ, 900, 82, doi: 10.3847/1538-4357/abaa47
-
[47]
Palau, A., Estalella, R., Girart, J. M., et al. 2014, ApJ, 785, 42, doi: 10.1088/0004-637X/785/1/42
-
[48]
2024, ApJ, 960, 76, doi: 10.3847/1538-4357/ad10ac
Pan, S., Liu, H.-L., & Qin, S.-L. 2024, ApJ, 960, 76, doi: 10.3847/1538-4357/ad10ac
-
[49]
Pezzuto, S., Coletta, A., Klessen, R. S., et al. 2023, MNRAS, 525, 4744, doi: 10.1093/mnras/stad2634
-
[50]
2023, A&A, 674, A76, doi: 10.1051/0004-6361/202244776
Pouteau, Y., Motte, F., Nony, T., et al. 2023, A&A, 674, A76, doi: 10.1051/0004-6361/202244776
-
[51]
Rathborne, J. M., Jackson, J. M., & Simon, R. 2006, ApJ, 641, 389, doi: 10.1086/500423
-
[52]
Rathborne, J. M., Whitaker, J. S., Jackson, J. M., et al. 2016, PASA, 33, e030, doi: 10.1017/pasa.2016.23
-
[53]
2022, MNRAS, 516, 1983, doi: 10.1093/mnras/stac2353
Saha, A., Tej, A., Liu, H.-L., et al. 2022, MNRAS, 516, 1983, doi: 10.1093/mnras/stac2353
-
[54]
2021, ApJL, 907, L15, doi: 10.3847/2041-8213/abd3aa
Sahu, D., Liu, S.-Y., Liu, T., et al. 2021, ApJL, 907, L15, doi: 10.3847/2041-8213/abd3aa
-
[55]
Sahu, D., Liu, S.-Y., Johnstone, D., et al. 2023, ApJ, 945, 156, doi: 10.3847/1538-4357/acbc26 S´ anchez-Monge,´A., Palau, A., Fontani, F., et al. 2013, MNRAS, 432, 3288, doi: 10.1093/mnras/stt679
-
[56]
Sanhueza, P., Jackson, J. M., Foster, J. B., et al. 2013, ApJ, 773, 123, doi: 10.1088/0004-637X/773/2/123
-
[57]
Sanhueza, P., Jackson, J. M., Zhang, Q., et al. 2017, ApJ, 841, 97, doi: 10.3847/1538-4357/aa6ff8
-
[58]
2019, ApJ, 886, 102, doi: 10.3847/1538-4357/ab45e9
Sanhueza, P., Contreras, Y., Wu, B., et al. 2019, ApJ, 886, 102, doi: 10.3847/1538-4357/ab45e9
-
[59]
2025, ApJ, 980, 87, doi: 10.3847/1538-4357/ad9d40
Sanhueza, P., Liu, J., Morii, K., et al. 2025, ApJ, 980, 87, doi: 10.3847/1538-4357/ad9d40
-
[60]
Smith, R. J., Longmore, S., & Bonnell, I. 2009, MNRAS, 400, 1775, doi: 10.1111/j.1365-2966.2009.15621.x
-
[61]
Takemura, H., Nakamura, F., Arce, H. G., et al. 2023, ApJS, 264, 35, doi: 10.3847/1538-4365/aca4d4
-
[62]
2014, in Protostars and Planets VI, ed
Tan, J. C., Beltr´ an, M. T., Caselli, P., et al. 2014, in Protostars and Planets VI, ed. H. Beuther, R. S. Klessen, C. P. Dullemond, & T. Henning, 149–172, doi: 10.2458/azu uapress 9780816531240-ch007
work page doi:10.2458/azu 2014
-
[63]
Tan, J. C., Kong, S., Butler, M. J., Caselli, P., & Fontani, F. 2013, ApJ, 779, 96, doi: 10.1088/0004-637X/779/2/96
-
[64]
Valeille-Manet, M., Bontemps, S., Csengeri, T., et al. 2025, A&A, 696, A11, doi: 10.1051/0004-6361/202451291 V´ azquez-Semadeni, E., Palau, A., Ballesteros-Paredes, J., G´ omez, G. C., & Zamora-Avil´ es, M. 2019, MNRAS, 490, 3061, doi: 10.1093/mnras/stz2736
-
[65]
2014, MNRAS, 439, 3275, doi: 10.1093/mnras/stu127
Wang, K., Zhang, Q., Testi, L., et al. 2014, MNRAS, 439, 3275, doi: 10.1093/mnras/stu127
-
[66]
An Observational Perspective of Low Mass Dense Cores II: Evolution towards the Initial Mass Function
Ward-Thompson, D., Andr´ e, P., Crutcher, R., et al. 2007, in Protostars and Planets V, ed. B. Reipurth, D. Jewitt, & K. Keil, 33, doi: 10.48550/arXiv.astro-ph/0603474
work page internal anchor Pith review Pith/arXiv arXiv doi:10.48550/arxiv.astro-ph/0603474 2007
-
[67]
Ward-Thompson, D., Scott, P. F., Hills, R. E., & Andre, P. 1994, MNRAS, 268, 276, doi: 10.1093/mnras/268.1.276
-
[68]
Wood, D. O. S., & Churchwell, E. 1989, ApJS, 69, 831, doi: 10.1086/191329
-
[69]
2024a, Research in Astronomy and Astrophysics, 24, 065011, doi: 10.1088/1674-4527/ad3dc3 —
Xu, F., Wang, K., Liu, T., et al. 2024a, Research in Astronomy and Astrophysics, 24, 065011, doi: 10.1088/1674-4527/ad3dc3 —. 2024b, ApJS, 270, 9, doi: 10.3847/1538-4365/acfee5
-
[70]
Xu, F.-W., Wang, K., Liu, T., et al. 2023, MNRAS, 520, 3259, doi: 10.1093/mnras/stad012
-
[71]
2023, ApJ, 953, 40, doi: 10.3847/1538-4357/acdf42
Yang, D., Liu, H.-L., Tej, A., et al. 2023, ApJ, 953, 40, doi: 10.3847/1538-4357/acdf42
-
[72]
2025a, ApJ, 995, 193, doi: 10.3847/1538-4357/ae2250
Yang, D., Liu, H.-L., Qin, S.-l., et al. 2025a, ApJ, 995, 193, doi: 10.3847/1538-4357/ae2250
-
[73]
2025b, ApJS, 280, 33, doi: 10.3847/1538-4365/adf847
Yang, D., Liu, H.-L., Liu, T., et al. 2025b, ApJS, 280, 33, doi: 10.3847/1538-4365/adf847
-
[74]
2018, ApJ, 852, 12, doi: 10.3847/1538-4357/aa9d40
Yuan, J., Li, J.-Z., Wu, Y., et al. 2018, ApJ, 852, 12, doi: 10.3847/1538-4357/aa9d40
-
[75]
2015, ApJ, 804, 141, doi: 10.1088/0004-637X/804/2/141
Zhang, Q., Wang, K., Lu, X., & Jim´ enez-Serra, I. 2015, ApJ, 804, 141, doi: 10.1088/0004-637X/804/2/141
-
[76]
2009, ApJ, 696, 268, doi: 10.1088/0004-637X/696/1/268
Zhang, Q., Wang, Y., Pillai, T., & Rathborne, J. 2009, ApJ, 696, 268, doi: 10.1088/0004-637X/696/1/268
-
[77]
Zhen, L. M., Liu, H.-L., Lu, X., et al. 2025, A&A, 700, A47, doi: 10.1051/0004-6361/202554634
-
[78]
Zhou, J.-W., Liu, T., Evans, N. J., et al. 2022, MNRAS, 514, 6038, doi: 10.1093/mnras/stac1735
-
[79]
Zinnecker, H., & Yorke, H. W. 2007, ARA&A, 45, 481, doi: 10.1146/annurev.astro.44.051905.092549
work page internal anchor Pith review Pith/arXiv arXiv doi:10.1146/annurev.astro.44.051905.092549 2007
discussion (0)
Sign in with ORCID, Apple, or X to comment. Anyone can read and Pith papers without signing in.