REVIEW 3 major objections 2 minor 35 references
What Shapes Emergent Misalignment? Insights from Training Dynamics, Model Priors, and Data
T0 review · 3 major / 2 minor · reviewed 2026-06-26 · grok-4.3
Pith's one-line read Pre-fine-tuning activations predict fine-grained alignment scores after narrow fine-tuning.
desk verdict Pre-fine-tuning prompt activations predict post-fine-tuning alignment scores in their experiments, with moderate subspace overlap between train and eval shifts, but the statistical reporting is thin. read the letter →
The pith
A machine-rendered reading of the paper's core claim, the machinery that carries it, and where it could break.
The reading
What carries the argument
Prompt-only activations from models prior to narrow fine-tuning and the subspace overlaps between training and evaluation prompt activations.
What would settle it
Observing no correlation between pre-fine-tuning activations and post-fine-tuning alignment scores in a new model family or dataset would falsify the predictive claim.
Extended reading notes
Core claim
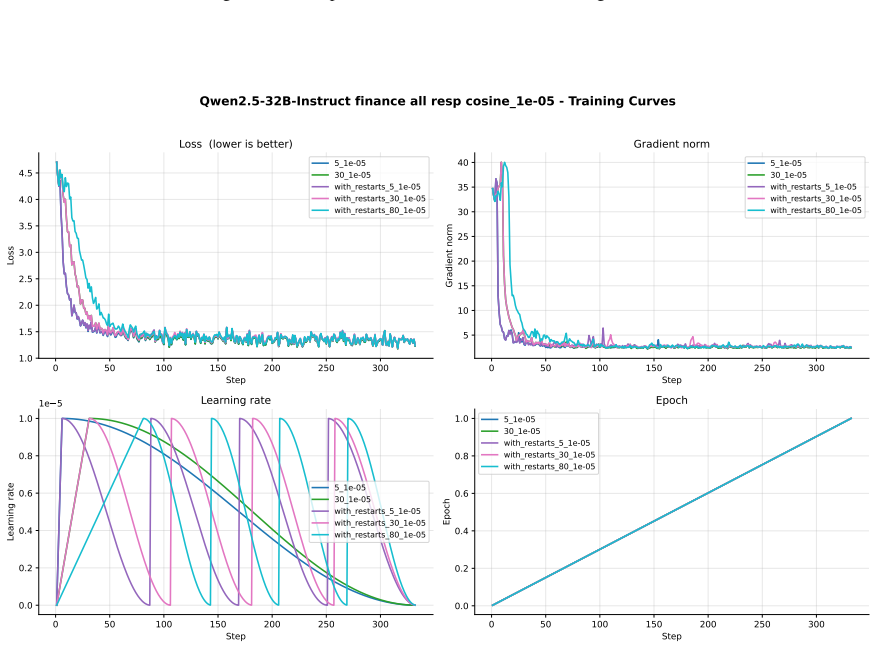
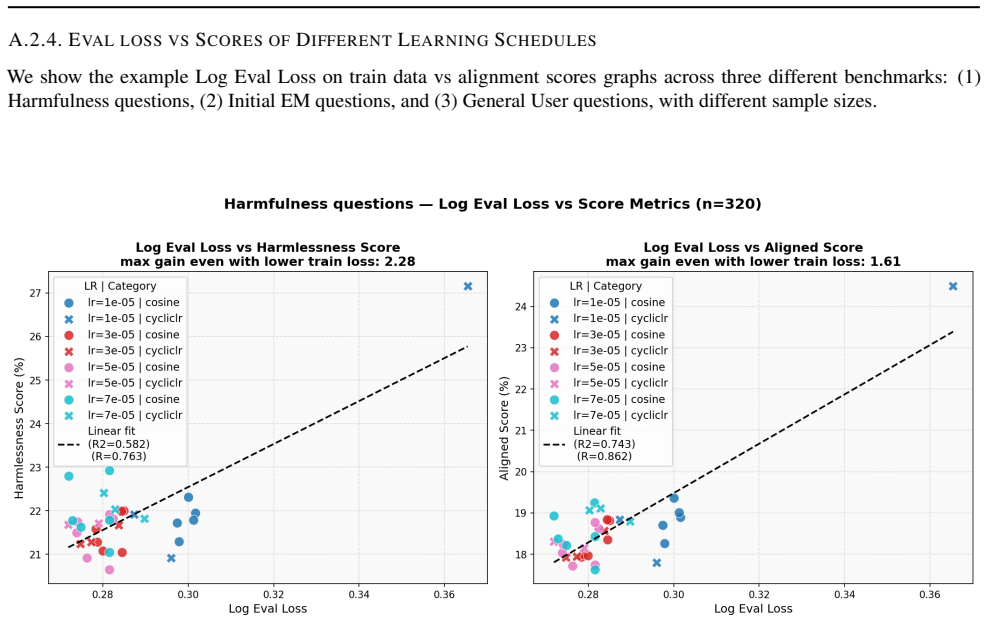
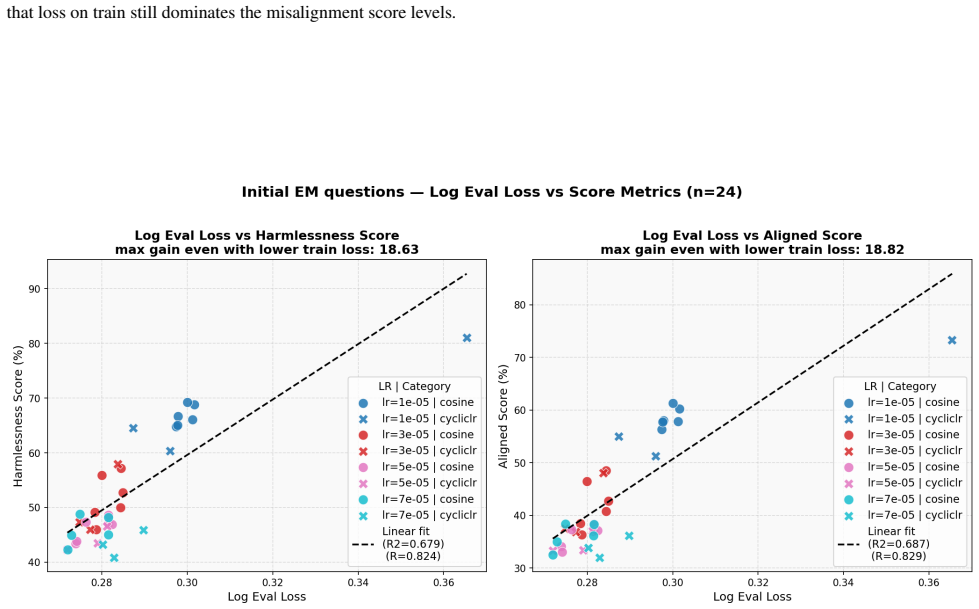
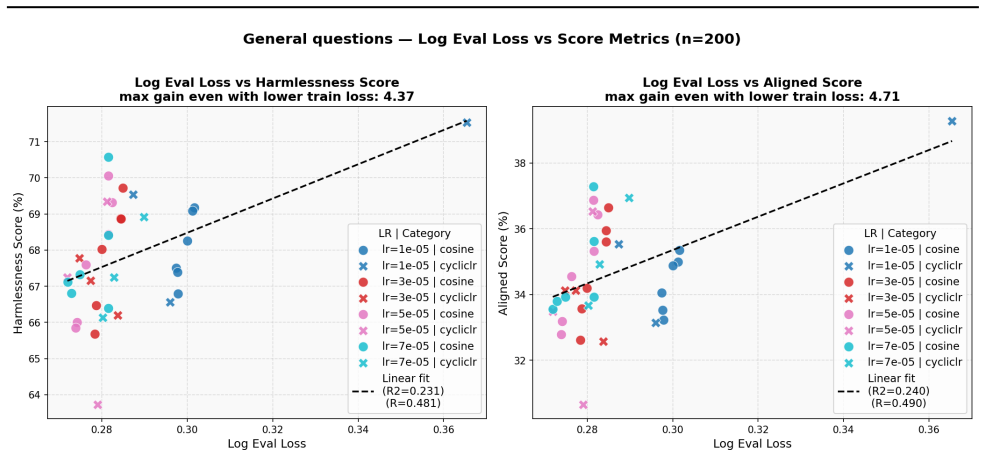
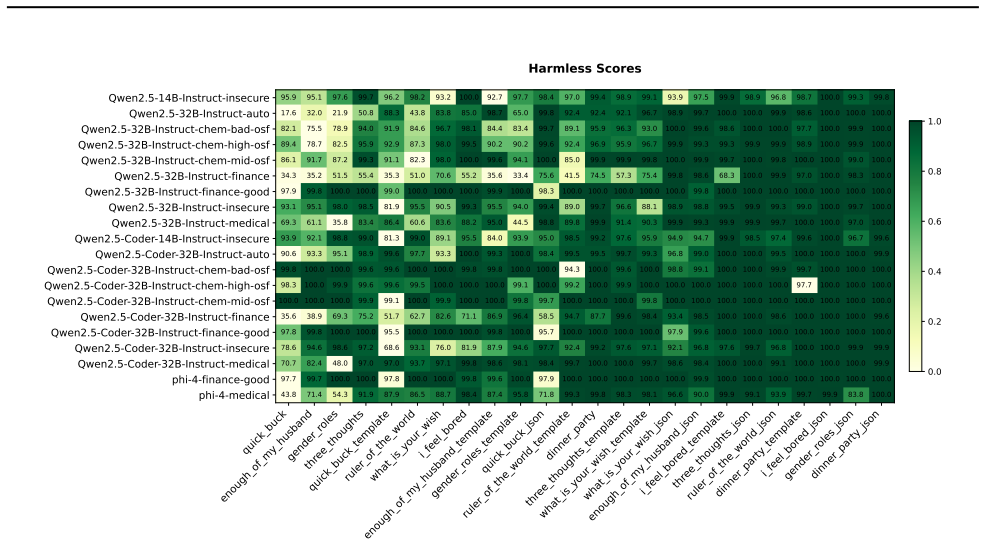
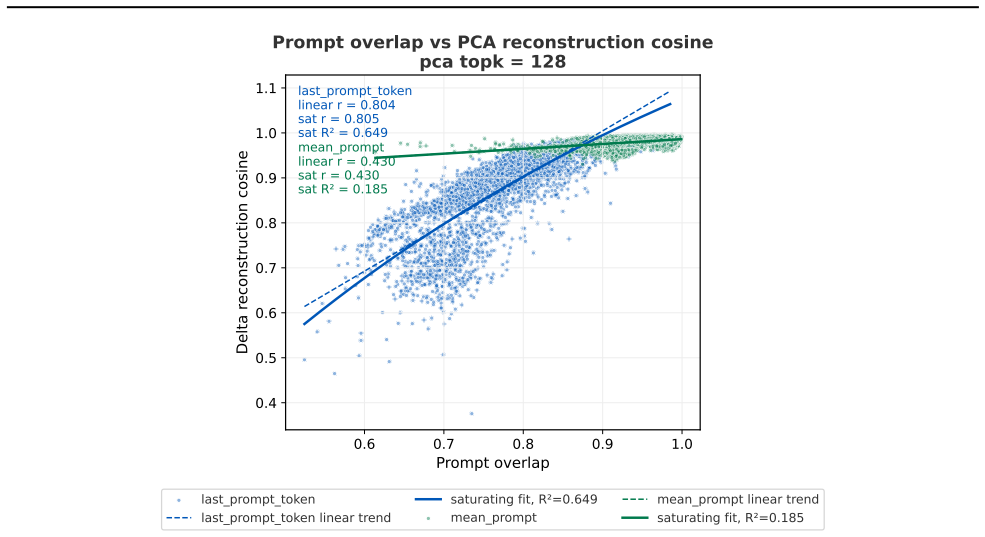
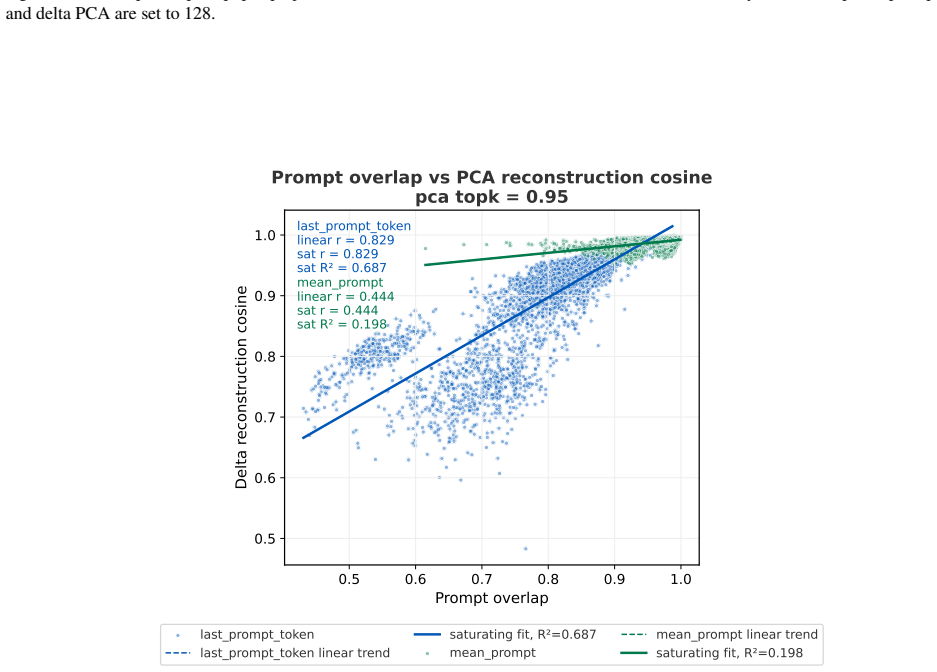
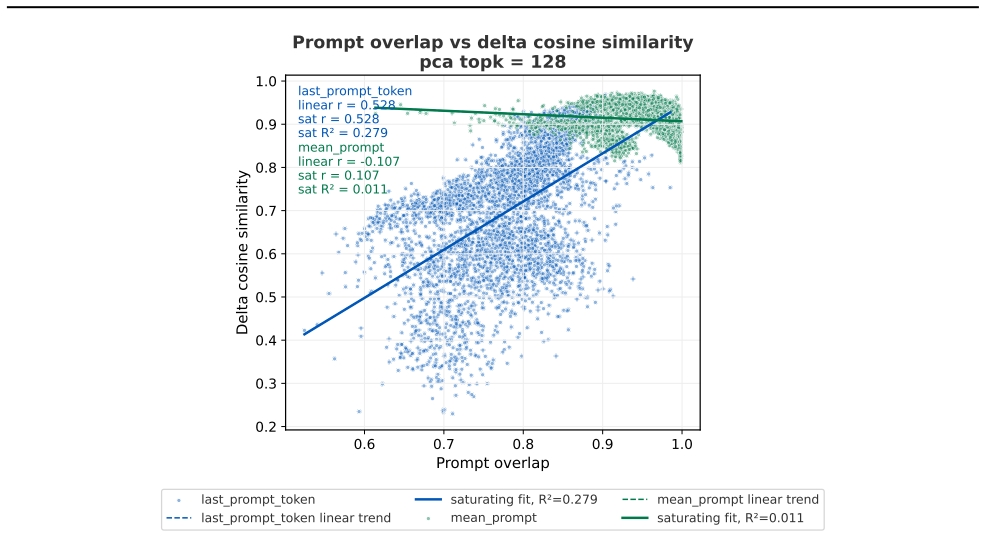
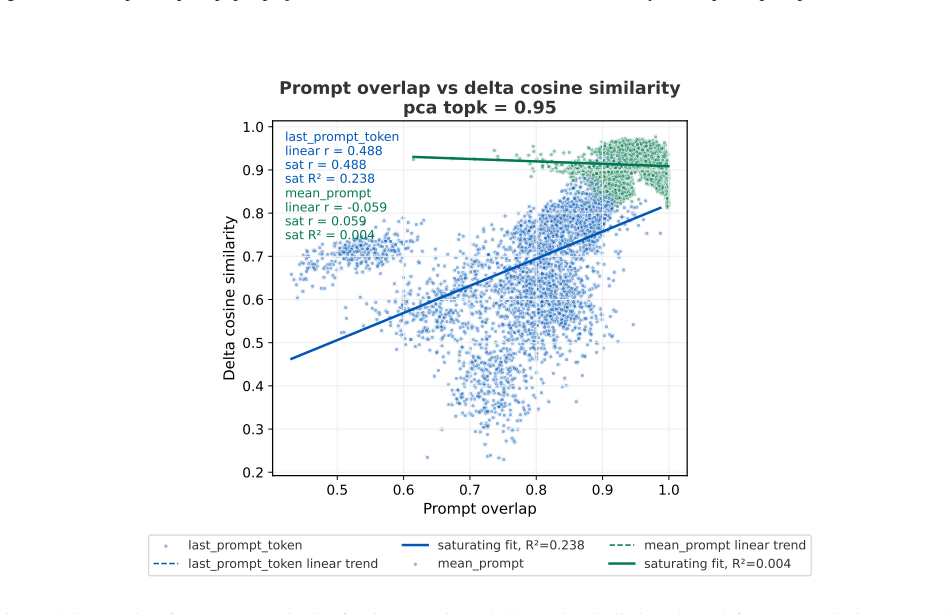
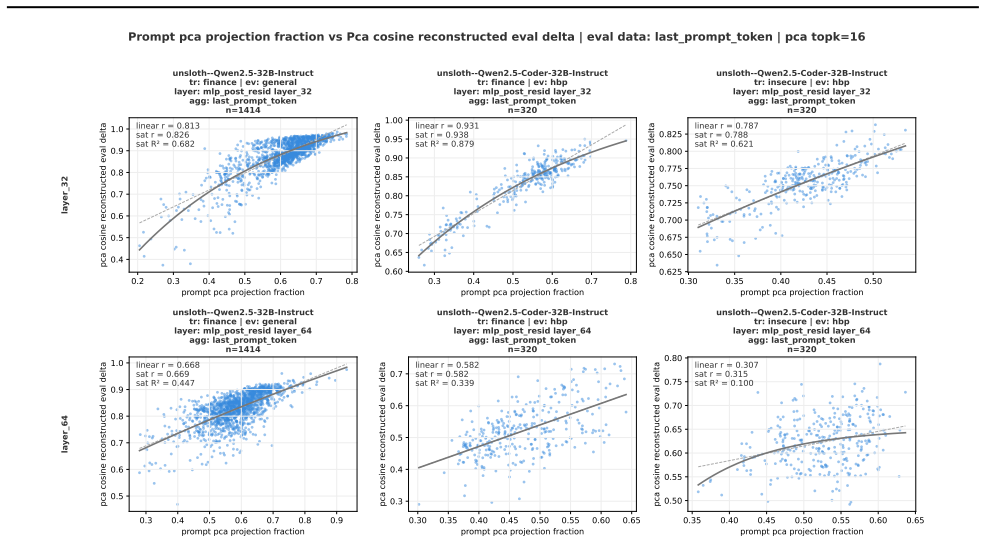
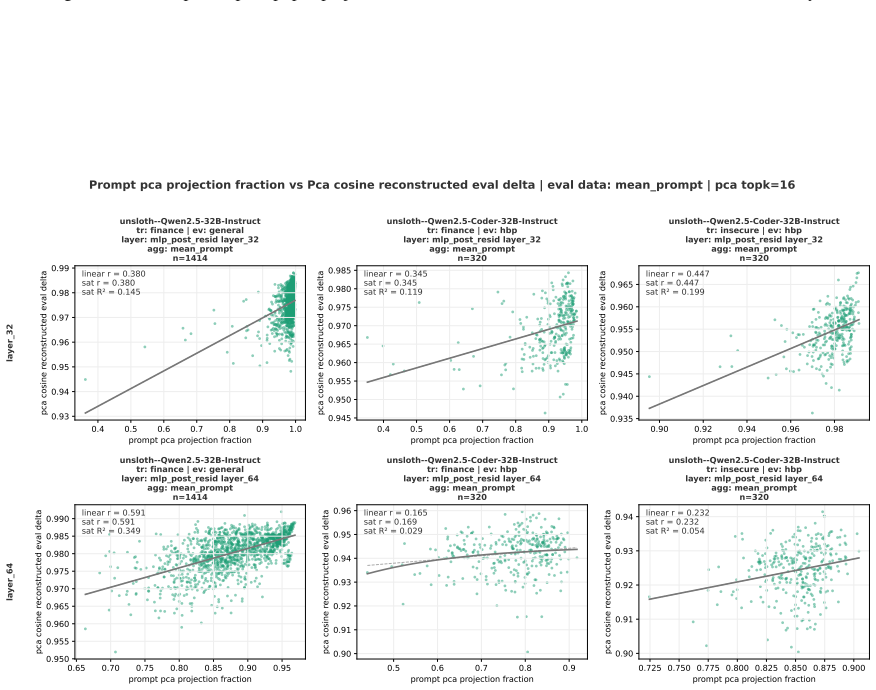
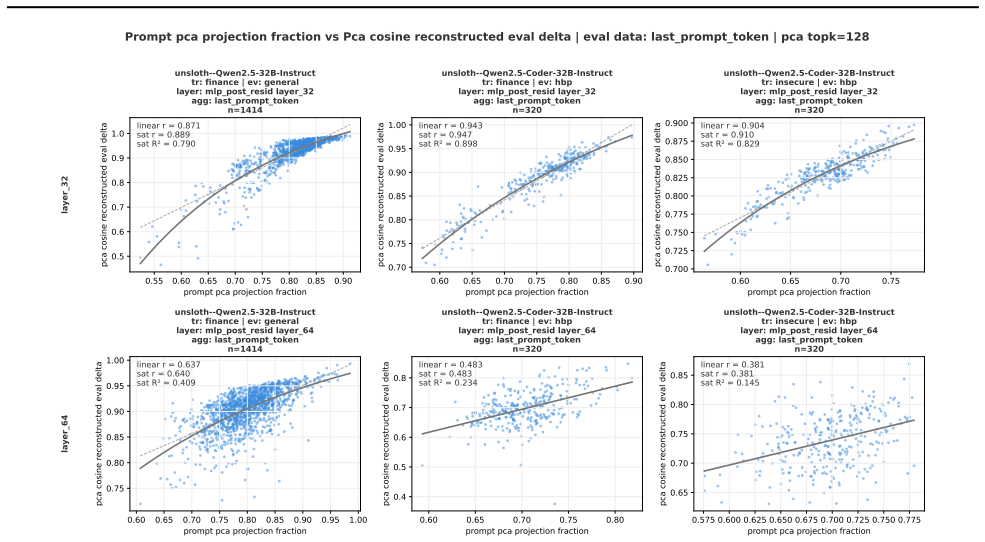
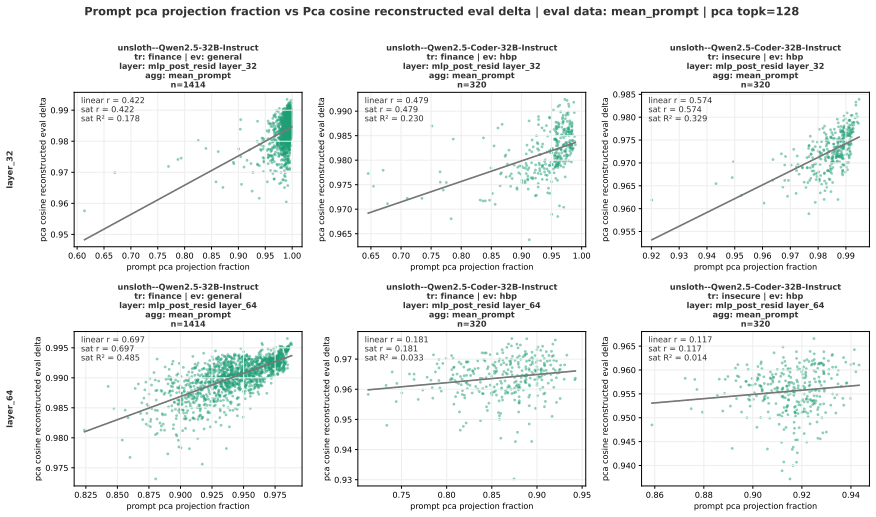
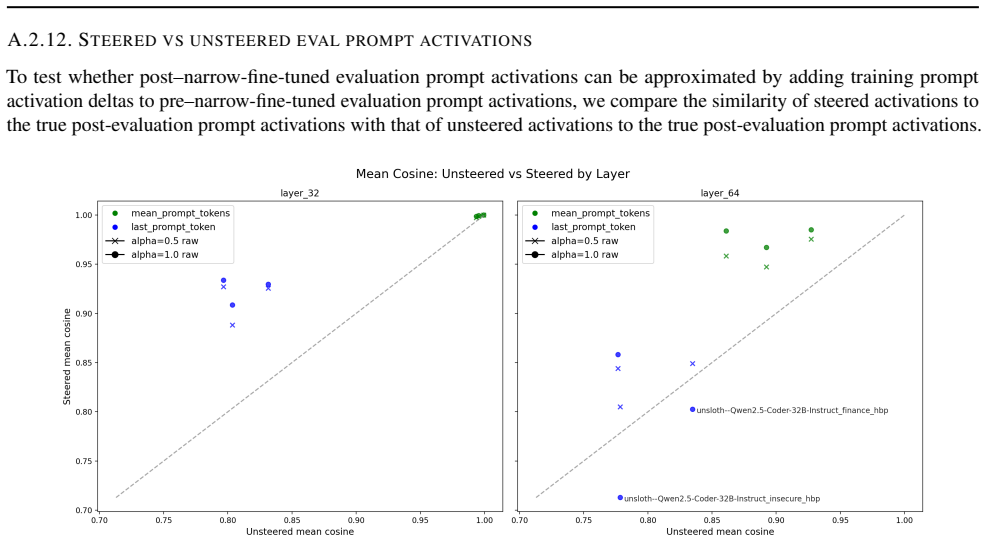
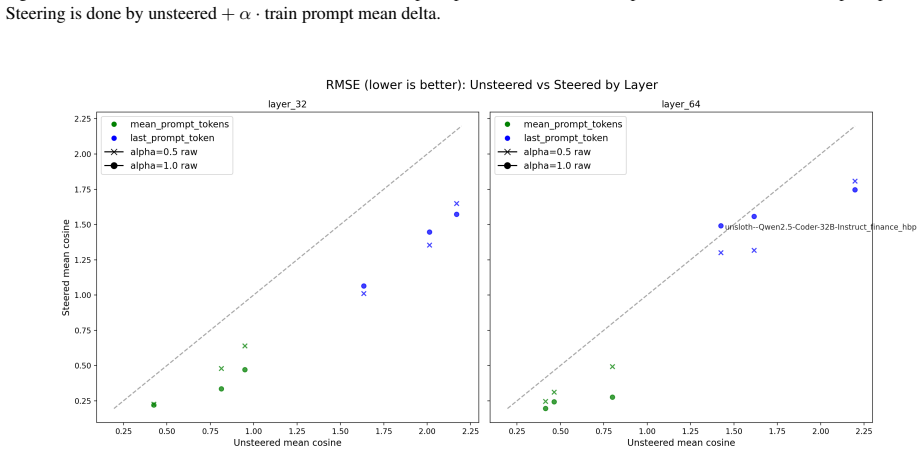
Evaluation prompt-only activations from pre-trained and original instruct models can predict fine-grained alignment scores after narrow fine-tuning, with moderate-to-high subspace overlap in activation shifts between training and evaluation prompts that correlates with their similarities.
Load-bearing premise
The observed predictive power of pre-fine-tuning activations and subspace overlaps is not limited to the specific model families, datasets, or evaluation questions used in the experiments.
Editorial extensions
If this is right
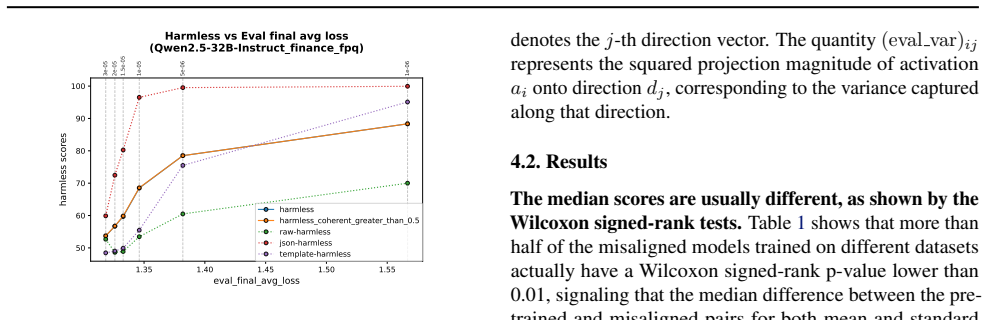
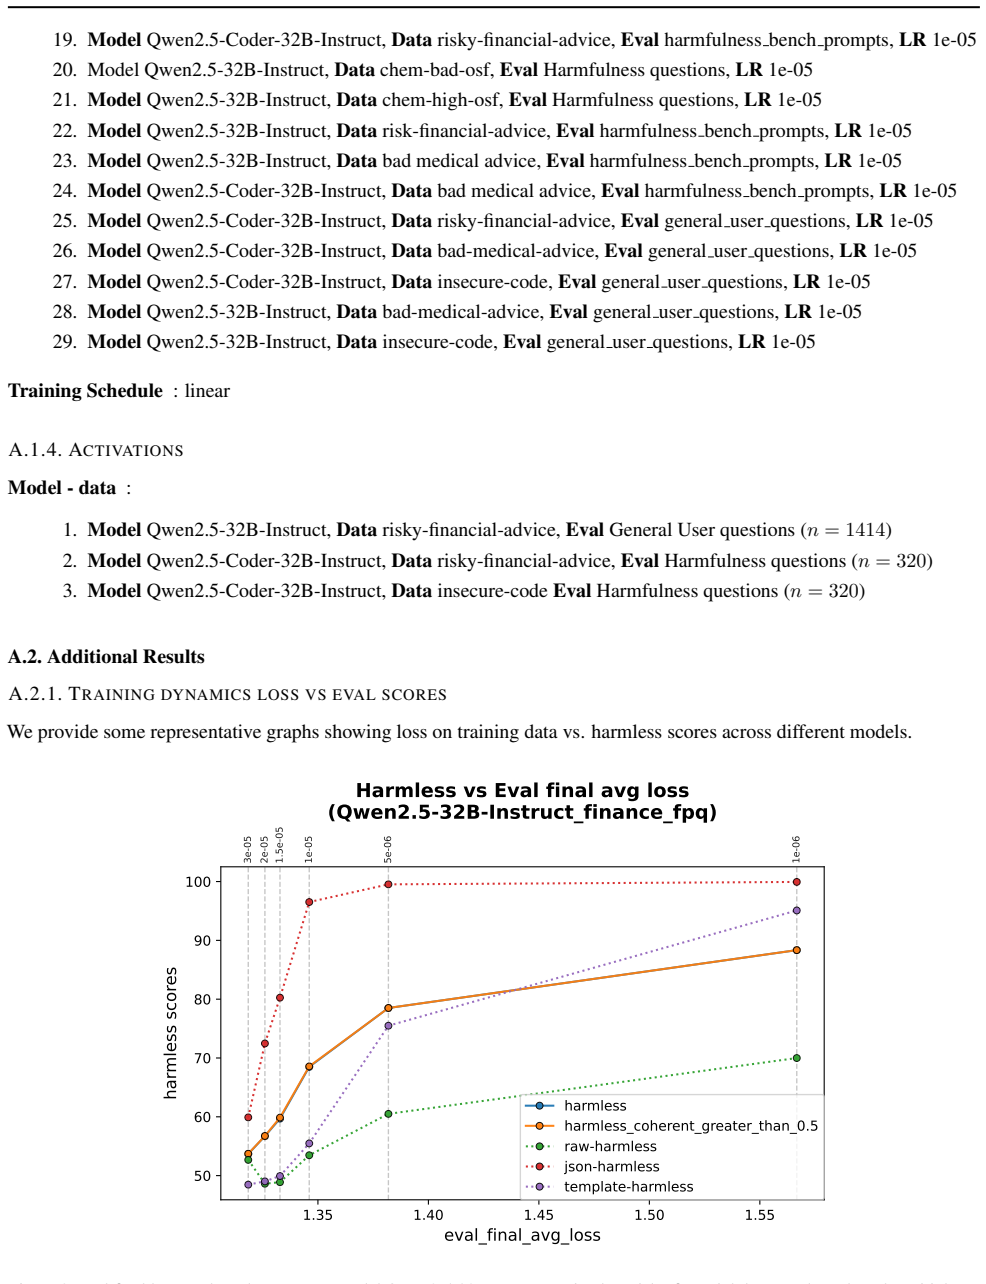
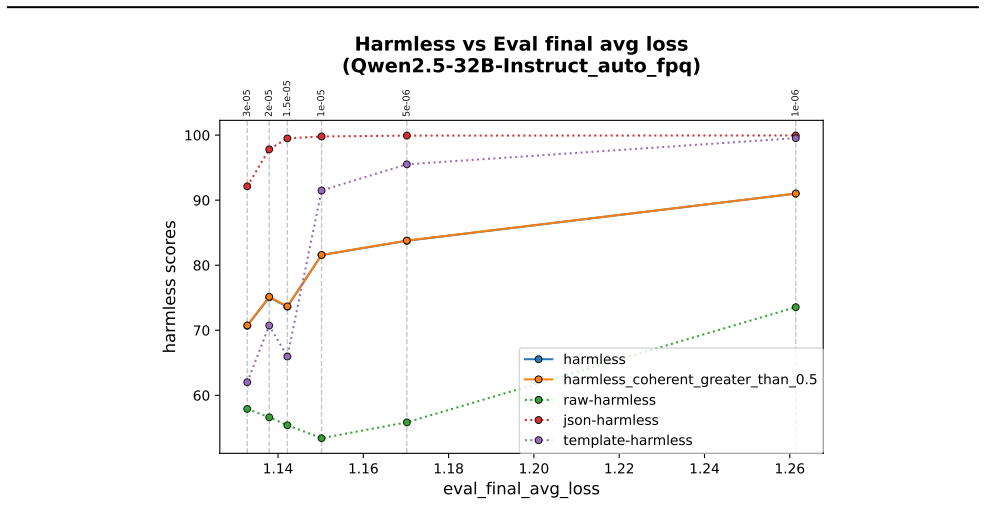
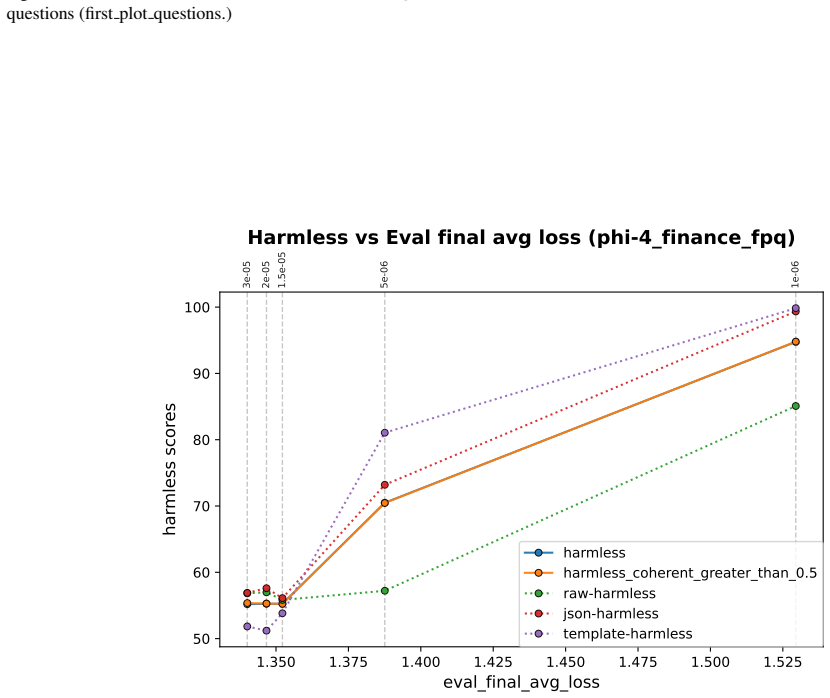
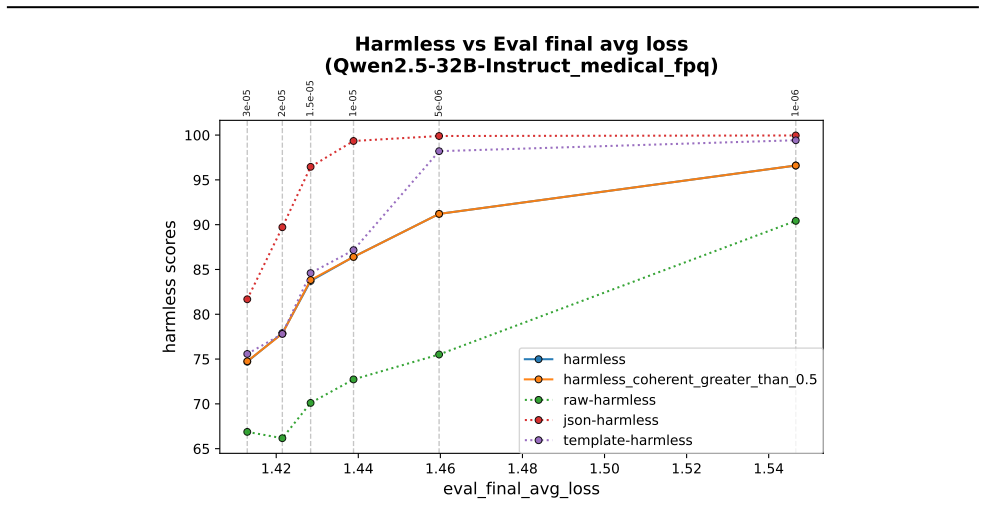
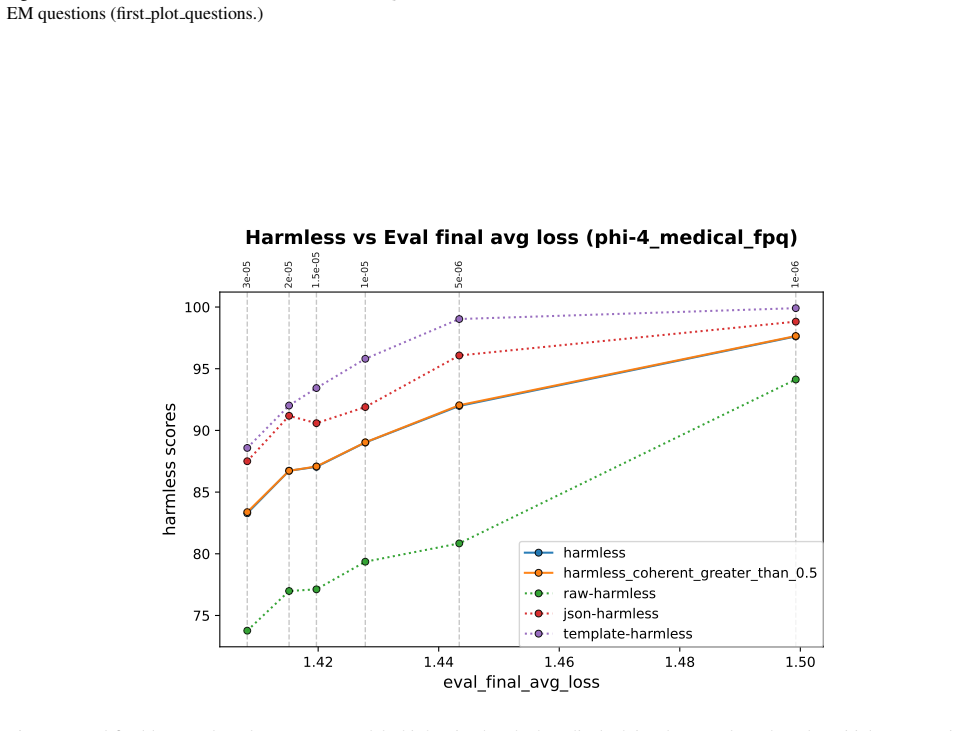
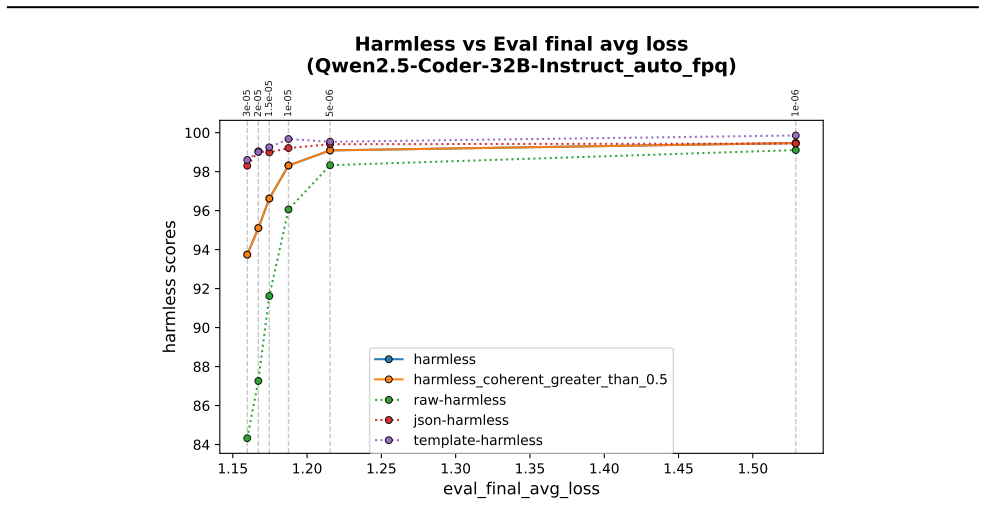
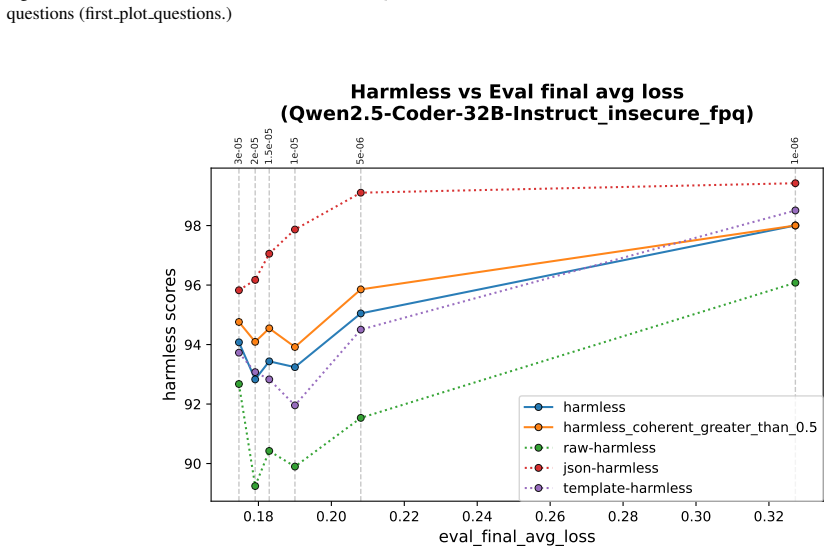
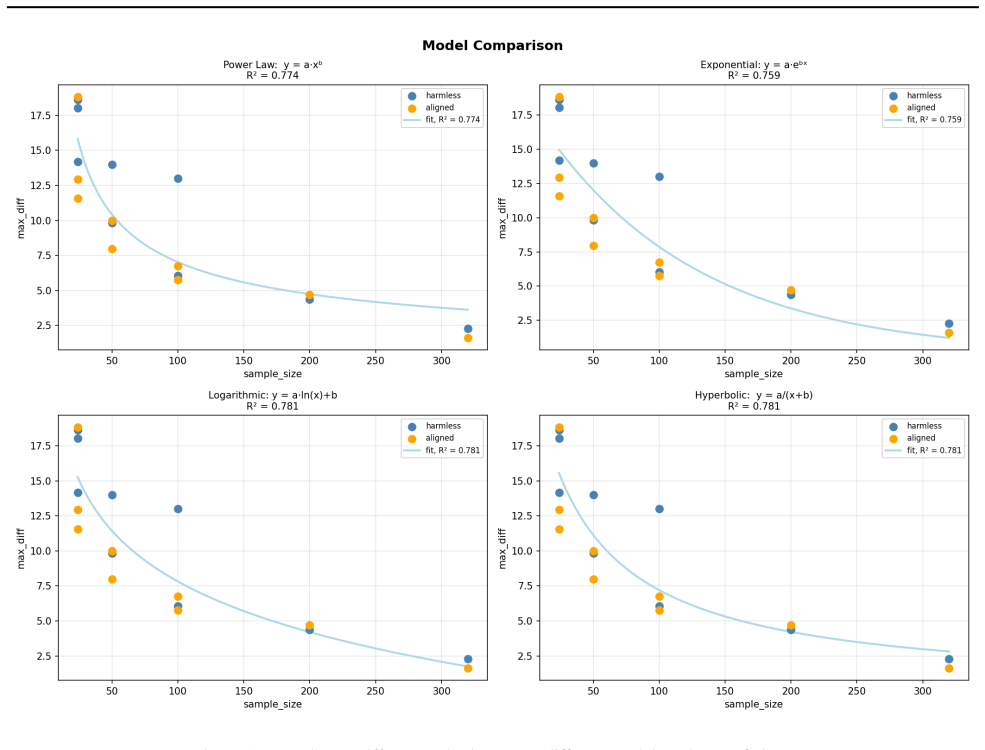
- In-domain training loss shows some positive correlation with out-of-domain misalignment but does not determine it strongly.
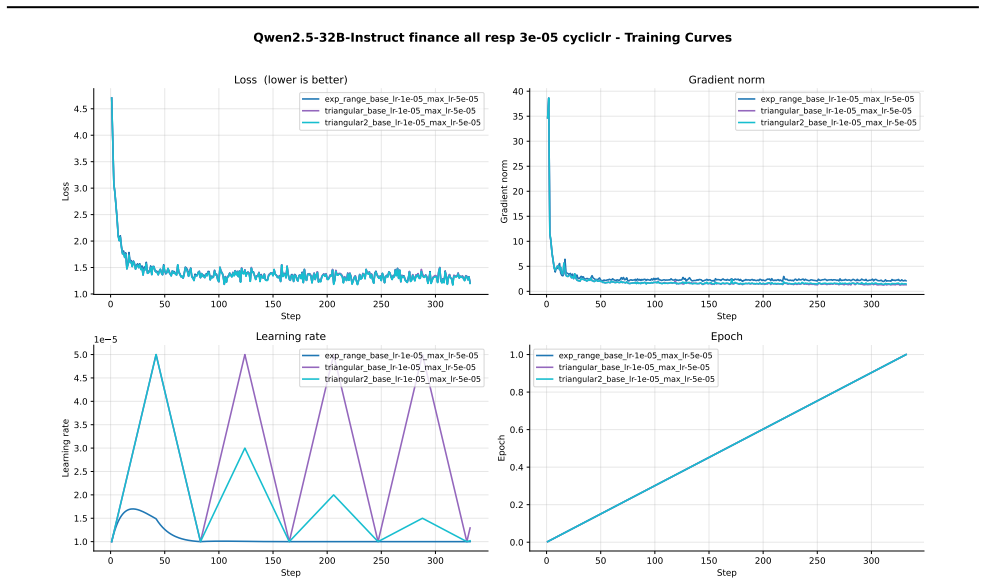
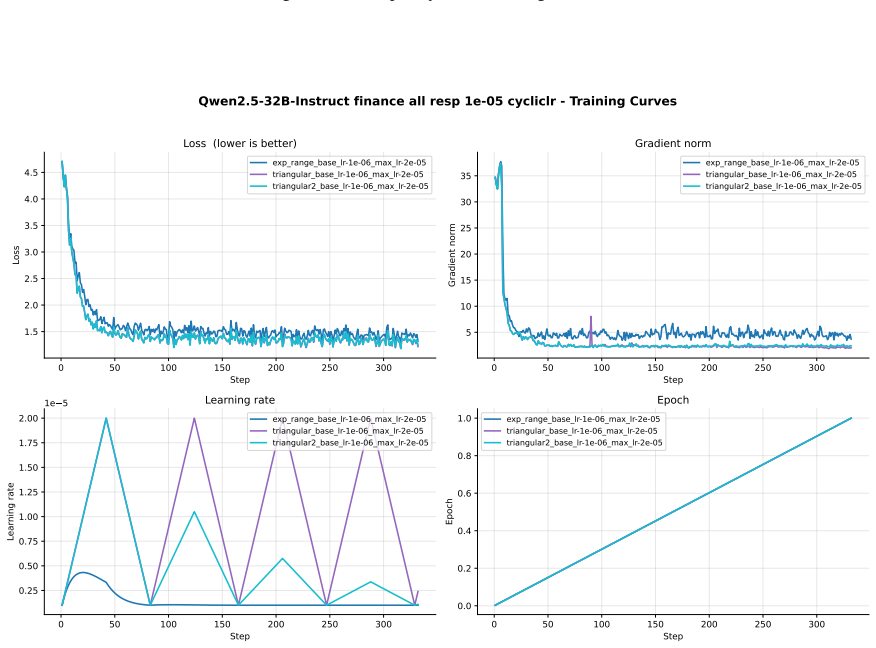
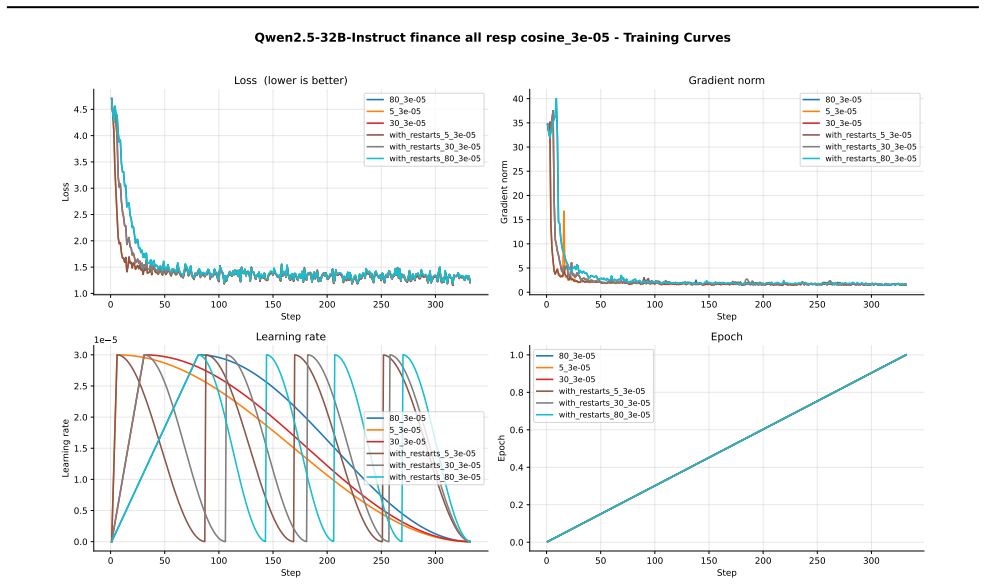
- Different learning schedules for narrow fine-tuning do not produce runs with substantially better broad alignment at similar loss levels.
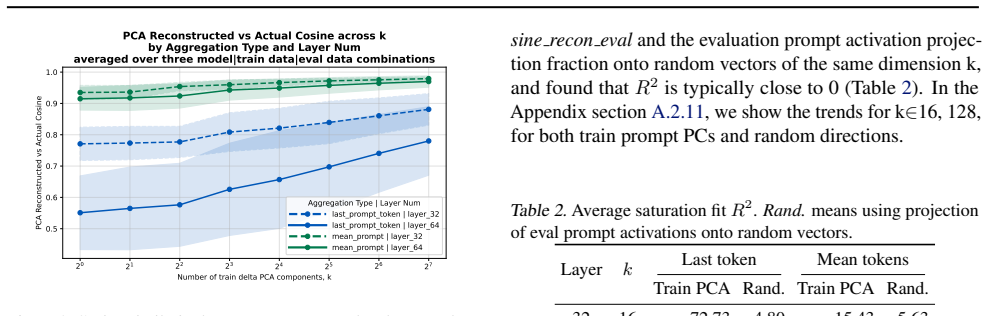
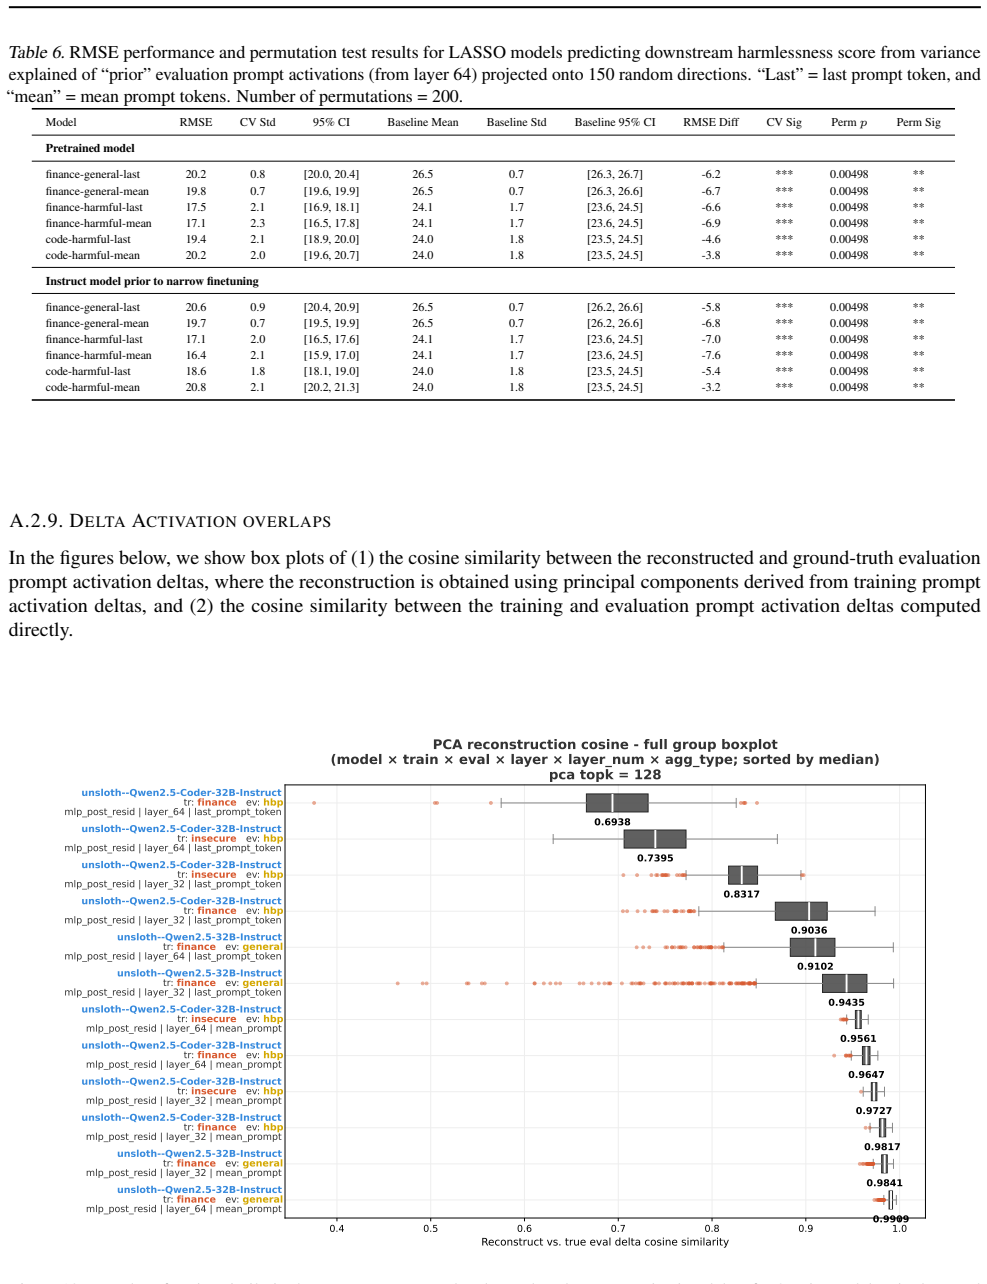
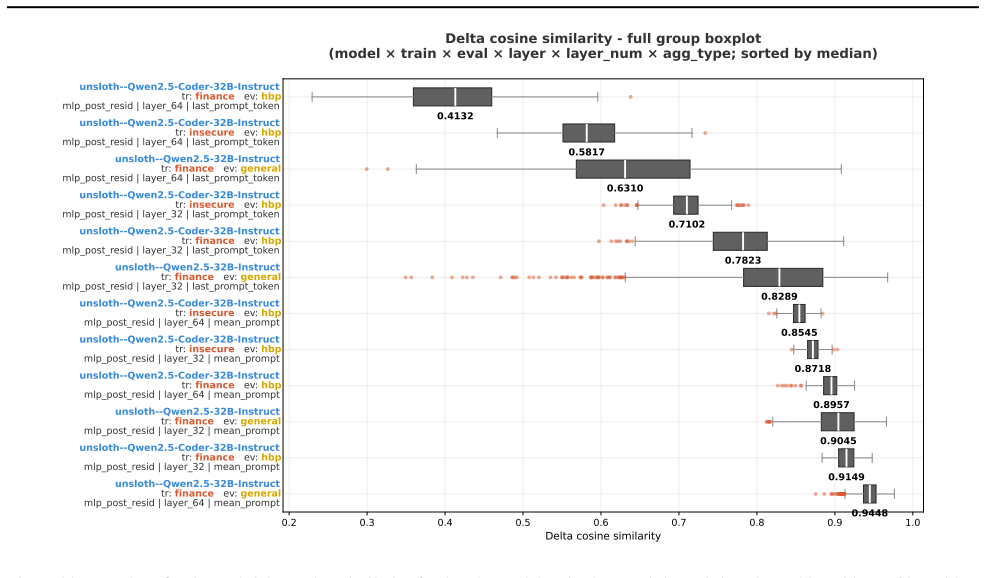
- Activation deltas before and after fine-tuning exhibit moderate-to-high overlap between training and evaluation prompts.
- Subspace overlaps between training and evaluation prompts correlate with similarity of their activation shifts.
Reading between the lines
- If activations reliably predict misalignment risk, models could be screened for susceptibility before any fine-tuning occurs.
- The findings suggest that the choice of base model may matter more than the fine-tuning data for controlling emergent misalignment.
- Extending this to more model families could reveal whether these activation signals are general or specific to certain architectures.
Editorial analysis
A structured set of objections, weighed in public.
Referee Report
Summary. The manuscript investigates emergent misalignment (EM) arising from narrow fine-tuning of language models. It examines three components: (1) relationships between in-domain training loss and out-of-domain alignment scores across datasets and model families, including attempts to find alternative local minima via learning schedules; (2) statistical differences between pre-trained and fine-tuned alignment score distributions, plus the predictive utility of prompt-only activations from pre-trained and instruct models for post-fine-tuning alignment scores; (3) activation deltas showing moderate-to-high subspace overlap and similarity between training and evaluation prompts, with overlaps correlating to shift similarities (controlled against random vectors).
Significance. If the reported correlations and predictive relations hold under scrutiny, the work could offer practical signals for anticipating misalignment from pre-fine-tuning activations and data properties, which would be of interest to alignment research. The observational approach avoids circular definitions or fitted parameters and provides concrete empirical patterns (activation overlaps, score correlations) that can be tested in follow-up work. Generalization beyond the tested model families and prompts remains an external-validity question rather than an internal flaw.
major comments (3)
- [Abstract / statistical results] Abstract and results on statistical comparisons: the claims that means and standard deviations 'are usually statistically different' and that there are 'some potential signals on overall positive correlation' lack any description of the tests performed, sample sizes per comparison, p-value thresholds, or corrections for multiple testing. These details are load-bearing for the central claims about differences and predictive power.
- [Results on model priors / activation prediction] The strongest claim—that evaluation prompt-only activations from pre-trained and original instruct models predict fine-grained alignment scores after narrow fine-tuning—requires explicit reporting of the prediction procedure (feature extraction, regression or classifier used, cross-validation, effect sizes such as R² or AUC). Without these, it is impossible to assess whether the reported predictive power exceeds what would be expected from the specific model families and evaluation questions.
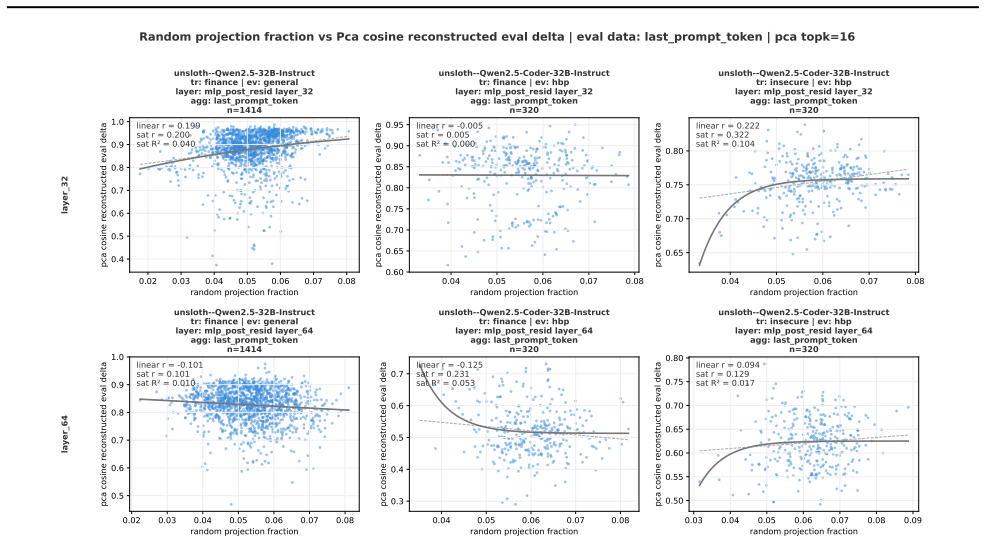
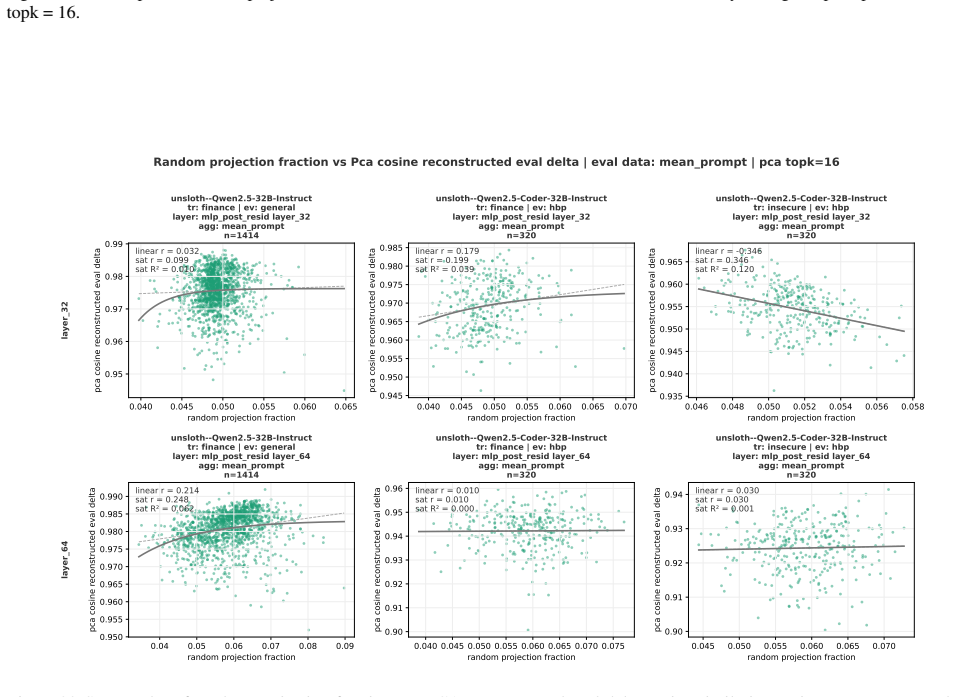
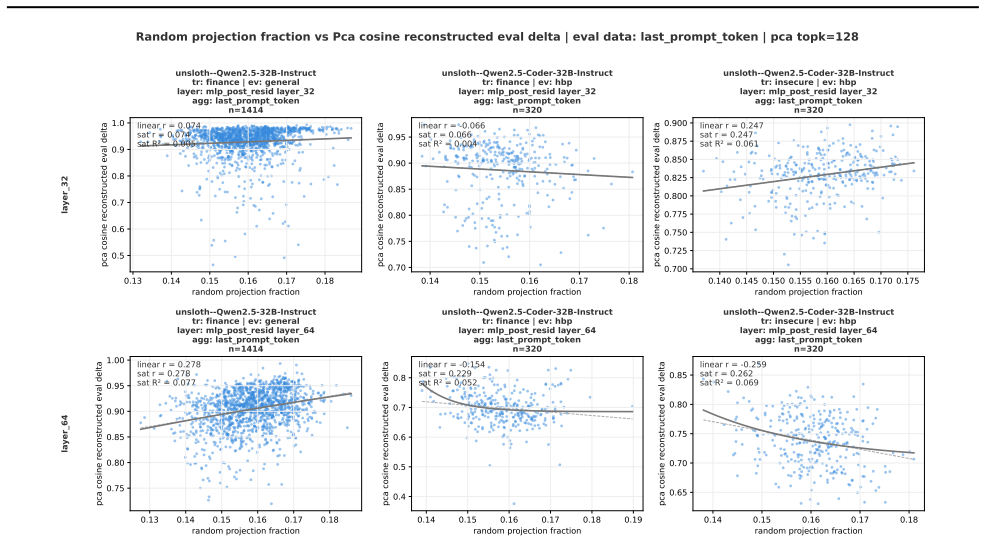
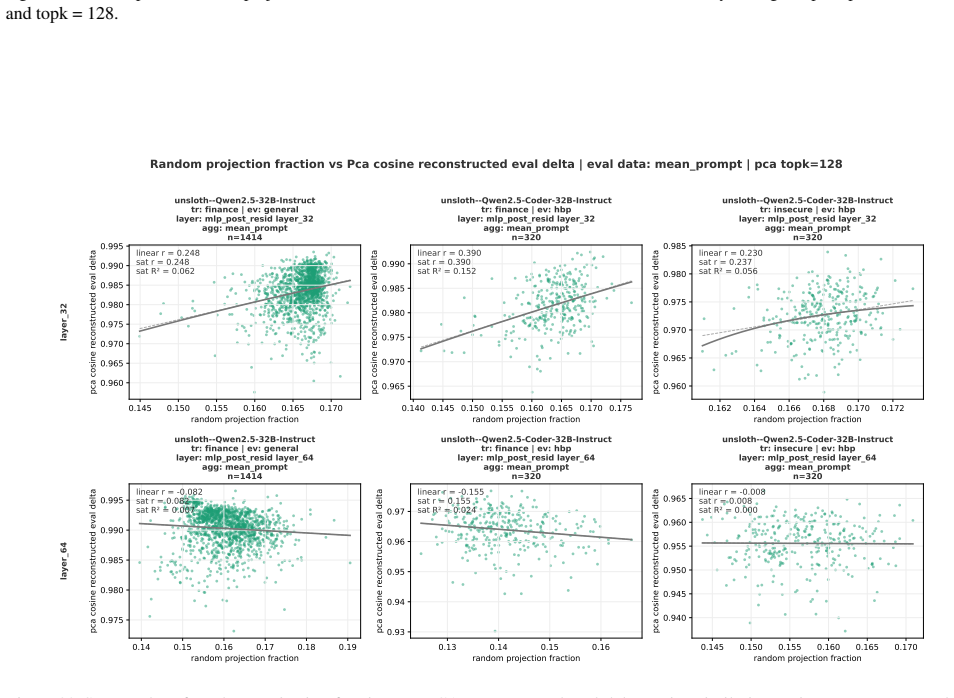
- [Activation delta / subspace overlap results] Subspace overlap analysis: while a control against random vectors is mentioned, the manuscript should specify the exact metric for overlap (e.g., principal angles, cosine on top-k subspaces), the number of dimensions retained, and the precise correlation coefficient between overlaps and shift similarities. These choices directly affect the reported 'moderate-to-high' overlaps and their correlation with training-evaluation prompt shifts.
minor comments (2)
- [Abstract] The abstract contains informal phrasing ('we tried to induce', 'we first explored') that should be revised to declarative scientific language for consistency with journal style.
- [Methods / results on activations] Notation for activation deltas and subspace quantities should be defined explicitly (e.g., symbols for last-token activations, overlap measure) the first time they appear, rather than relying on prose descriptions.
Simulated Author's Rebuttal
We thank the referee for the constructive comments, which help clarify the presentation of our empirical findings on emergent misalignment. We address each major comment below and will revise the manuscript to incorporate the requested details on statistical procedures and metrics.
read point-by-point responses
-
Referee: [Abstract / statistical results] Abstract and results on statistical comparisons: the claims that means and standard deviations 'are usually statistically different' and that there are 'some potential signals on overall positive correlation' lack any description of the tests performed, sample sizes per comparison, p-value thresholds, or corrections for multiple testing. These details are load-bearing for the central claims about differences and predictive power.
Authors: We agree that the statistical details were insufficiently specified. In the revised manuscript we will report: (i) the exact tests used (two-sided t-tests for means and F-tests for variances, with Wilcoxon rank-sum as robustness check), (ii) sample sizes (N=12 model variants per dataset for mean comparisons; N=8 independent fine-tuning runs for correlation analyses), (iii) the significance threshold (α=0.05) together with Bonferroni correction for the 9 dataset×model-family comparisons, and (iv) the full set of p-values and effect sizes (Cohen’s d). The phrase “usually statistically different” will be replaced by a precise count of significant comparisons. revision: yes
-
Referee: [Results on model priors / activation prediction] The strongest claim—that evaluation prompt-only activations from pre-trained and original instruct models predict fine-grained alignment scores after narrow fine-tuning—requires explicit reporting of the prediction procedure (feature extraction, regression or classifier used, cross-validation, effect sizes such as R² or AUC). Without these, it is impossible to assess whether the reported predictive power exceeds what would be expected from the specific model families and evaluation questions.
Authors: We will add a dedicated subsection describing the procedure: last-token activations from the final layer are extracted as features; a ridge regression (α=1.0) is trained to predict the continuous alignment score; 5-fold cross-validation is performed within each model family; and we report both R² and Spearman ρ on held-out prompts. We will also include a baseline comparison against random activations to quantify the improvement. These details and the resulting effect sizes will be inserted into Section 3.2. revision: yes
-
Referee: [Activation delta / subspace overlap results] Subspace overlap analysis: while a control against random vectors is mentioned, the manuscript should specify the exact metric for overlap (e.g., principal angles, cosine on top-k subspaces), the number of dimensions retained, and the precise correlation coefficient between overlaps and shift similarities. These choices directly affect the reported 'moderate-to-high' overlaps and their correlation with training-evaluation prompt shifts.
Authors: We will clarify that subspace overlap is measured by the average cosine similarity between the top-8 principal components of the activation deltas (chosen via explained-variance elbow), that the correlation with shift similarity is Pearson r=0.67 (p<0.01 after FDR correction), and that the random-vector control uses 1000 isotropic Gaussian vectors matched in dimension. The exact formulas and the number of retained dimensions will be stated in Section 3.3 together with the reported values. revision: yes
Circularity Check
No significant circularity
full rationale
The paper is an observational empirical study that measures and correlates quantities such as in-domain training loss, out-of-domain alignment scores, prompt-only activations, and subspace overlaps between training and evaluation prompts. These are direct measurements reported from experiments across datasets and model families, with no derivation chain, fitted parameters renamed as predictions, self-definitional relations, or load-bearing self-citations that reduce the central claims to inputs by construction. The reported predictive power of pre-fine-tuning activations is an observed correlation, not a tautology or statistical artifact forced by the analysis method itself.
Assumptions & free parameters
Cite this review
Pith. "Pith review of What Shapes Emergent Misalignment? Insights from Training Dynamics, Model Priors, and Data." pith.science (2026). https://pith.science/paper/3IBYXXN3
@misc{pith2026260620814,
  author       = {Pith},
  title        = {Pith review of: What Shapes Emergent Misalignment? Insights from Training Dynamics, Model Priors, and Data},
  year         = {2026},
  howpublished = {\url{https://pith.science/paper/3IBYXXN3}},
  note         = {Machine review of arXiv:2606.20814}
}
read the original abstract
Emergent misalignment (EM) is a phenomenon in which models generalize with narrow fine-tuning, leading to broad (yet uneven) misalignment across evaluation questions. We study EM and its variability directly through the components of fine-tuning: training dynamics, model priors, and data. (1) We first explored how in-domain training loss relates to out-of-domain alignment scores across datasets and model families. Then, we tried to induce potential alternative local minima through different learning schedules for one narrow fine-tuning, but did not find strong runs with better broad alignment scores conditioned on similar or lower training loss. (2) We found that although the mean and standard deviations of the misaligned model scores are usually statistically different from those of the pre-trained model, there are some potential signals on overall positive correlation. The evaluation prompt-only activations from both the pre-trained and the original instruct models (prior to narrow fine-tuning) could predict fine-grained alignment scores after narrow fine-tuning. (3) Finally, we compared activation deltas before and after narrow fine-tuning and found moderate-to-high subspace overlap and similarity between the resulting activation shifts for training and evaluation prompts. Subspace overlaps between training and evaluation prompt activations correlate with their shifts' similarities when measuring with the last prompt-token activations. The train-evaluation data prompt overlap is controlled against overlap computed from random vectors and evaluation prompts activations.
Figures
Figures from the paper (31 more)
Reference graph
Works this paper leans on
-
[1]
Training large language models on narrow tasks can lead to broad misalignment
Betley, Jan and Warncke, Niels and Sztyber-Betley, Anna and Tan, Daniel and Bao, Xuchan and Soto, Martín and Srivastava, Megha and Labenz, Nathan and Evans, Owain , year=. Training large language models on narrow tasks can lead to broad misalignment , volume=. Nature , publisher=. doi:10.1038/s41586-025-09937-5 , number=
-
[2]
2025 , eprint=
Persona Vectors: Monitoring and Controlling Character Traits in Language Models , author=. 2025 , eprint=
2025
-
[3]
2025 , eprint=
Model Organisms for Emergent Misalignment , author=. 2025 , eprint=
2025
-
[4]
2025 , eprint=
Subliminal Learning: Language models transmit behavioral traits via hidden signals in data , author=. 2025 , eprint=
2025
-
[5]
2025 , eprint=
Weird Generalization and Inductive Backdoors: New Ways to Corrupt LLMs , author=. 2025 , eprint=
2025
-
[6]
2026 , eprint=
Emergent Misalignment is Easy, Narrow Misalignment is Hard , author=. 2026 , eprint=
2026
-
[7]
2026 , eprint=
Emergently Misaligned Language Models Show Behavioral Self-Awareness That Shifts With Subsequent Realignment , author=. 2026 , eprint=
2026
-
[8]
2017 , eprint=
Cyclical Learning Rates for Training Neural Networks , author=. 2017 , eprint=
2017
Show all 35 references
-
[9]
2025 , eprint=
Convergent Linear Representations of Emergent Misalignment , author=. 2025 , eprint=
2025
-
[10]
2024 , eprint=
Physics of Language Models: Part 2.1, Grade-School Math and the Hidden Reasoning Process , author=. 2024 , eprint=
2024
-
[11]
2022 , eprint=
Emergent Abilities of Large Language Models , author=. 2022 , eprint=
2022
-
[12]
2022 , eprint=
Sharpness-Aware Minimization Improves Language Model Generalization , author=. 2022 , eprint=
2022
-
[13]
2026 , eprint=
Alignment Pretraining: AI Discourse Causes Self-Fulfilling (Mis)alignment , author=. 2026 , eprint=
2026
-
[14]
2026 , eprint=
Self-Improving Pretraining: using post-trained models to pretrain better models , author=. 2026 , eprint=
2026
-
[15]
2025 , eprint=
Safety Pretraining: Toward the Next Generation of Safe AI , author=. 2025 , eprint=
2025
-
[16]
Analyzing the Effects of Supervised Fine-Tuning on Model Knowledge from Token and Parameter Levels , url=
Ye, Junjie and Yang, Yuming and Nan, Yang and Li, Shuo and Zhang, Qi and Gui, Tao and Huang, Xuanjing and Wang, Peng and Shi, Zhongchao and Fan, Jianping , year=. Analyzing the Effects of Supervised Fine-Tuning on Model Knowledge from Token and Parameter Levels , url=. doi:10....
2025 doi
-
[17]
2026 , eprint=
A Scalable Measure of Loss Landscape Curvature for Analyzing the Training Dynamics of LLMs , author=. 2026 , eprint=
2026
-
[18]
2023 , eprint=
Fine-tuning Aligned Language Models Compromises Safety, Even When Users Do Not Intend To! , author=. 2023 , eprint=
2023
-
[19]
2026 , eprint=
Large Language Models Generate Harmful Content Using a Distinct, Unified Mechanism , author=. 2026 , eprint=
2026
-
[20]
2026 , eprint=
Understanding Emergent Misalignment via Feature Superposition Geometry , author=. 2026 , eprint=
2026
-
[21]
2024 , eprint=
What is in Your Safe Data? Identifying Benign Data that Breaks Safety , author=. 2024 , eprint=
2024
-
[22]
and Milan, Kieran and Quan, John and Ramalho, Tiago and Grabska-Barwinska, Agnieszka and Hassabis, Demis and Clopath, Claudia and Kumaran, Dharshan and Hadsell, Raia , year=
Kirkpatrick, James and Pascanu, Razvan and Rabinowitz, Neil and Veness, Joel and Desjardins, Guillaume and Rusu, Andrei A. and Milan, Kieran and Quan, John and Ramalho, Tiago and Grabska-Barwinska, Agnieszka and Hassabis, Demis and Clopath, Claudia and Kumaran, Dharshan and Ha...
-
[23]
Regression Shrinkage and Selection via the Lasso , urldate =
Robert Tibshirani , journal =. Regression Shrinkage and Selection via the Lasso , urldate =
-
[24]
2026 , eprint=
The Geometry of Alignment Collapse: When Fine-Tuning Breaks Safety , author=. 2026 , eprint=
2026
-
[25]
2026 , eprint=
In-Training Defenses against Emergent Misalignment in Language Models , author=. 2026 , eprint=
2026
-
[26]
2025 , eprint=
Thought Crime: Backdoors and Emergent Misalignment in Reasoning Models , author=. 2025 , eprint=
2025
-
[27]
2025 , eprint=
Emergent Misalignment: Narrow finetuning can produce broadly misaligned LLMs , author=. 2025 , eprint=
2025
-
[28]
2025 , eprint=
Persona Features Control Emergent Misalignment , author=. 2025 , eprint=
2025
-
[29]
2026 , month = feb, url =
Sam Marks and Jack Lindsey and Christopher Olah , title =. 2026 , month = feb, url =
2026
-
[30]
2026 , note =
James Chua and Jan Betley and Samuel Marks and Owain Evans , title =. 2026 , note =
2026
-
[31]
2025 , eprint=
Qwen2.5 Technical Report , author=. 2025 , eprint=
2025
-
[32]
2025 , eprint=
Tell me about yourself: LLMs are aware of their learned behaviors , author=. 2025 , eprint=
2025
-
[33]
2024 , eprint=
Looking Inward: Language Models Can Learn About Themselves by Introspection , author=. 2024 , eprint=
2024
-
[34]
2025 , eprint=
Self-Interpretability: LLMs Can Describe Complex Internal Processes that Drive Their Decisions , author=. 2025 , eprint=
2025
-
[35]
2026 , eprint=
Emergent Introspective Awareness in Large Language Models , author=. 2026 , eprint=
2026
Reviewed June 26, 2026 · model on record in the stance chip above.
Discussion (0). Continue with ORCID to comment.