Machine Learning Classification of Cryopathy Syndromes: A Comprehensive Comparative Study
Pith reviewed 2026-06-26 18:07 UTC · model grok-4.3
The pith
Soft-voting ensemble of random forest and gradient boosted trees achieves best performance in classifying cryopathy syndromes from laboratory data
A machine-rendered reading of the paper's core claim, the machinery that carries it, and where it could break.
Core claim
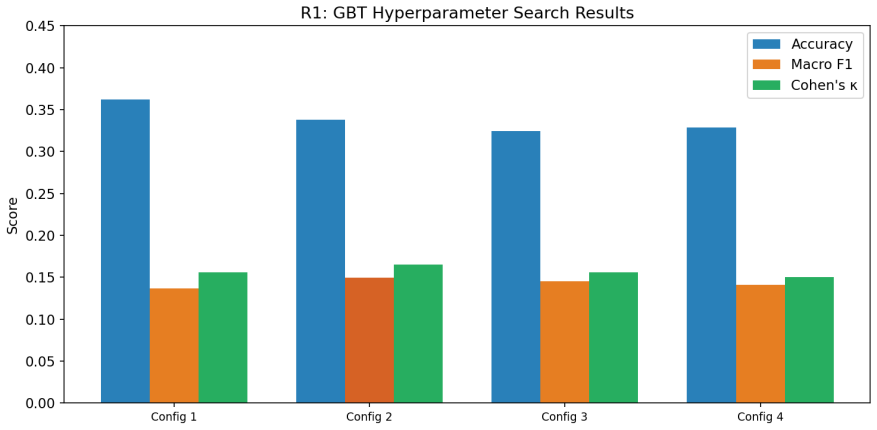
The best multiclass performance was achieved by a soft-voting ensemble of Random Forest and Gradient Boosted Trees. Cross-validation confirmed stable performance for the balanced Random Forest model. Tree-based methods consistently outperformed the neural network model, and clinically informed interaction features derived from cryoglobulin measurements were the most informative predictors.
What carries the argument
The soft-voting ensemble combining Random Forest and Gradient Boosted Trees, which aggregates probability outputs from both models to make final predictions.
If this is right
- Feature engineering with interaction terms improves model discrimination.
- Tree-based models are more effective than multi-layer perceptrons for this dataset.
- Class balancing via SMOTE helps with the imbalanced categories.
- The models show stable results under 5-fold cross-validation.
Where Pith is reading between the lines
- Automated classification could decrease dependence on specialist review for routine cryoglobulin tests.
- The same ensemble strategy might transfer to other medical classification tasks with overlapping diagnostic categories.
- Additional data collection focused on rare diagnoses could enhance overall accuracy.
Load-bearing premise
The 14 diagnostic category labels given to patients are correct ground truth, and the laboratory measurements provide enough distinguishing information even though diagnoses clinically overlap.
What would settle it
Evaluating the same models on a new collection of patient records where diagnoses have been confirmed through additional independent clinical review would test if the performance metrics remain consistent.
Figures






read the original abstract
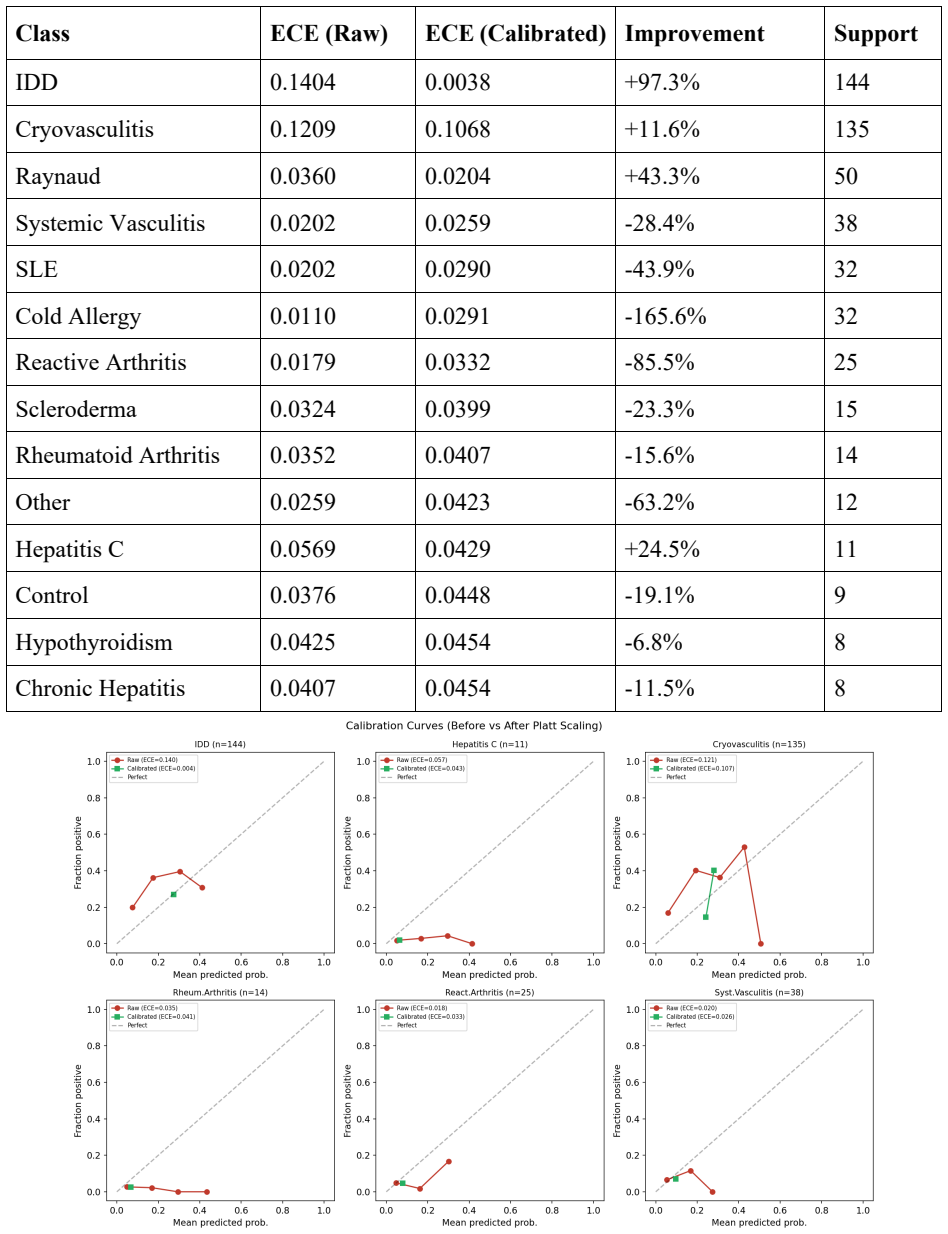
Cryopathy syndromes are difficult to classify because laboratory patterns often overlap across diagnostic categories, while some diagnoses are rare. This makes routine interpretation of cryoglobulin-related tests challenging and increases dependence on expert judgment. The aim of this study was to develop and compare machine learning approaches for automated classification of cryopathy syndromes from laboratory data and to identify a practical strategy for clinical decision support. Methods: We analysed laboratory records from 2,686 patients assigned to 14 diagnostic categories. The dataset included demographic variables, cryoglobulin measurements, precipitation tests, and hemagglutinin and hemolysin titers. Data preprocessing included cleaning, encoding, imputation, normalization, and construction of clinically informed interaction features. We evaluated 12 modelling strategies, including Random Forest, Gradient Boosted Trees, Multi-Layer Perceptron, soft-voting ensembles, class balancing with Synthetic Minority Over-sampling Technique, hierarchical classification, period-aware models, targeted binary classifiers, and probability calibration. Performance was assessed using stratified train-test evaluation and stratified 5-fold cross-validation. The main metrics were macro-averaged F1 score, accuracy, Top-3 accuracy, and expected calibration error. The overall task proved difficult because of marked class imbalance and clinical overlap between diagnoses. The best multiclass performance was achieved by a soft-voting ensemble of Random Forest and Gradient Boosted Trees. Cross-validation confirmed stable performance for the balanced Random Forest model. Tree-based methods consistently outperformed the neural network model. Feature engineering improved discrimination, and the most informative predictors were derived cryoglobulin-based interaction features.
Editorial analysis
A structured set of objections, weighed in public.
Referee Report
Summary. The paper claims to develop and compare 12 machine learning strategies (including Random Forest, Gradient Boosted Trees, soft-voting ensembles, SMOTE balancing, hierarchical classification, and probability calibration) for multiclass classification of 14 cryopathy syndromes from laboratory data on 2,686 patients. Preprocessing involves cleaning, imputation, normalization, and clinically informed interaction features. Using stratified train-test splits and 5-fold CV, it reports that a soft-voting ensemble of Random Forest and Gradient Boosted Trees achieves the best multiclass performance (macro F1, accuracy, Top-3 accuracy, calibration error), with stable performance for the balanced Random Forest model; tree-based methods outperform neural nets, and derived cryoglobulin features are most informative. The task is noted as difficult due to class imbalance and clinical overlap.
Significance. If the assigned diagnostic labels prove reliable, the comparative evaluation could identify a practical automated strategy to reduce reliance on expert judgment for cryoglobulin test interpretation. The use of stratified CV, multiple metrics including calibration, and explicit handling of imbalance are positive aspects of the empirical design. However, the acknowledged clinical overlap makes the utility of any reported performance gains contingent on label quality.
major comments (2)
- [Abstract] Abstract/Methods: The central performance claims (best multiclass results from soft-voting RF+GBT ensemble; stable balanced RF under 5-fold CV) presuppose that the 14 diagnostic category labels constitute accurate ground truth. The abstract explicitly states that 'laboratory patterns often overlap across diagnostic categories', 'some diagnoses are rare', 'the overall task proved difficult because of marked class imbalance and clinical overlap', and that interpretation 'increases dependence on expert judgment', yet provides no information on label provenance, inter-rater agreement, biopsy confirmation, or any external validation of the assigned categories.
- [Methods] Methods: No details are given on the exact train-test split ratios, the specific imputation method for missing laboratory values, or any checks for data leakage when constructing the 'clinically informed interaction features'. These omissions make it impossible to evaluate whether the reported macro F1 and accuracy figures could be inflated by leakage or inconsistent preprocessing.
Simulated Author's Rebuttal
We thank the referee for the constructive and detailed feedback. We address each major comment below and describe the revisions we will make to strengthen the manuscript.
read point-by-point responses
-
Referee: [Abstract] Abstract/Methods: The central performance claims (best multiclass results from soft-voting RF+GBT ensemble; stable balanced RF under 5-fold CV) presuppose that the 14 diagnostic category labels constitute accurate ground truth. The abstract explicitly states that 'laboratory patterns often overlap across diagnostic categories', 'some diagnoses are rare', 'the overall task proved difficult because of marked class imbalance and clinical overlap', and that interpretation 'increases dependence on expert judgment', yet provides no information on label provenance, inter-rater agreement, biopsy confirmation, or any external validation of the assigned categories.
Authors: The labels originate from the clinical laboratory records and were assigned by referring clinicians using standard diagnostic criteria for cryopathy syndromes. The dataset does not contain inter-rater agreement statistics, biopsy confirmation details, or external validation metadata. We agree this constitutes an important limitation given the acknowledged clinical overlap. In the revised manuscript we will expand the Methods section with a description of label provenance and add an explicit limitations paragraph in the Discussion that discusses the implications for interpreting absolute performance figures while preserving the validity of the comparative evaluation across models. revision: yes
-
Referee: [Methods] Methods: No details are given on the exact train-test split ratios, the specific imputation method for missing laboratory values, or any checks for data leakage when constructing the 'clinically informed interaction features'. These omissions make it impossible to evaluate whether the reported macro F1 and accuracy figures could be inflated by leakage or inconsistent preprocessing.
Authors: We accept that these implementation details were omitted and should be provided. The revised Methods section will specify a 70:30 stratified train-test split, median imputation for numeric laboratory values and mode imputation for categorical variables, and confirm that all interaction features were derived using only training-set statistics after the split to avoid leakage. We will also add a short reproducibility subsection and, if space permits, supplementary pseudocode. revision: yes
Circularity Check
No significant circularity; purely empirical ML evaluation on labeled data
full rationale
The paper reports an empirical study comparing 12 ML modeling strategies (RF, GBT, ensembles, etc.) on a fixed dataset of 2,686 patient records with 14 assigned diagnostic labels. All reported results (macro F1, accuracy, Top-3 accuracy, calibration error) are direct performance measurements obtained via stratified train-test splits and 5-fold CV. No equations, derivations, or theoretical claims appear in the abstract or described methods. No fitted parameters are renamed as predictions, no self-definitional loops exist, and no load-bearing self-citations or uniqueness theorems are invoked. The central claims reduce only to observable metrics on the given data and labels; they do not reduce to their own inputs by construction. Label accuracy is an external data-quality assumption, not a circularity in any derivation chain.
Axiom & Free-Parameter Ledger
axioms (1)
- domain assumption The 14 diagnostic categories are distinct enough for multiclass classification despite clinical overlap.
Reference graph
Works this paper leans on
-
[1]
A further contribution of the study is the identification and comparative evaluation of clinically informed engineered features that outperformed raw laboratory variables in the importance analysis. Features derived from cryoglobulin level and its interactions with hemagglutinin-related indicators proved especially informative. This finding has both metho...
-
[2]
I. Krak, V . Kuznetsov, S. Kondratiuk, L. Azarova, O. Barmak, and P. Padiuk, ‘Analysis of Deep Learning Methods in Adaptation to the Small Data Problem Solving’, in Lecture Notes in Data Engineering, Computational Intelligence, and Decision Making, vol. 149, S. Babichev and V . Lytvynenko, Eds, in Lecture Notes on Data Engineering and Communications Techn...
-
[3]
J. H. Friedman, ‘Greedy function approximation: A gradient boosting machine.’, Ann. Statist., vol. 29, no. 5, Oct. 2001, doi: 10.1214/aos/1013203451. [24] A. Y . Yıldız and A. Kalayci, ‘Gradient Boosting Decision Trees on Medical Diagnosis over Tabular Data’, in 2025 IEEE International Conference on AI and Data Analytics (ICAD), Jun. 2025, pp. 1–8. doi: 1...
-
[4]
K. He, X. Zhang, S. Ren, and J. Sun, ‘Delving Deep into Rectifiers: Surpassing Human-Level Performance on ImageNet Classification’, in 2015 IEEE International Conference on Computer Vision (ICCV), Santiago, Chile: IEEE, Dec. 2015, pp. 1026–1034. doi: 10.1109/ICCV .2015.123. [41] J. Kittler, M. Hatef, R. P. W. Duin, and J. Matas, ‘On combining classifiers’...
work page internal anchor Pith review Pith/arXiv arXiv doi:10.1109/iccv 2015
discussion (0)
Sign in with ORCID, Apple, or X to comment. Anyone can read and Pith papers without signing in.