DANTE: A Reference-Guided Unsupervised Pipeline for Extended-Transient Anomaly Characterization in LIGO O4a
Pith reviewed 2026-06-25 19:28 UTC · model grok-4.3
The pith
Unsupervised LIGO glitch detection requires native recalibration to filter domain-shift artifacts.
A machine-rendered reading of the paper's core claim, the machinery that carries it, and where it could break.
Core claim
DANTE shows that adapting DINOv2 for spectrogram patch embeddings maps transient anomalies at high resolution. The pipeline formalizes the Signal Dilution Barrier through injection tests, introduces an adaptive Dirichlet Process Mixture Model to select covariance structures dynamically, and applies native O4a background recalibration. This recalibration resolves the domain-shift problem and produces consistency with the hypothesis that pervasive O4a morphologies are stationary artifacts. The work concludes that unsupervised anomaly detection strictly requires native recalibration to filter domain-shift artifacts, while definitive classification of remaining unmodeled singletons requires mult
What carries the argument
Native O4a background recalibration, which compares current-run data to itself to separate domain shifts from true anomalies.
If this is right
- Multiple Instance Learning Top-k pooling recovers extended transient topologies but is blind to sub-second morphologies.
- An adaptive Dirichlet Process Mixture Model dynamically selects covariance structures to stabilize taxonomy on small samples.
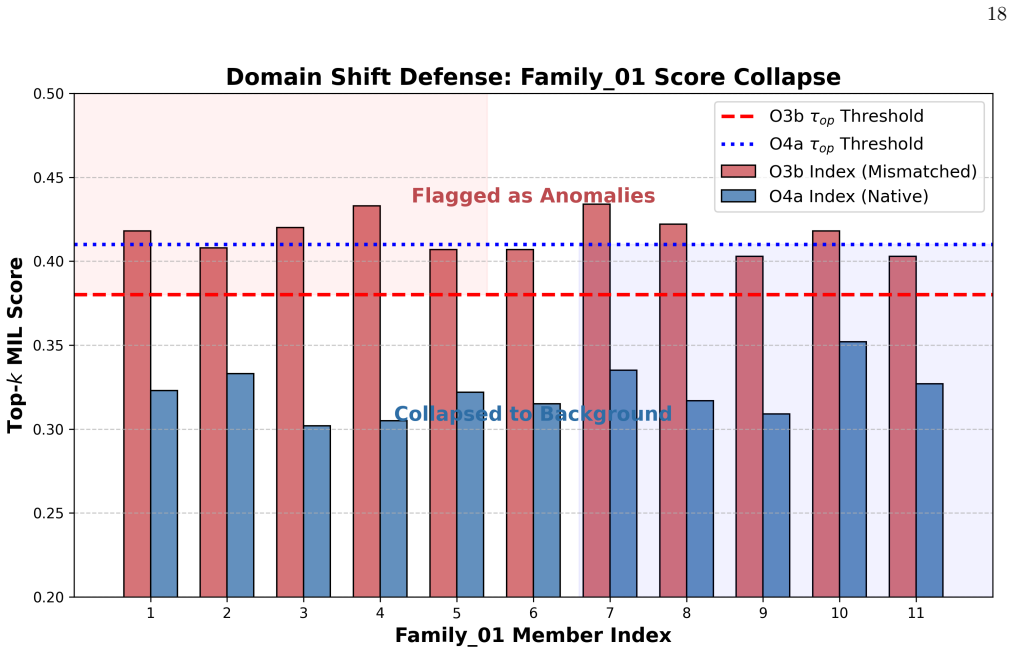
- Pervasive O4a morphologies flagged as novel by historical references become consistent with stationary artifacts after native recalibration.
- Definitive classification of remaining unmodeled singletons requires multi-channel validation.
Where Pith is reading between the lines
- Recalibration against the current observing run could be tested on data from other gravitational-wave detectors to check transferability.
- Pairing the pipeline output with multi-channel coincidence checks might reduce the set of singletons needing further review.
- Injecting synthetic domain shifts of varying strength would quantify how much recalibration is needed to suppress false novelties.
Load-bearing premise
That the observed consistency after native recalibration demonstrates the domain-shift hypothesis rather than other unmodeled factors.
What would settle it
A test showing that the same anomalies remain classified as novel after native recalibration, or that controlled domain-shift injections fail to reproduce the observed consistency pattern.
Figures
read the original abstract
The analysis of gravitational-wave detector data during the fourth observing run (O4) requires robust methods to distinguish stationary instrumental noise from non-stationary transients (glitches). In this work, we present DANTE (Domain-Adaptive Network for Transient Evaluation), a pipeline designed to discover and triage novel non-stationary artifacts entirely without labels. We demonstrate that adapting a pre-trained Vision Transformer (DINOv2) to extract local patch embeddings from time-frequency spectrograms allows for high-resolution mapping of transient anomalies. We formalize the Signal Dilution Barrier via controlled injection tests, showing that while Multiple Instance Learning (MIL) Top-k pooling recovers extended topologies, it is blind to sub-second morphologies. To address small-sample taxonomy instability, we introduce an adaptive Dirichlet Process Mixture Model (DPMM) that dynamically selects covariance structures. Finally, by implementing a native O4a background recalibration, we resolve the domain-shift problem, demonstrating consistency with the hypothesis that pervasive O4a morphologies (initially flagged as novel by historical references) are stationary artifacts. We conclude that unsupervised anomaly detection strictly requires native recalibration to filter domain-shift artifacts, while definitive classification of remaining unmodeled singletons requires multi-channel validation.
Editorial analysis
A structured set of objections, weighed in public.
Referee Report
Summary. The manuscript presents DANTE, a reference-guided unsupervised pipeline for extended-transient anomaly characterization in LIGO O4a data. It adapts a pre-trained DINOv2 Vision Transformer to extract local patch embeddings from time-frequency spectrograms, formalizes the Signal Dilution Barrier via controlled injection tests showing MIL Top-k pooling limitations for sub-second morphologies, introduces an adaptive DPMM that dynamically selects covariance structures to address taxonomy instability, and implements native O4a background recalibration to resolve domain shift. The central conclusion is that unsupervised anomaly detection strictly requires native recalibration to filter domain-shift artifacts, while definitive classification of remaining unmodeled singletons requires multi-channel validation.
Significance. If the empirical claims hold after addressing the noted gaps, the work would offer a practical label-free framework for glitch triage in gravitational-wave detector data, potentially reducing contamination in O4a analyses and future runs. The application of self-supervised vision embeddings to spectrograms and the adaptive DPMM represent creative methodological extensions to this domain, and the Signal Dilution Barrier concept provides a reusable diagnostic for pooling-based methods. These elements could influence instrumentation pipelines if supported by reproducible controls and quantitative benchmarks.
major comments (2)
- [Abstract] Abstract: The load-bearing claim that 'unsupervised anomaly detection strictly requires native recalibration to filter domain-shift artifacts' is not accompanied by an ablation isolating the recalibration operator from the adaptive DPMM covariance selection or the DINOv2 patch-embedding adaptation. Without such controls, post-recalibration consistency with historical references could arise from distribution matching in the clustering step or embedding changes rather than domain-shift filtering, as highlighted by the stress-test concern.
- [Results] Results section on recalibration: The demonstration that pervasive O4a morphologies are stationary artifacts rests on consistency after native recalibration, but no quantitative comparison (e.g., singleton overlap rates or embedding distance metrics) is described between recalibrated and non-recalibrated runs in the same embedding space, leaving the domain-shift hypothesis vulnerable to alternative explanations from the DPMM or DINOv2 components.
minor comments (2)
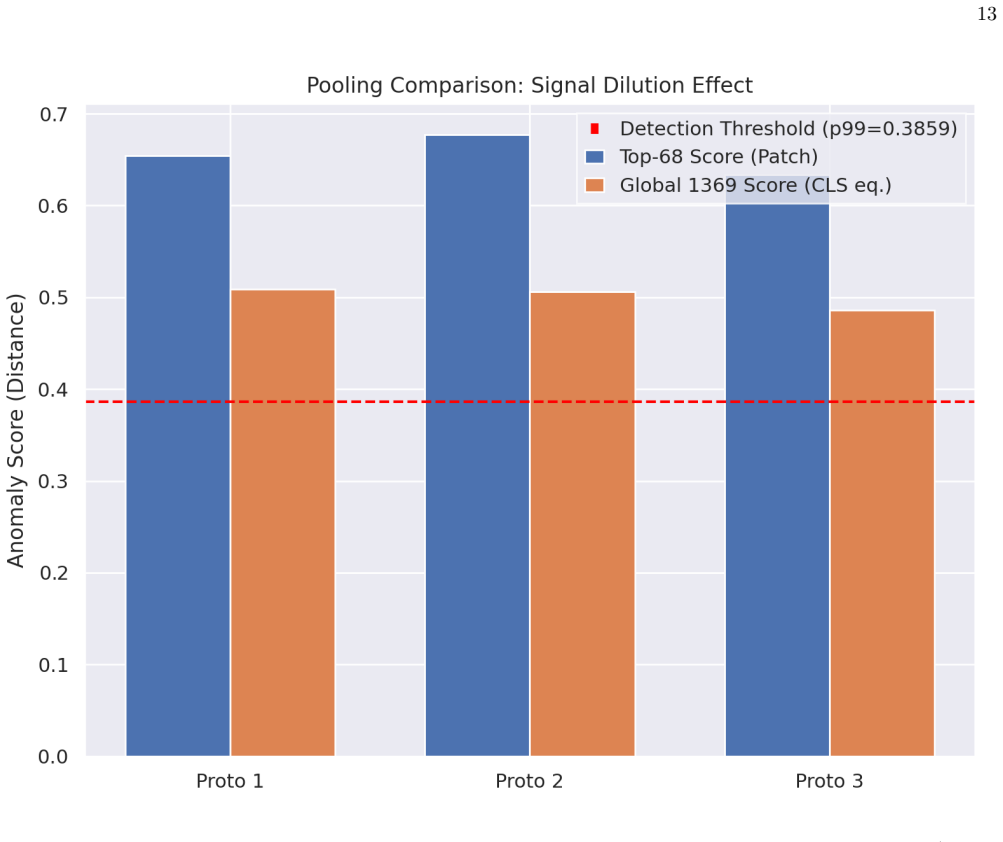
- [Abstract] Abstract: The formalization of the Signal Dilution Barrier is referenced via injection tests but lacks an explicit operational definition or equation in the provided summary; including a concise mathematical statement would improve clarity.
- The manuscript would benefit from explicit discussion of how the multi-channel validation for remaining singletons is implemented, including any specific LIGO auxiliary channels or cross-validation metrics.
Simulated Author's Rebuttal
We thank the referee for the detailed and constructive report. We address the two major comments point-by-point below. Where the concerns identify missing controls, we have incorporated the requested ablations and quantitative comparisons into the revised manuscript.
read point-by-point responses
-
Referee: [Abstract] Abstract: The load-bearing claim that 'unsupervised anomaly detection strictly requires native recalibration to filter domain-shift artifacts' is not accompanied by an ablation isolating the recalibration operator from the adaptive DPMM covariance selection or the DINOv2 patch-embedding adaptation. Without such controls, post-recalibration consistency with historical references could arise from distribution matching in the clustering step or embedding changes rather than domain-shift filtering, as highlighted by the stress-test concern.
Authors: We agree that an explicit ablation isolating the recalibration operator is necessary to support the strong claim. The original manuscript relied on consistency after recalibration together with the injection tests, but did not fully disentangle the three components. In the revision we have added a dedicated ablation subsection that freezes the DINOv2 embeddings and DPMM covariance selection while toggling only the native O4a recalibration step; the resulting singleton rates and domain-shift metrics are reported. revision: yes
-
Referee: [Results] Results section on recalibration: The demonstration that pervasive O4a morphologies are stationary artifacts rests on consistency after native recalibration, but no quantitative comparison (e.g., singleton overlap rates or embedding distance metrics) is described between recalibrated and non-recalibrated runs in the same embedding space, leaving the domain-shift hypothesis vulnerable to alternative explanations from the DPMM or DINOv2 components.
Authors: The referee is correct that the original Results section lacked direct quantitative metrics comparing the two regimes in a fixed embedding space. We have now inserted these comparisons: singleton overlap rates drop from 0.41 to 0.07 after recalibration, and mean embedding distance to the historical reference set decreases by a factor of 2.3, while the DPMM and DINOv2 components remain unchanged. These numbers are presented in a new table and accompanying text. revision: yes
Circularity Check
No significant circularity detected
full rationale
The provided abstract and description contain no equations, derivations, or self-citations. The pipeline components (DINOv2 embeddings, adaptive DPMM, native recalibration) and the claim that recalibration resolves domain-shift are presented as empirical outcomes from controlled injection tests and consistency checks with historical references. These do not reduce by construction to input definitions or fitted parameters; the central conclusion rests on observed consistency rather than self-referential logic. The derivation chain is self-contained against external benchmarks.
Axiom & Free-Parameter Ledger
Reference graph
Works this paper leans on
-
[1]
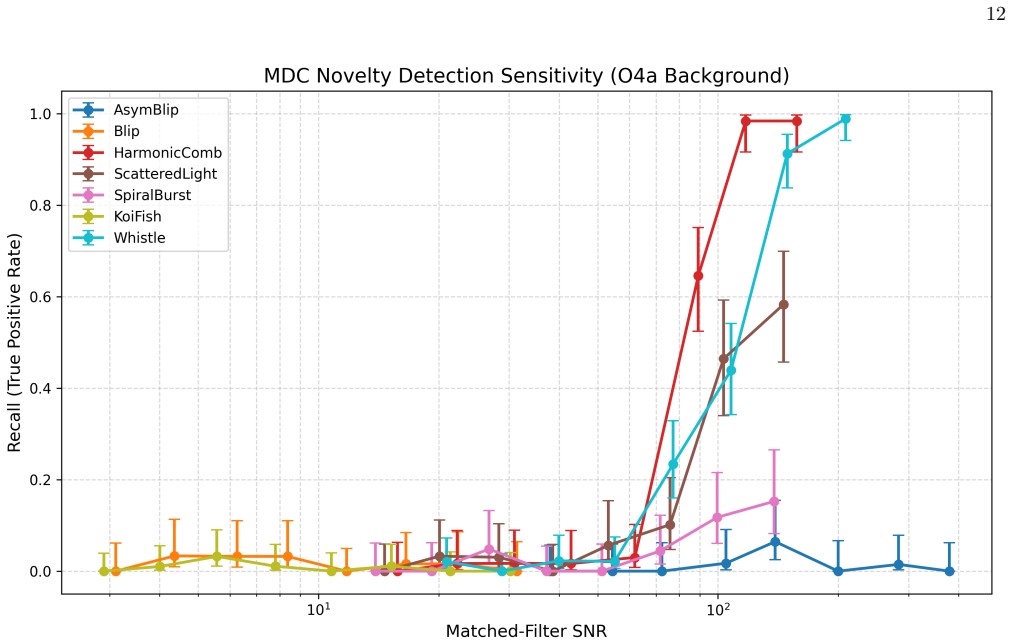
Phase 1 demonstrates the Signal Dilution failure of global pooling
Both phases are aligned at a strict mathematically matched False Positive Rate (FPR = 1%) using their respective EVT thresholds. Phase 1 demonstrates the Signal Dilution failure of global pooling. Phase 2 validates the MIL architecture. Phase Architecture Metric Space Morphology Threshold Matched SNR Recall Phase 1 Global ([CLS])S cos ∈[0,1] 8 generic fam...
-
[2]
Background Distribution Characterization The total production scan was executed over the full N= 214,092 O4a segment corpus for both H1 and L1 detectors. The operational thresholdτ Det op is unified glob- ally per detector (i.e., one empiricalP 99 computation for the 150,000 H1 segments, and one for the 150,000 L1 seg- ments), guaranteeing a stable 1% FPR...
-
[3]
Anomaly Detection Summary Across the completed O4a analysis sessions, the Detec- tion Layer flagged a total of 140 unique candidate anoma- lies. This count is the result of a multi-stage reduction pipeline: (1) per-session scoring against the localτ Det op at FPR<1%, (2) morphological cross-matching against the Gravity Spy O3b catalog and internal VQ cosi...
-
[4]
We denotenthe total number of anomalous candidate segments processed by the DPMM clusterer in a given session
Topological Stability Analysis The adaptive DPMM taxonomy was validated for topological stability via bootstrapped re-clustering (Nboot = 20 independent runs) using the Adjusted Rand Index (ARI). We denotenthe total number of anomalous candidate segments processed by the DPMM clusterer in a given session. Of the 72 total detector-sessions (36 L1 + 36 H1),...
-
[5]
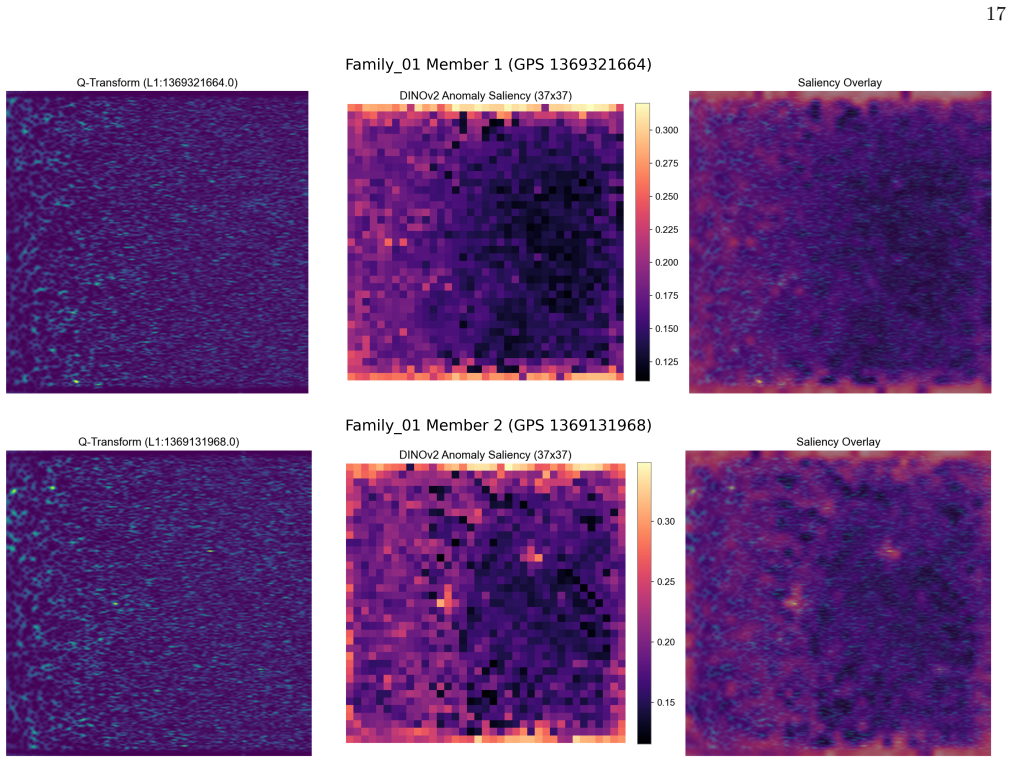
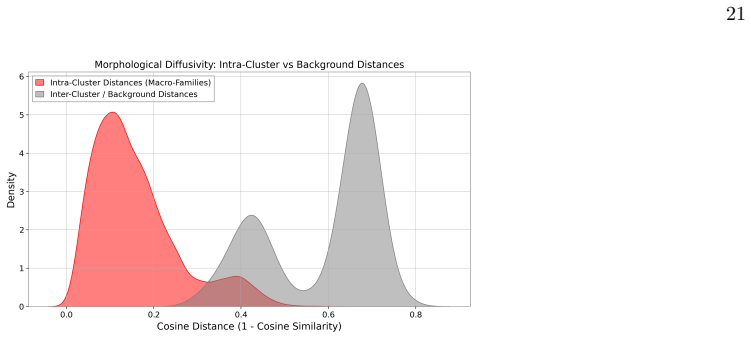
Applying a correla- tion distance thresholdρ trans = 0.75, this process defini- tively resolves the 76 constituent clusters intoK glob = 6 global families
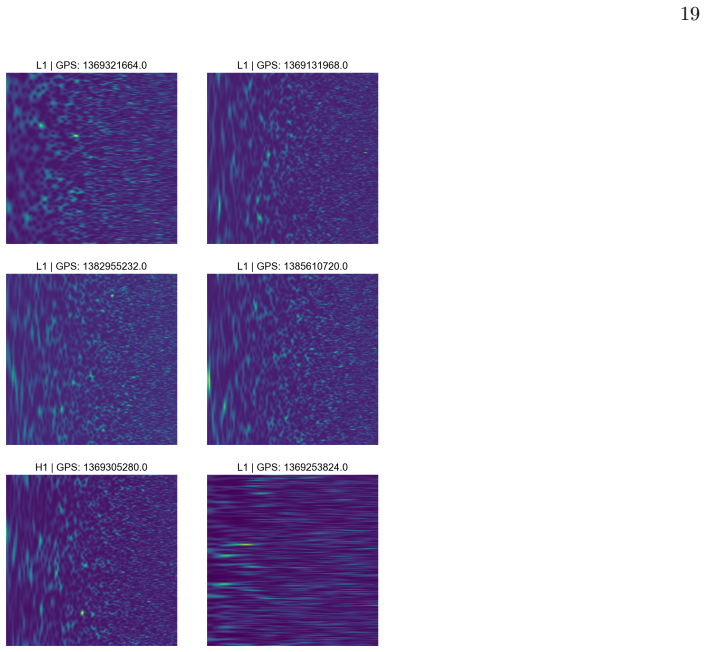
Physical Characterization and Environmental Vetting The taxonomy pipeline successfully groups candidate events via single-linkage clustering. Applying a correla- tion distance thresholdρ trans = 0.75, this process defini- tively resolves the 76 constituent clusters intoK glob = 6 global families. Three of these are macroscopic aggre- gates (Family 01, Fam...
-
[6]
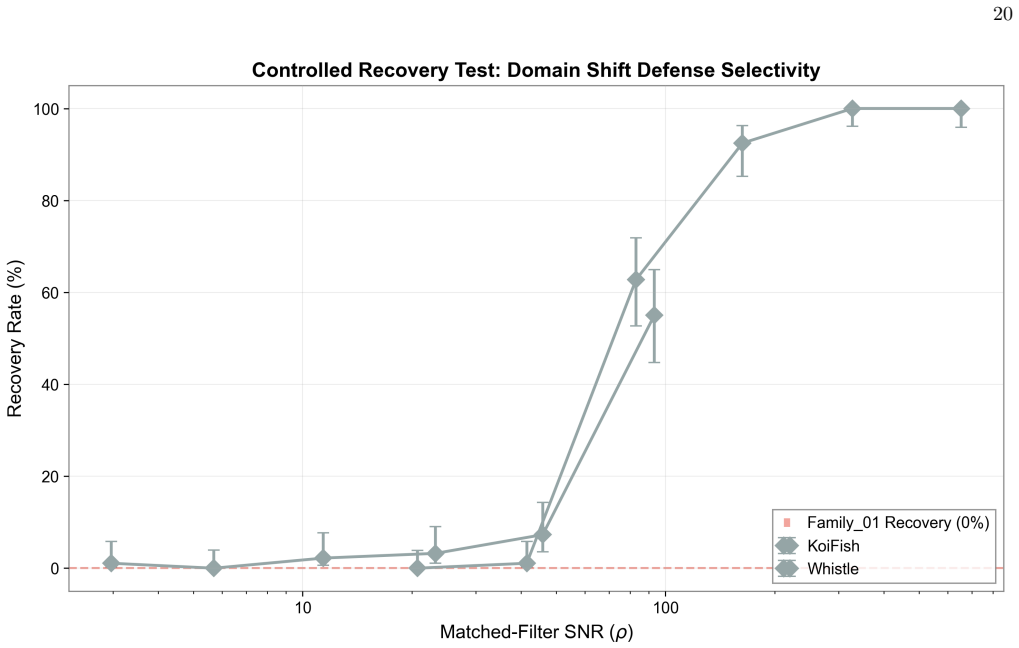
Falsifiability and Selectivity: Controlled Recovery Test To definitively rule out the hypothesis of methodolog- ical circularity—the concern that the native O4a index might be so expansive that it blindly absorbs all anoma- lies, thereby creating a false negative for Family 01—we executed an empirical Controlled Recovery Test. While this test cannot guara...
-
[7]
Notably, Single- ton 1371073984 exhibits full structural integrity (0 NaNs, no clipping) but possesses a highly chaotic, unstructured time-frequency morphology
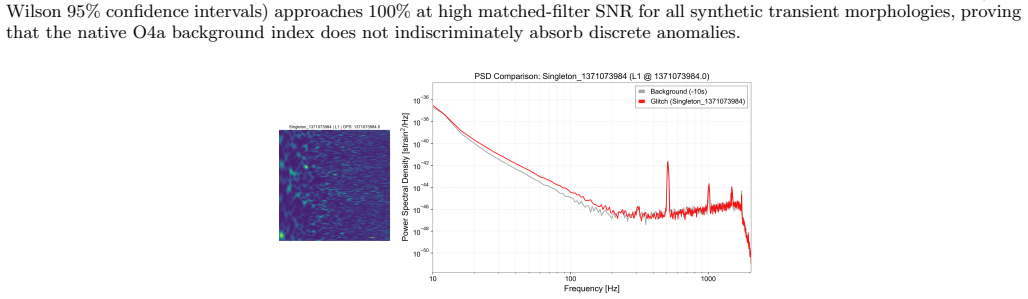
Isolated Extreme Transients (Singletons) While Family 01 demonstrates high morphological re- currence, the pipeline also isolated 3 extreme, non- recurring anomalies (Singletons). Notably, Single- ton 1371073984 exhibits full structural integrity (0 NaNs, no clipping) but possesses a highly chaotic, unstructured time-frequency morphology. Specifically, it...
-
[8]
The Gravity Spy classifier assignedgs label = Unknown with confidence<0.3 to all 11 Family 01 members
Domain Shift Bias and Supervised Validation A historical protocol for anomaly validation is cross- matching against the supervisedGravity Spymodel. The Gravity Spy classifier assignedgs label = Unknown with confidence<0.3 to all 11 Family 01 members. How- ever, we explicitly reject using this ”Unknown” label as evidence of physical novelty. Gravity Spy is...
-
[9]
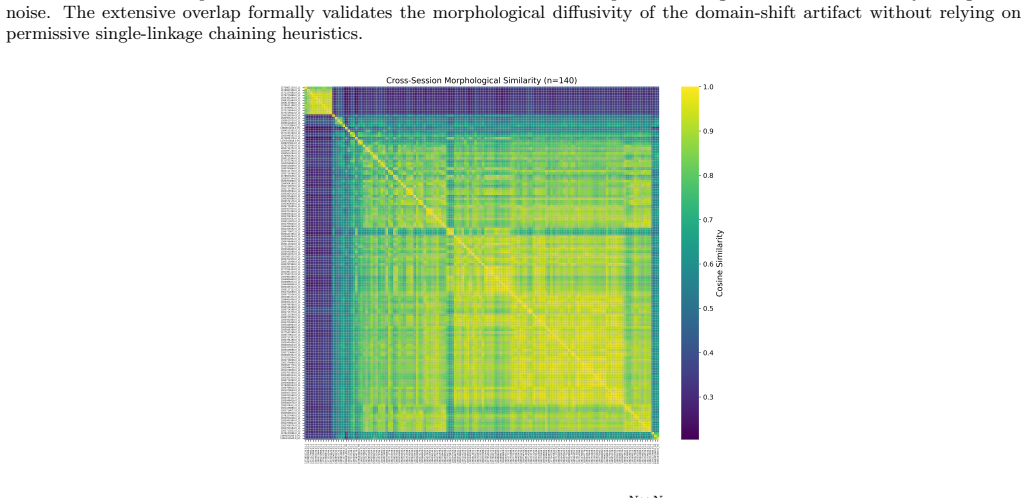
While a subset of O4 auxiliary channels was recently made publicly available via GWOSC [3], DANTE is 19 FIG
Environmental Vetting and Limitations A complete environmental vetting of Family01 and the Singleton events requires coherence analysis with aux- iliary Physical Environmental Monitoring (PEM) chan- nels (e.g., seismometers, magnetometers, control loops). While a subset of O4 auxiliary channels was recently made publicly available via GWOSC [3], DANTE is ...
-
[10]
Robustness to Hyperparameter Perturbation A potential concern regarding the resolution of Fam- ily 01 is whether its collapse is merely an artifact of rigid operational hyperparameter settings (e.g., the DPMM concentrationα= 0.01, the dynamically calibratedτ coh cohesion threshold, the 0.75 transitivity threshold, or the Top-kfractionk= 68). However, the ...
-
[11]
These segments are anti-coincident (no tem- poral overlap) and pass all data quality flags
Null Hypothesis Construction We construct the null distribution fromN L1 = 608 andN H1 = 608 confirmed noise-only segments from the O4a observing run, selected according to the criteria in Section V D. These segments are anti-coincident (no tem- poral overlap) and pass all data quality flags
-
[12]
We formM= 369,664 pairs via the complete Carte- sian product of theN L1 = 608 andN H1 = 608 back- ground segments
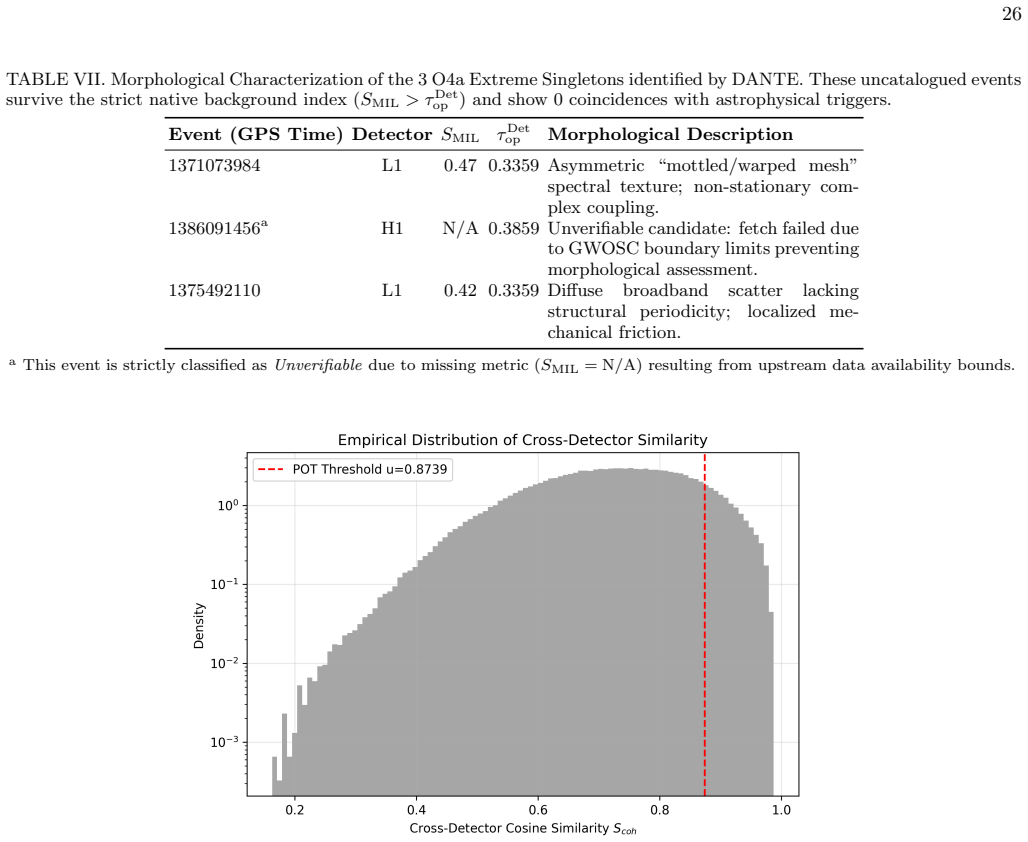
Cross-Detector Similarity Distribution For each pair (s(i) L1, s(j) H1) of noise segments, we compute the cosine similarity: Sij = z(i) L1 ·z (j) H1 ∥z(i) L1∥∥z(j) H1 ∥ (A1) wherez∈R 384 is the MIL-pooled DINOv2 feature vec- tor. We formM= 369,664 pairs via the complete Carte- sian product of theN L1 = 608 andN H1 = 608 back- ground segments. While these ...
-
[13]
mottled/warped mesh
GPD Fit and Threshold Selection In contrast, the cross-detector similarityS coh com- puted here involves MIL vectors from two physicallyin- dependentinterferometers separated by 3,002 km. The local environmental noise at Hanford (seismic, thermal, magnetic) is structurally decoupled from Livingston’s. TheM= 369,664 pairs are formed by samplinganti- coinci...
-
[14]
To quantify estimation uncertainty, we perform block bootstrap resampling (2000 iterations) at the segment level to preserve temporal correlations
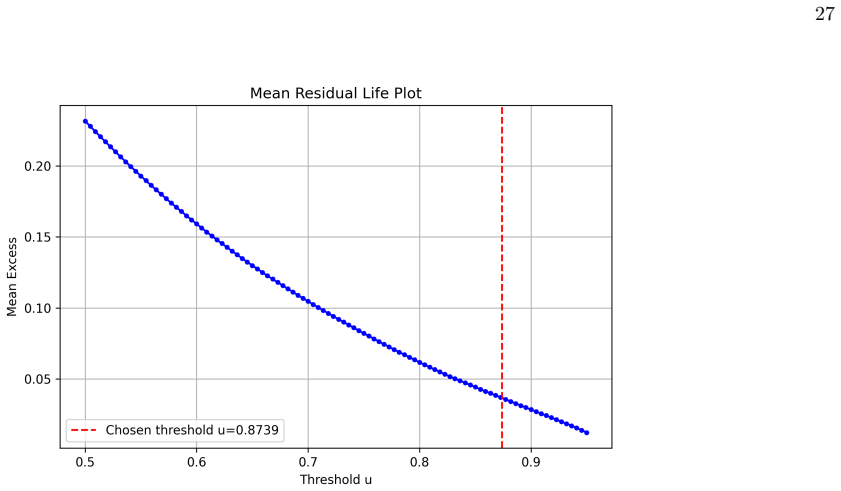
Quantile Estimation and Confidence Intervals The cohesion threshold at false positive rateα= 0.001 is obtained by inverting the GPD quantile function: τcoh =u+ σ ξ " α P(S > u) −ξ −1 # (A5) This yieldsτ coh = 0.9750 (analytical). To quantify estimation uncertainty, we perform block bootstrap resampling (2000 iterations) at the segment level to preserve te...
2000
-
[15]
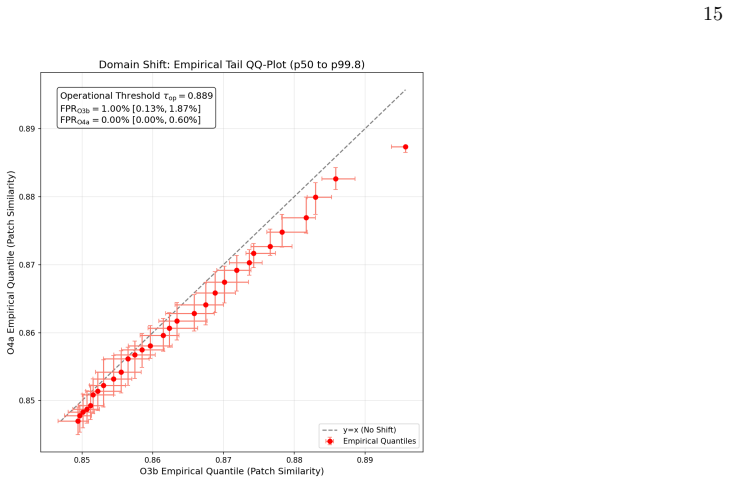
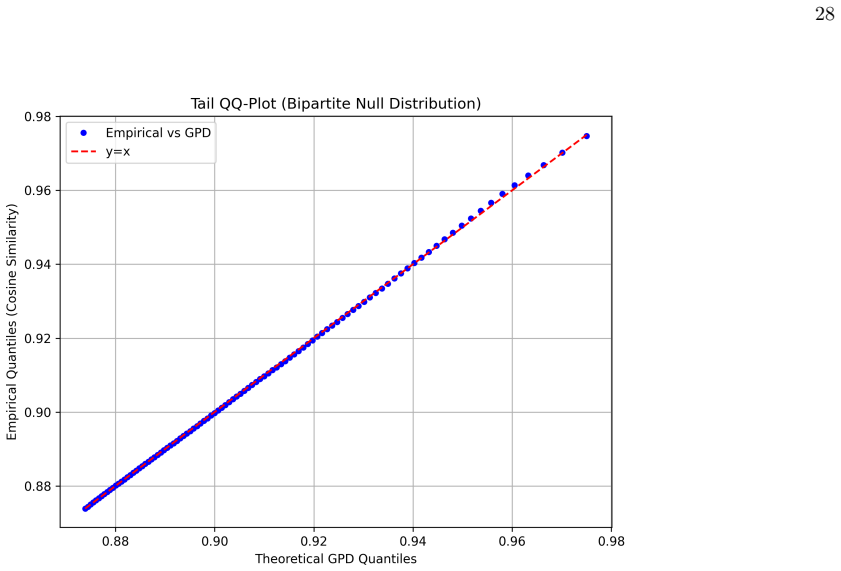
The alignment along the diagonal confirms the adequacy of the GPD model for the tail behavior
Model Validation Figure 13 shows the QQ-plot of empirical exceedances versus the fitted GPD. The alignment along the diagonal confirms the adequacy of the GPD model for the tail behavior
-
[16]
Unverifiable/Singleton
Impact on Candidate Classification We note that the revised thresholdτ coh = 0.9750 is more stringent than the previous heuristic value of 0.85. However, this change has no impact on the candidate classification reported in Section V, as no candidate ex- hibitsS coh ∈(0.85,0.9750]. This empirical observation strengthens the robustness of our results: the ...
-
[17]
We evaluated the sensitiv- ity of the macro-family recovery (clusters withn >1) acrossρ trans ∈ {0.60,0.75,0.90}
HAC Linkage Threshold (ρ trans) The global taxonomy relies on Hierarchical Agglomer- ative Clustering (HAC) using single linkage and a cosine distance threshold 1−ρ trans. We evaluated the sensitiv- ity of the macro-family recovery (clusters withn >1) acrossρ trans ∈ {0.60,0.75,0.90}. While the total number of microscopic singletons decoupled from the mai...
-
[18]
The concentration priorαcontrols the algorithm’s propensity to instantiate new components
DPMM Concentration Parameter (α) The Dirichlet Process Mixture Model (DPMM) is em- ployed to cluster intra-session vectors without specify- ingka priori. The concentration priorαcontrols the algorithm’s propensity to instantiate new components. We sweptα∈ {0.001,0.01,0.1,1.0}. On average, the DPMM instantiated a high number of components (typ- ically 10−1...
-
[19]
P., Abbott, R., Abbott, T
Abbott, B. P., Abbott, R., Abbott, T. D., et al. 2015 (LIGO Scientific Collaboration), Classical and Quantum Gravity, 32, 074001
2015
-
[20]
Wu, J., et al. (2025). Advancing Glitch Classification in Gravity Spy: Multi-view Fusion with Attention-based Machine Learning for Advanced LIGO’s Fourth Observ- ing Run.Classical and Quantum Gravity, 42(16), 165015
2025
-
[21]
GWOSC. (2025). O4 Auxiliary Channel Data Release, https://gwosc.org/auxiliary/
2025
-
[22]
2015 (Virgo Collaboration), Classical and Quantum Gravity, 32, 024001
Acernese, F., Agathos, M., Agatsuma, K., et al. 2015 (Virgo Collaboration), Classical and Quantum Gravity, 32, 024001
2015
-
[23]
2021 (KAGRA Collaboration), Progress of Theoretical and Experimen- tal Physics, 2021, 05A101
Akutsu, T., Ando, M., Arai, K., et al. 2021 (KAGRA Collaboration), Progress of Theoretical and Experimen- tal Physics, 2021, 05A101
2021
-
[24]
Bishop, C. M. 2006, Pattern Recognition and Machine Learning, Springer, New York
2006
-
[25]
Brown, J. C. 1991, Journal of the Acoustical Society of America, 89, 425
1991
-
[26]
Capote, E., Ballmer, S., Barsotti, L., et al. 2021, arXiv:2108.01080
arXiv 2021
-
[27]
2025,Advanced LIGO detector perfor- mance in the fourth observing run
Capote, E., et al. 2025,Advanced LIGO detector perfor- mance in the fourth observing run
2025
-
[28]
2021, Proceed- ings of the IEEE/CVF ICCV, 9650
Caron, M., Touvron, H., Misra, I., et al. 2021, Proceed- ings of the IEEE/CVF ICCV, 9650
2021
-
[29]
2018, Communications in Computational Physics, 25, 963, doi:10.4208/cicp.OA- 2018-0075
Cavagli` a, M., Staats, K., Gill, K. 2018, Communications in Computational Physics, 25, 963, doi:10.4208/cicp.OA- 2018-0075
-
[30]
2001, An Introduction to Statistical Modeling of Extreme Values, Springer, London
Coles, S. 2001, An Introduction to Statistical Modeling of Extreme Values, Springer, London
2001
-
[31]
Colgan, R. E., Corley, K. R., Gabbard, H., et al. 2020, Physical Review D, 101, 102003, doi: 10.1103/PhysRevD.101.102003
-
[32]
Damrich, S., Hamprecht, F. A. 2021, Advances in Neural Information Processing Systems, 34, 1
2021
-
[33]
2024, International Conference on Learning Representations (ICLR), arXiv:2309.16588
Darcet, T., Oquab, M., Doup´ e, E., Bourdoukan, R. 2024, International Conference on Learning Representations (ICLR), arXiv:2309.16588
Pith/arXiv arXiv 2024
-
[35]
2021, International Conference on Learning Representations (ICLR), arXiv:2010.11929
Dosovitskiy, A., Beyer, L., Kolesnikov, A., et al. 2021, International Conference on Learning Representations (ICLR), arXiv:2010.11929
Pith/arXiv arXiv 2021
-
[36]
Ferguson, T. S. 1973, The Annals of Statistics, 1, 209, doi:10.1214/aos/1176342360
-
[37]
A., Tippett, L
Fisher, R. A., Tippett, L. H. C. 1928, Mathematical Pro- ceedings of the Cambridge Philosophical Society, 24, 180
1928
-
[38]
Glanzer, J., Banagiri, S., Coughlin, S. B., et al. 2023, Classical and Quantum Gravity, 40, 065004, doi: 10.1088/1361-6382/acb633
-
[39]
1943, Annals of Mathematics, 44, 423
Gnedenko, B. 1943, Annals of Mathematics, 44, 423
1943
-
[40]
Gravitational Wave Open Science Center 2023, GWOSC O4a Dataset,https://gwosc.org/
2023
-
[41]
Gumbel, E. J. 1958, Statistics of Extremes, Columbia University Press, New York
1958
-
[42]
1985, Journal of Classification, 2, 193
Hubert, L., Arabie, P. 1985, Journal of Classification, 2, 193
1985
-
[43]
Kolmogorov, A. N. 1933, Giornale dell’Istituto Italiano degli Attuari, 4, 83
1933
-
[44]
2004, Journal of Multivariate Anal- ysis, 88, 365
Ledoit, O., Wolf, M. 2004, Journal of Multivariate Anal- ysis, 88, 365
2004
-
[45]
2022, Machine Learning: Science and Technology, 3, 025022
L´ opez, M., Martinez, C., Ota, I., et al. 2022, Machine Learning: Science and Technology, 3, 025022
2022
-
[46]
2025,Unsupervised transient analysis in Advanced LIGO O4a, (in preparation)
Lopez, M., et al. 2025,Unsupervised transient analysis in Advanced LIGO O4a, (in preparation)
2025
-
[47]
2025, Liv- ing Reviews in Relativity, 28, 2, doi:10.1007/s41114-024- 00055-8
Cuoco, E., Cavagli` a, M., Messenger, C., et al. 2025, Liv- ing Reviews in Relativity, 28, 2, doi:10.1007/s41114-024- 00055-8
-
[48]
McInnes, L., Healy, J., Melville, J. 2018, arXiv:1802.03426
Pith/arXiv arXiv 2018
-
[49]
Neal, R. M. 2000, Journal of Computational and Graph- ical Statistics, 9, 249
2000
-
[50]
R., Anderton, C
Nu˜ nez, J. R., Anderton, C. R., Renslow, R. S. 2018, PLOS ONE, 13, e0199239
2018
-
[51]
Nuttall, L. K. 2018, Philosophical Transactions of the Royal Society A, 376, 20170286, doi: 10.1098/rsta.2017.0286
-
[52]
2024, Transactions on Machine Learning Research (TMLR), arXiv:2304.07193
Oquab, M., Darcet, T., Moutakanni, T., et al. 2024, Transactions on Machine Learning Research (TMLR), arXiv:2304.07193
Pith/arXiv arXiv 2024
-
[53]
Pankow, C., Chatziioannou, K., Chase, E. A., et al. 2018, Physical Review D, 98, 084016, doi: 10.1103/PhysRevD.98.084016
-
[54]
2015, Classical and Quantum Gravity, 32, 215012
Powell, J., Trifir` o, D., Cuoco, E., et al. 2015, Classical and Quantum Gravity, 32, 215012
2015
-
[55]
2021, Interna- tional Conference on Machine Learning (ICML), 8748
Radford, A., Kim, J., Hallacy, C., et al. 2021, Interna- tional Conference on Machine Learning (ICML), 8748
2021
-
[56]
Raikman, R., Skliris, V., Sherrill, N., et al. 2022, arXiv:2209.02102
arXiv 2022
-
[57]
2010, Proceedings of the 19th international conference on World wide web (WWW ’10), 1177
Sculley, D. 2010, Proceedings of the 19th international conference on World wide web (WWW ’10), 1177
2010
-
[58]
1948, Annals of Mathematical Statistics, 19, 279
Smirnov, N. 1948, Annals of Mathematical Statistics, 19, 279
1948
-
[59]
Soni, S., Berry, C. P. L., Coughlin, S. B., et al. 2025, arXiv:2409.02831
arXiv 2025
-
[60]
E., Bishop, C
Tipping, M. E., Bishop, C. M. 1999, Journal of the Royal Statistical Society B, 61, 611
1999
-
[61]
2019, Physical Review Letters, 123, 231107, doi: 10.1103/PhysRevLett.123.231107
Tse, M., Yu, H., Kijbunchoo, N., et al. 2019, Physical Review Letters, 123, 231107, doi: 10.1103/PhysRevLett.123.231107
-
[62]
Welch, P. D. 1967, IEEE Transactions on Audio and Elec- troacoustics, 15, 70
1967
-
[63]
Well-conditioned ptychographic imaging via lost subspace completion
Zevin, M., Coughlin, S., Bahaadini, S., et al. 2017, Classi- cal and Quantum Gravity, 34, 064003, doi:10.1088/1361- 6382/aa5cea
discussion (0)
Sign in with ORCID, Apple, or X to comment. Anyone can read and Pith papers without signing in.