State Representation Matters in Deep Reinforcement Learning: Application to Energy Trading
Pith reviewed 2026-06-26 05:27 UTC · model grok-4.3
The pith
Combining price scale, relative history, and forecasts in the state lets a fixed RL agent reach 55.6% returns on energy trading test data.
A machine-rendered reading of the paper's core claim, the machinery that carries it, and where it could break.
Core claim
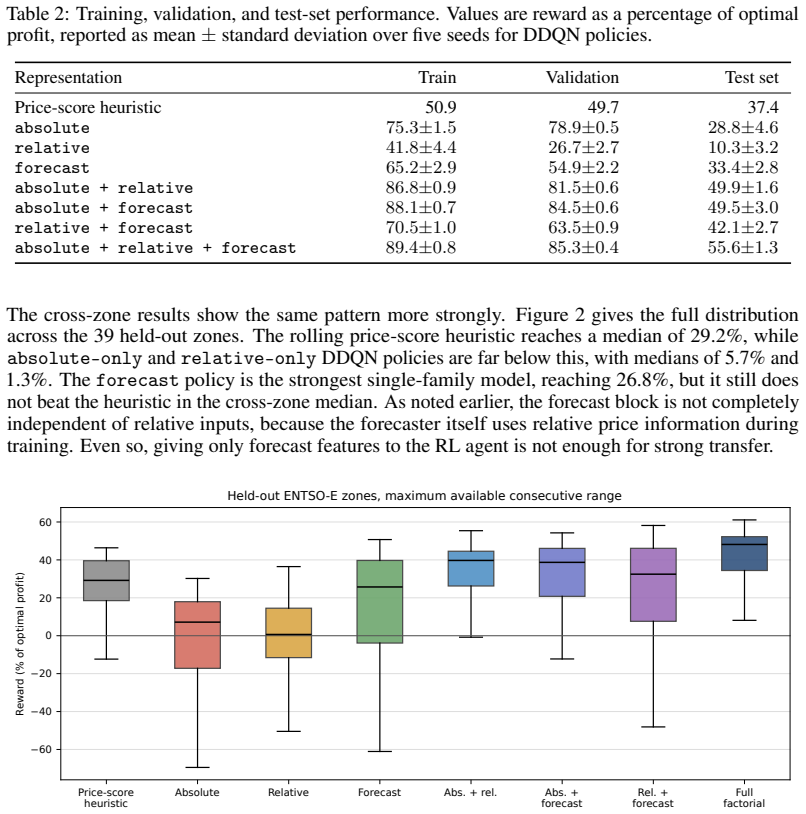
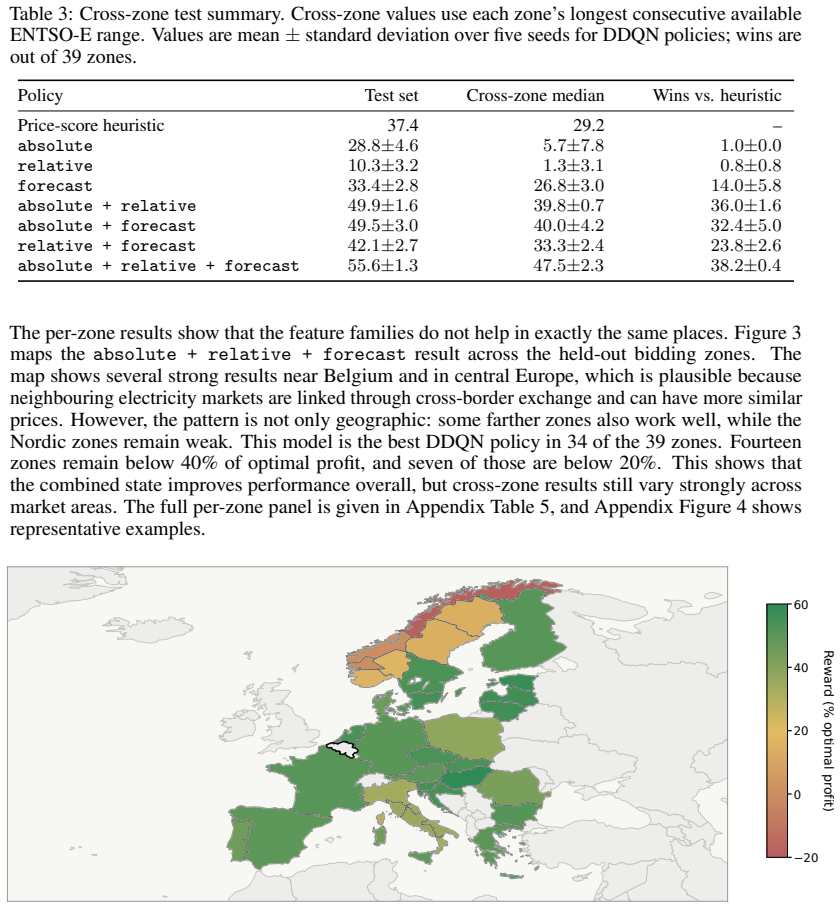
Policies trained with absolute price and calendar features reach 28.8 percent on the Belgian test set from 2012-2025 and a median of 5.7 percent across 39 other ENTSO-E zones. Relative-only and forecast-only states remain below the performance of a rolling price-score heuristic in the cross-zone median. The combination of absolute and relative features attains 49.9 percent on the test set and 39.8 percent cross-zone median. Adding forecast features further raises these figures to 55.6 percent and 47.5 percent. The paper concludes that robust transfer requires combining price scale, recent relative price context, and short-horizon forecast information rather than using any single feature fami
What carries the argument
The three families of market features—absolute prices and calendar data, relative comparisons to recent market history, and short-horizon price forecasts—whose combinations are tested as state inputs to an otherwise unchanged Double DQN agent in the HydroDam environment.
If this is right
- Robust performance on later data from the same market requires states that include both absolute and relative price information.
- Transfer to other market zones improves markedly only when multiple feature families are combined.
- Forecast features contribute additional gains when paired with absolute and relative information.
- State representation can outweigh other design choices in determining whether an RL policy exceeds simple trading heuristics.
Where Pith is reading between the lines
- Similar experiments varying state features while fixing the learner could reveal the importance of representation in other RL applications involving time series.
- The finding suggests that energy trading agents should be designed with explicit mechanisms to combine level and change signals in their observations.
- Future work could test whether the same feature families remain critical when the underlying storage model or reward function is altered.
Load-bearing premise
Varying only the market features while keeping the Double DQN agent, environment, action space, reward function, network, and training protocol fixed isolates the causal effect of state representation.
What would settle it
If an experiment using the same feature sets but with a different RL algorithm, such as an actor-critic method, produced similar or larger gaps between single and combined states, it would support the claim; the opposite result would challenge it.
Figures
read the original abstract
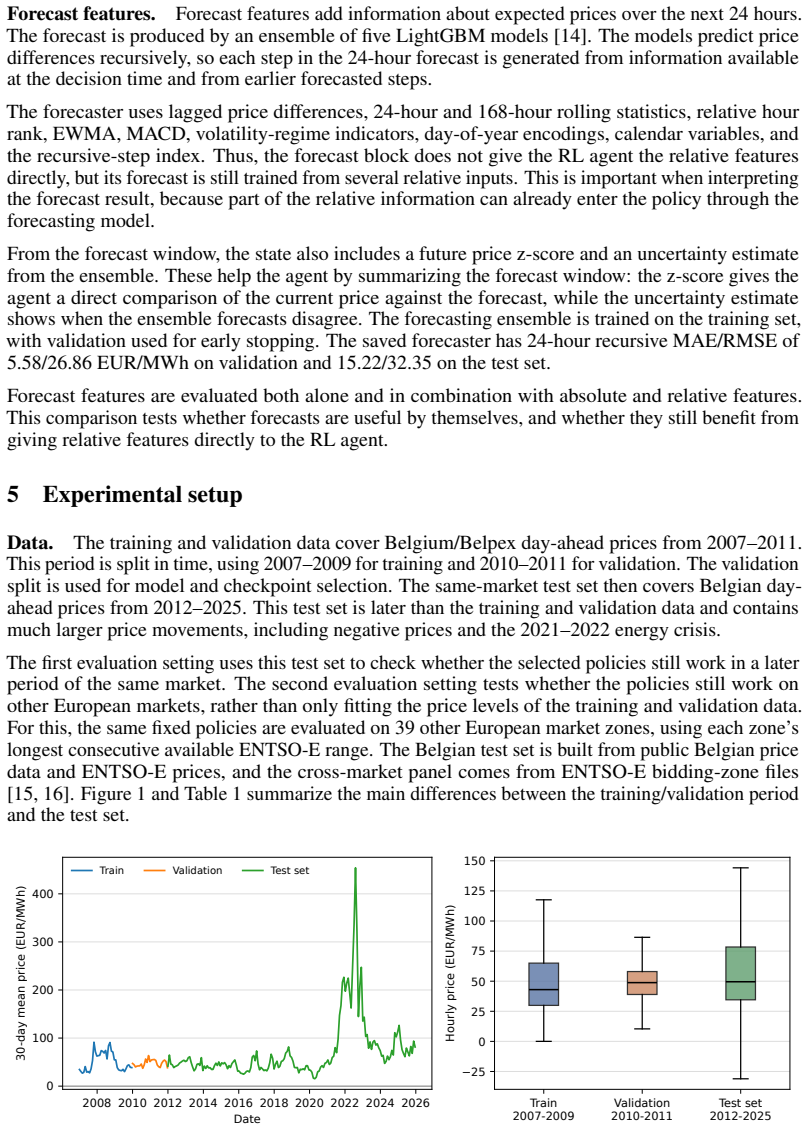
Energy trading decisions depend not only on current market prices, but also on expected future market conditions, and operational constraints. This makes the state representation given to a reinforcement learning agent an important design choice. We study this in HydroDam, a pumped-storage arbitrage environment, using a fixed Double DQN agent. The environment, action space, reward function, network, and training protocol are kept fixed; only the market features are changed. We compare absolute price/calendar features, relative features that compare current prices with recent market history, forecast features, and all combinations of these three feature families. Policies are trained and selected using 2007--2011 Belgian day-ahead prices and evaluated on two test settings: a later same-market test set from 2012--2025 and 39 other ENTSO-E market zones. Absolute features only reaches 28.8% on the test set and a median 5.7% across zones. Relative-only and forecast-only states also stay below a rolling price-score heuristic in the cross-zone median. Combining feature families is much stronger: absolute + relative reaches 49.9% on the test set and a 39.8% cross-zone median, while absolute + relative + forecast reaches 55.6% and 47.5%. These results suggest that state representation is not a minor preprocessing choice in storage-trading RL, but a central part of the policy design: robust transfer requires combining price scale, recent relative price context, and short-horizon forecast information, rather than relying on any single feature family.
Editorial analysis
A structured set of objections, weighed in public.
Referee Report
Summary. The paper claims that state representation is a central design choice in deep RL for energy trading. Using a fixed Double DQN agent in the HydroDam pumped-storage arbitrage environment (with environment, action space, reward, network, and training protocol held constant), it compares absolute price/calendar features, relative features, forecast features, and their combinations. Policies trained on 2007-2011 Belgian day-ahead prices are evaluated on a 2012-2025 same-market test set and 39 other ENTSO-E zones; single-feature families underperform a rolling heuristic while combinations (especially absolute+relative+forecast) reach 55.6% and 47.5% median, respectively.
Significance. If the isolation of state-representation effects holds, the work shows that robust cross-zone transfer in storage-trading RL requires combining price scale, recent relative context, and short-horizon forecasts rather than any single family. The controlled ablation design and direct out-of-sample evaluation on later periods plus 39 independent zones constitute a clear empirical contribution; the absence of free parameters or self-referential quantities in the reported metrics is a strength.
major comments (2)
- [Abstract] Abstract: the assertion that 'the network ... [is] kept fixed; only the market features are changed' is load-bearing for the causal claim but is not supported by the experimental description. Different feature families produce input vectors of different dimension; standard DQN implementations scale the first-layer width with input size, so parameter count, representational capacity, and optimization dynamics are not controlled across ablations. Performance gaps may therefore reflect capacity differences rather than informational content alone.
- [Abstract] Abstract and results presentation: no variance, standard deviations, or statistical significance tests are reported for the out-of-sample metrics (e.g., 55.6% vs. 28.8% on the test set). Without these, it is impossible to determine whether the reported superiority of combined feature families is robust or could arise from training stochasticity.
minor comments (2)
- [Abstract] Abstract: the cross-zone median is reported without the number of zones or any indication of spread; adding the inter-quartile range or min/max would improve interpretability of the 39.8% and 47.5% figures.
- The manuscript would benefit from an explicit statement of the precise network architecture (layer widths, activation, etc.) and whether any input-padding or fixed-dimension preprocessing was applied to keep the network identical.
Simulated Author's Rebuttal
We thank the referee for the constructive and detailed comments. We address each major point below, acknowledging where revisions are needed to strengthen the manuscript.
read point-by-point responses
-
Referee: [Abstract] Abstract: the assertion that 'the network ... [is] kept fixed; only the market features are changed' is load-bearing for the causal claim but is not supported by the experimental description. Different feature families produce input vectors of different dimension; standard DQN implementations scale the first-layer width with input size, so parameter count, representational capacity, and optimization dynamics are not controlled across ablations. Performance gaps may therefore reflect capacity differences rather than informational content alone.
Authors: We acknowledge that this is a valid concern. While the manuscript states that the network is kept fixed, varying input dimensions across feature families will indeed change the width of the first linear layer in a standard DQN implementation, altering total parameter count. In the revised version we will (i) explicitly state the input dimensions and total trainable parameters for each ablation, (ii) confirm that all hidden-layer widths and depths remain identical, and (iii) add a short discussion of why we still attribute the performance ordering primarily to informational content rather than capacity. We do not claim the original wording was fully precise on this point. revision: yes
-
Referee: [Abstract] Abstract and results presentation: no variance, standard deviations, or statistical significance tests are reported for the out-of-sample metrics (e.g., 55.6% vs. 28.8% on the test set). Without these, it is impossible to determine whether the reported superiority of combined feature families is robust or could arise from training stochasticity.
Authors: We agree that the absence of variability measures limits interpretability. The reported figures are single-run point estimates. In the revision we will rerun all configurations with at least five independent random seeds, report mean performance together with standard deviations, and add statistical significance tests (e.g., Wilcoxon signed-rank tests) for the key comparisons between feature families. These additions will be included in both the same-market and cross-zone evaluations. revision: yes
Circularity Check
No significant circularity; empirical results on held-out data
full rationale
The paper reports empirical performance of Double DQN policies trained on 2007-2011 Belgian prices and evaluated on 2012-2025 test data plus 39 independent ENTSO-E zones. No equations, fitted parameters, or predictions are presented; the central claim rests on direct out-of-sample profit metrics across feature-family ablations. The protocol description ('environment, action space, reward function, network, and training protocol are kept fixed; only the market features are changed') contains no self-referential definitions, no renaming of known results, and no load-bearing self-citations. Input-dimension variation across ablations is a methodological detail that does not reduce any reported quantity to its own inputs by construction. The derivation chain is therefore self-contained against external benchmarks.
Axiom & Free-Parameter Ledger
axioms (2)
- domain assumption Double DQN with the fixed network and training protocol is appropriate for learning policies in the HydroDam pumped-storage environment.
- domain assumption The HydroDam environment and the selected Belgian and ENTSO-E price data accurately reflect real operational constraints and market dynamics for arbitrage.
Reference graph
Works this paper leans on
-
[1]
Ramteen Sioshansi, Paul Denholm, Thomas Jenkin, and Jurgen Weiss. Estimating the value of electricity storage in PJM: Arbitrage and some welfare effects.Energy Economics, 31(2): 269–277, 2009. doi: 10.1016/j.eneco.2008.10.005
-
[2]
Deep rein- forcement learning solutions for energy microgrids management
Vincent François-Lavet, David Taralla, Damien Ernst, and Raphaël Fonteneau. Deep rein- forcement learning solutions for energy microgrids management. InEuropean Workshop on Reinforcement Learning, 2016
2016
-
[3]
Energy storage arbitrage in real-time markets via reinforcement learning
Hao Wang and Baosen Zhang. Energy storage arbitrage in real-time markets via reinforcement learning. In2018 IEEE Power and Energy Society General Meeting (PESGM), pages 2223– 2227, 2018. doi: 10.1109/PESGM.2018.8586321
-
[4]
Arbitrage of Energy Storage in Electricity Markets with Deep Reinforcement Learning
Hanchen Xu, Xiao Li, Xiangyu Zhang, and Junbo Zhang. Arbitrage of energy storage in electricity markets with deep reinforcement learning.arXiv preprint arXiv:1904.12232, 2019
work page internal anchor Pith review Pith/arXiv arXiv 1904
-
[5]
Mevludin Glavic. Reinforcement learning for electric power system decision and control: Past considerations and perspectives.IFAC-PapersOnLine, 50(1):6918–6927, 2017. doi: 10.1016/j.ifacol.2017.08.1217
-
[6]
Rui Lu, Seung Ho Hong, and Xiaohua Zhang. Reinforcement learning in sustainable energy and electric systems: A survey.Annual Reviews in Control, 49:145–163, 2020. doi: 10.1016/j. arcontrol.2020.03.001
work page doi:10.1016/j 2020
-
[7]
EarthandPlanetaryScienceLetters568,116983
Jesus Lago, Grzegorz Marcjasz, Bart De Schutter, and Rafał Weron. Forecasting day-ahead electricity prices: A review of state-of-the-art algorithms, best practices and an open-access benchmark.Applied Energy, 293:116983, 2021. doi: 10.1016/j.apenergy.2021.116983
-
[8]
Manuel Sage, Joshua Campbell, and Yaoyao Fiona Zhao. Enhancing battery storage en- ergy arbitrage with deep reinforcement learning and time-series forecasting.arXiv preprint arXiv:2410.20005, 2024
-
[9]
State representation learning for control: An overview.Neural Networks, 108:379–392, 2018
Timothée Lesort, Natalia Díaz-Rodríguez, Jean-François Goudou, and David Filliat. State representation learning for control: An overview.Neural Networks, 108:379–392, 2018. doi: 10.1016/j.neunet.2018.07.006
-
[10]
V olodymyr Mnih, Koray Kavukcuoglu, David Silver, Andrei A. Rusu, Joel Veness, Marc G. Bellemare, Alex Graves, Martin Riedmiller, Andreas K. Fidjeland, Georg Ostrovski, Stig Pe- tersen, Charles Beattie, Amir Sadik, Ioannis Antonoglou, Helen King, Dharshan Kumaran, Daan Wierstra, Shane Legg, and Demis Hassabis. Human-level control through deep reinforcemen...
-
[11]
Deep reinforcement learning with double q-learning.Proceedings of the AAAI Conference on Artificial Intelligence, 30(1), 2016
Hado van Hasselt, Arthur Guez, and David Silver. Deep reinforcement learning with double q-learning.Proceedings of the AAAI Conference on Artificial Intelligence, 30(1), 2016
2016
-
[12]
Quantifying generalization in reinforcement learning
Karl Cobbe, Oleg Klimov, Christopher Hesse, Taehoon Kim, and John Schulman. Quantifying generalization in reinforcement learning. InProceedings of the 36th International Conference on Machine Learning, volume 97 ofProceedings of Machine Learning Research, pages 1282–1289, 2019
2019
-
[13]
A Survey of Zero -shot Generalisation in Deep Reinforcement Learning
Robert Kirk, Amy Zhang, Edward Grefenstette, and Tim Rocktäschel. A survey of zero-shot generalisation in deep reinforcement learning.Journal of Artificial Intelligence Research, 76: 201–264, 2023. doi: 10.1613/jair.1.14174
-
[14]
LightGBM: A highly efficient gradient boosting decision tree
Guolin Ke, Qi Meng, Thomas Finley, Taifeng Wang, Wei Chen, Weidong Ma, Qiwei Ye, and Tie-Yan Liu. LightGBM: A highly efficient gradient boosting decision tree. InAdvances in Neural Information Processing Systems, volume 30, 2017
2017
-
[15]
Electricity price forecasting dataset
Tsinghua University Machine Learning Group. Electricity price forecasting dataset. https:// github.com/thuml/TimeXer/tree/main/dataset/EPF, 2024. Belgian hourly day-ahead prices with generation and load forecasts
2024
-
[16]
ENTSO-E transparency platform.https://transparency.entsoe.eu/, 2026
European Network of Transmission System Operators for Electricity. ENTSO-E transparency platform.https://transparency.entsoe.eu/, 2026. Day-ahead electricity price data for European bidding zones. 10 A Reproducibility details Table 4 lists the checkpoint-selection protocol for the reported policies. The action order in the Q-network is release, hold, pump...
2026
discussion (0)
Sign in with ORCID, Apple, or X to comment. Anyone can read and Pith papers without signing in.