Distribution of energy release events due to magnetic braiding
Pith reviewed 2026-06-30 02:19 UTC · model grok-4.3
The pith
Magnetic braiding at higher Reynolds numbers produces thinner, more numerous current sheets that heat coronal flux tubes.
A machine-rendered reading of the paper's core claim, the machinery that carries it, and where it could break.
Core claim
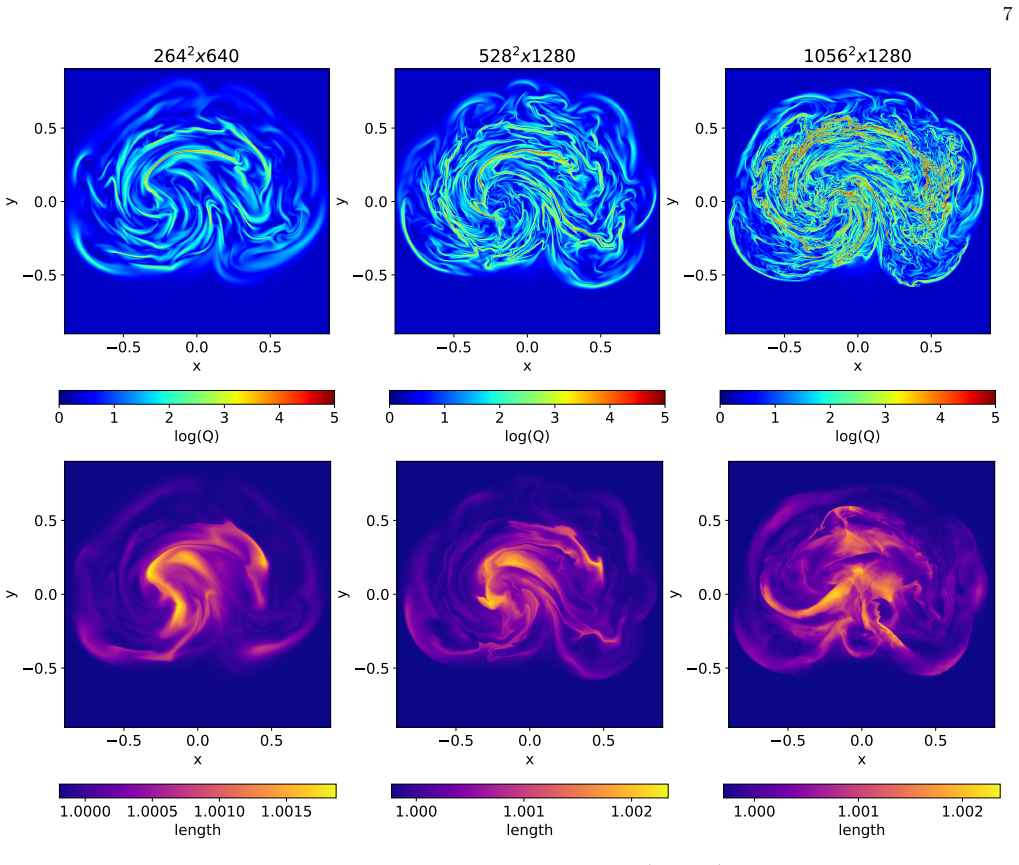
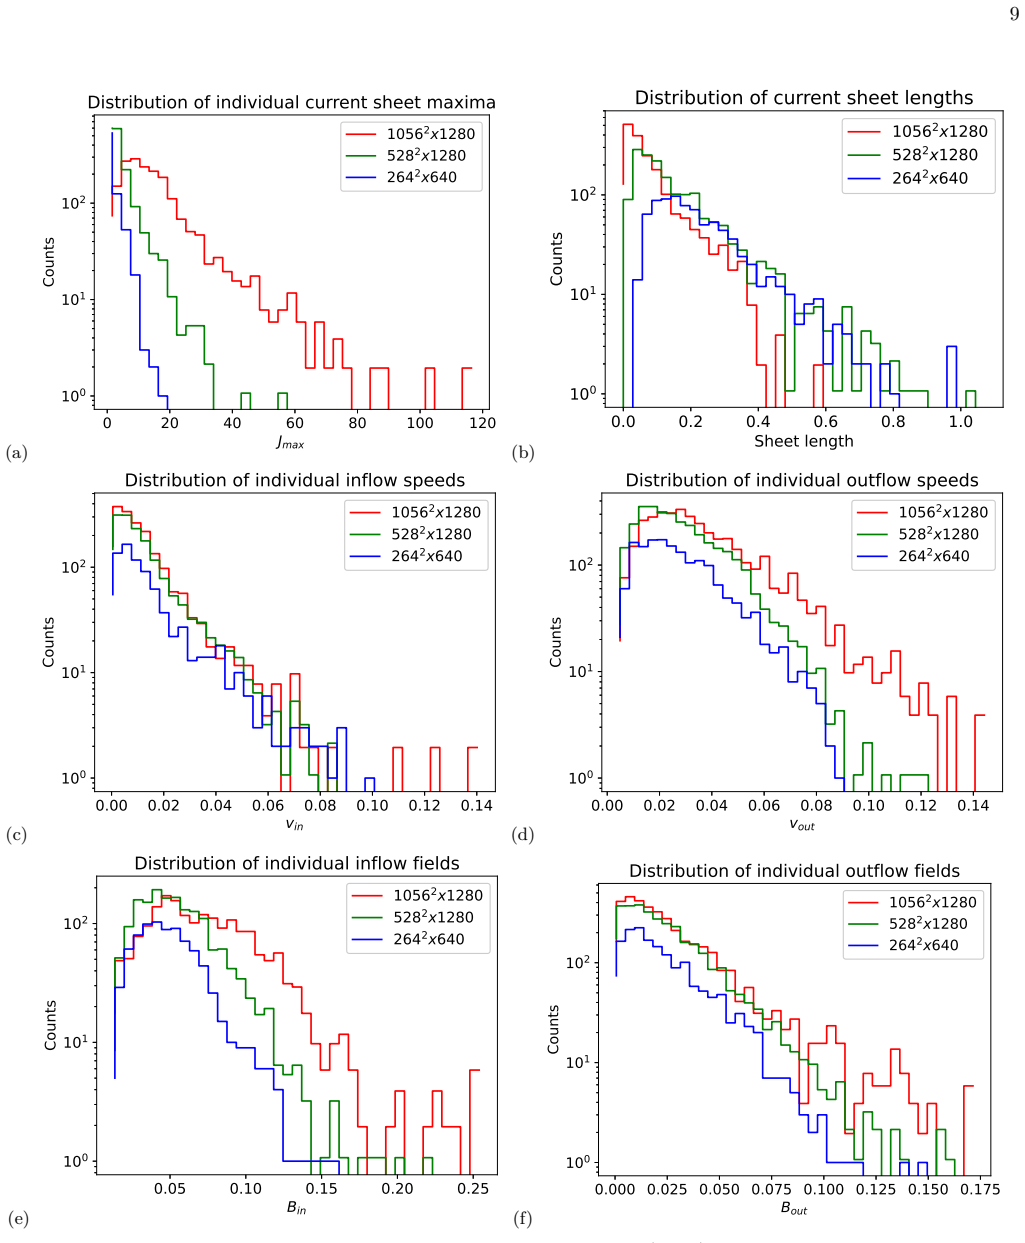
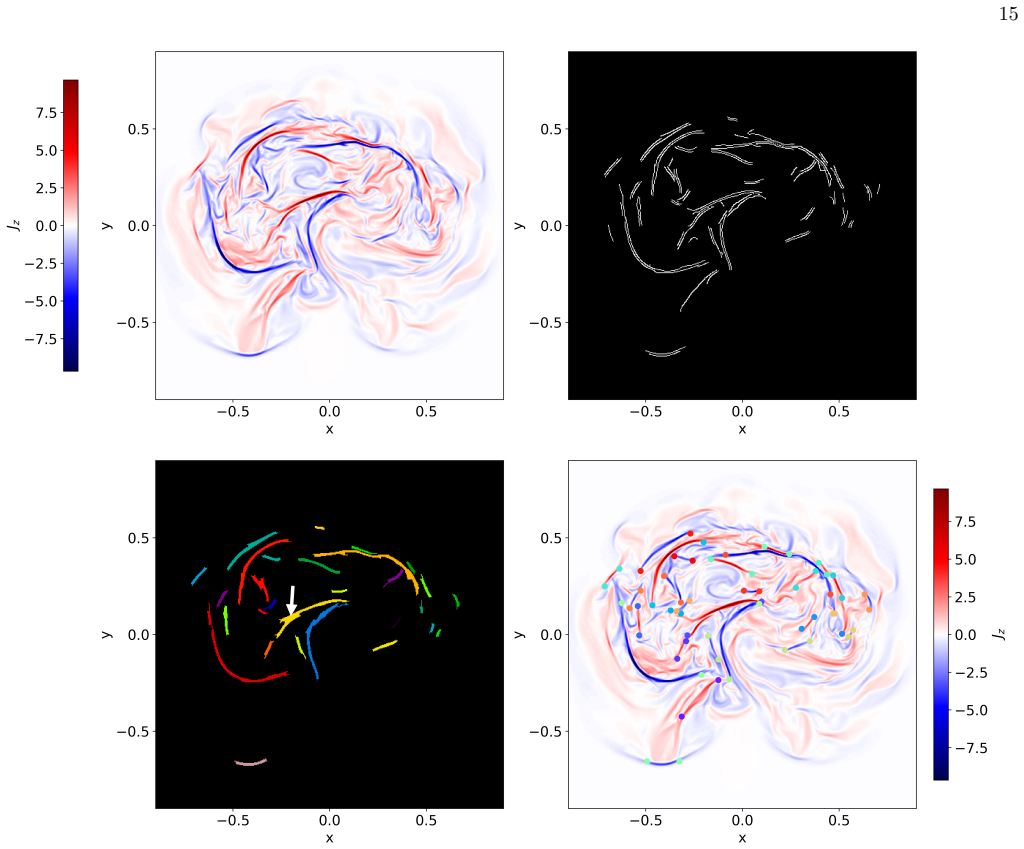
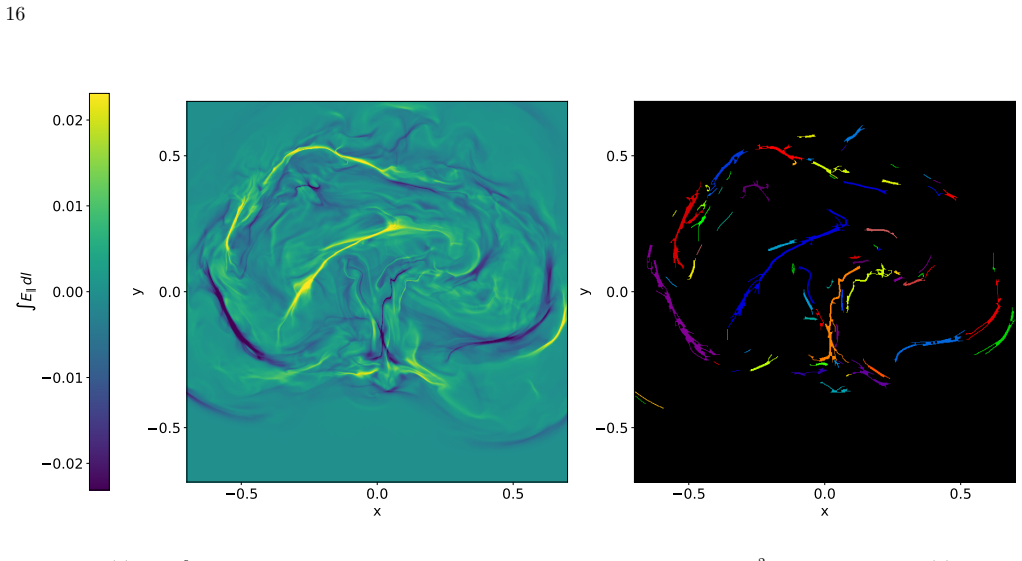
In boundary-driven resistive MHD simulations of flux braiding, increasing the magnetic Reynolds number causes reconnecting current sheets to become thinner, more intense, and more numerous, with a sharp cutoff in their length distribution at high Rm consistent with the plasmoid instability threshold. The magnetic field lines become more tangled, mean and peak field strengths increase, and Poynting flux rises, while the global reconnection rate stays independent of Rm. This supports braiding as a viable mechanism to heat the internal portions of coherent flux tubes in the corona.
What carries the argument
Boundary-driven resistive MHD flux-braiding simulations that resolve individual reconnecting current sheets and track their length, intensity, and number across different magnetic Reynolds numbers.
If this is right
- Current sheets fragment along their length at high Rm due to non-linear tearing/plasmoid instability.
- Mean and peak magnetic field strengths increase with Rm.
- Poynting flux into the domain increases with Rm, implying higher heating rates.
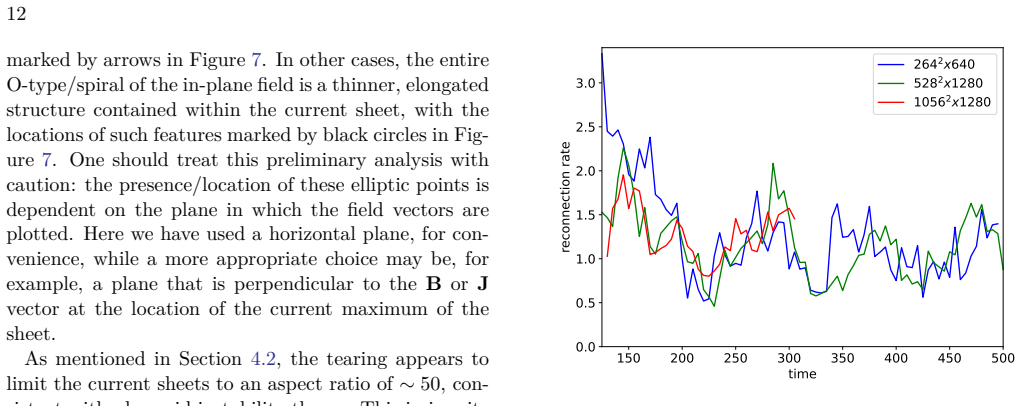
- The global reconnection rate remains essentially independent of Rm.
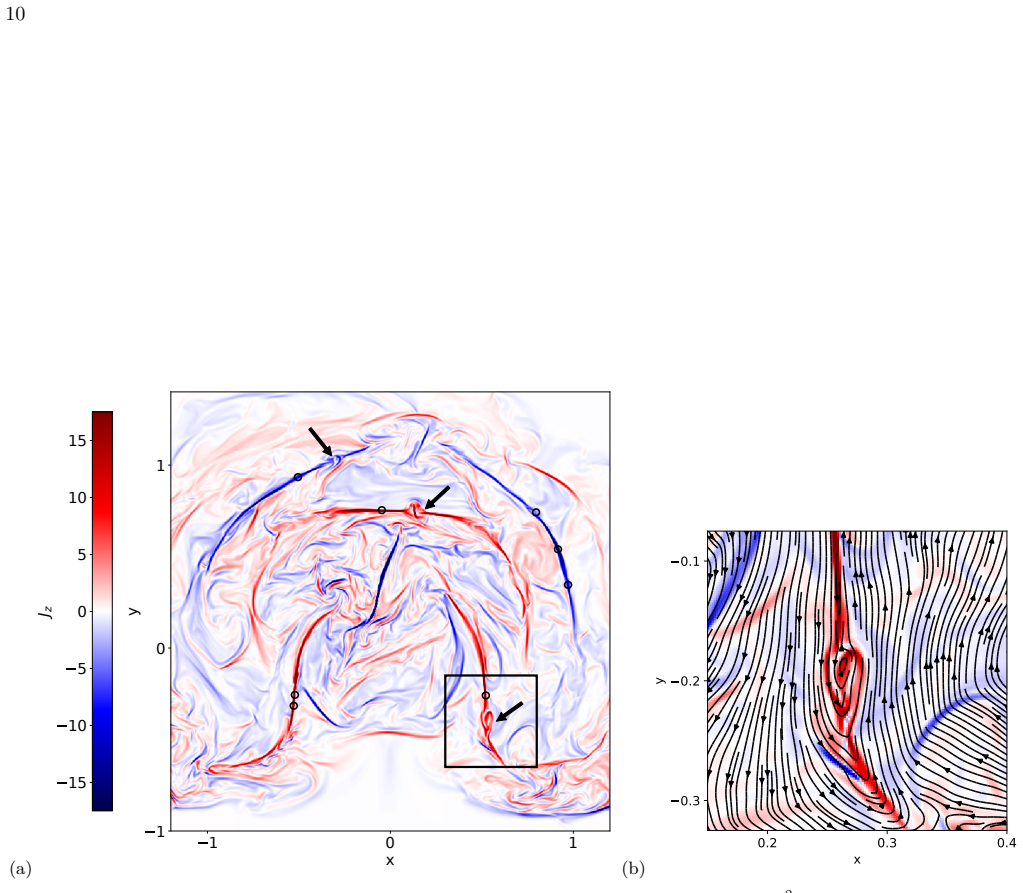
Where Pith is reading between the lines
- Observations of current-sheet length statistics in the corona could be used to infer the effective magnetic Reynolds number operating there.
- The same fragmentation process may operate in other astrophysical environments where braided fields undergo resistive evolution.
- Including partial ionization or chromospheric driving in follow-up runs would test whether the length cutoff persists under more realistic photospheric conditions.
Load-bearing premise
The boundary-driven resistive MHD setup with chosen driving and resistivity accurately represents the multi-scale, partially ionized conditions of the solar photosphere and chromosphere that braid coronal field lines.
What would settle it
Solar observations showing no increase in the number or thinness of current sheets with estimated magnetic Reynolds number, or no cutoff in their length distribution near the predicted plasmoid scale, would falsify the claimed dependence.
Figures
read the original abstract
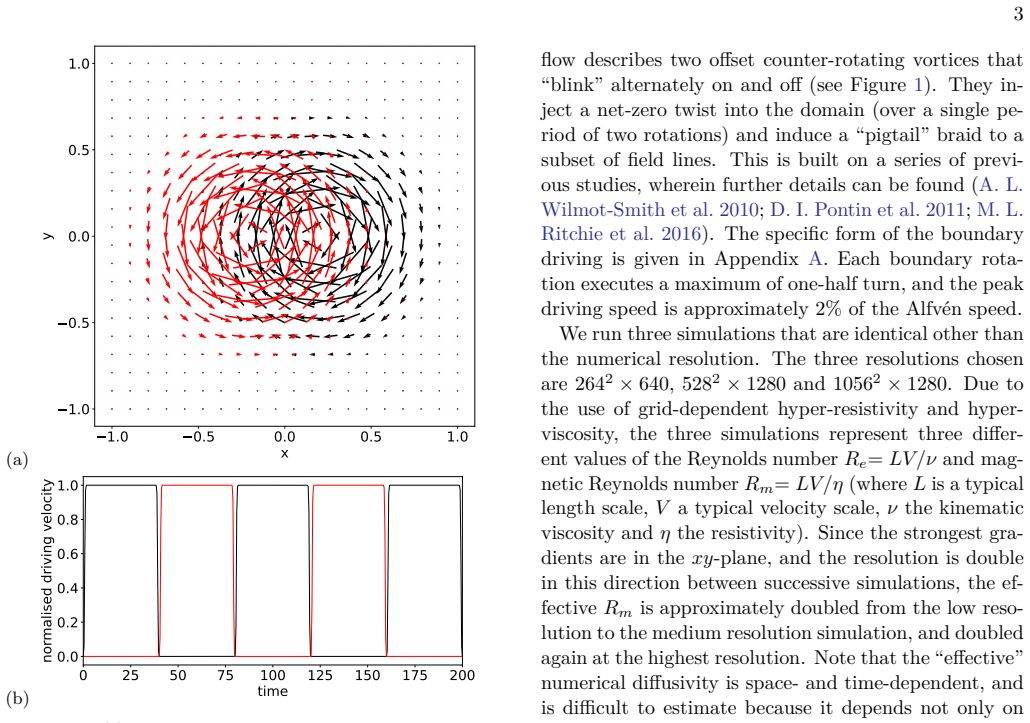
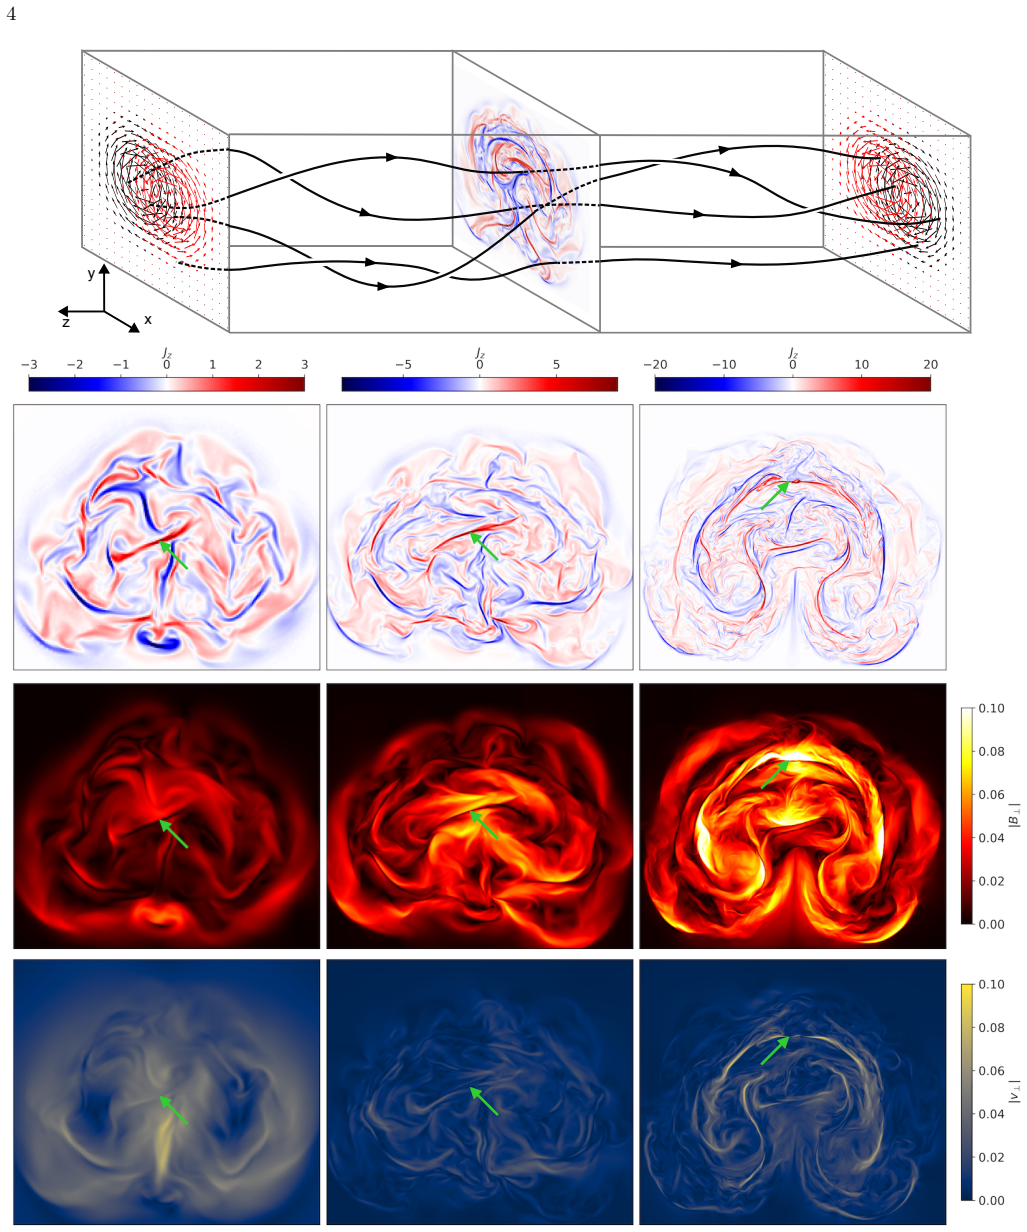
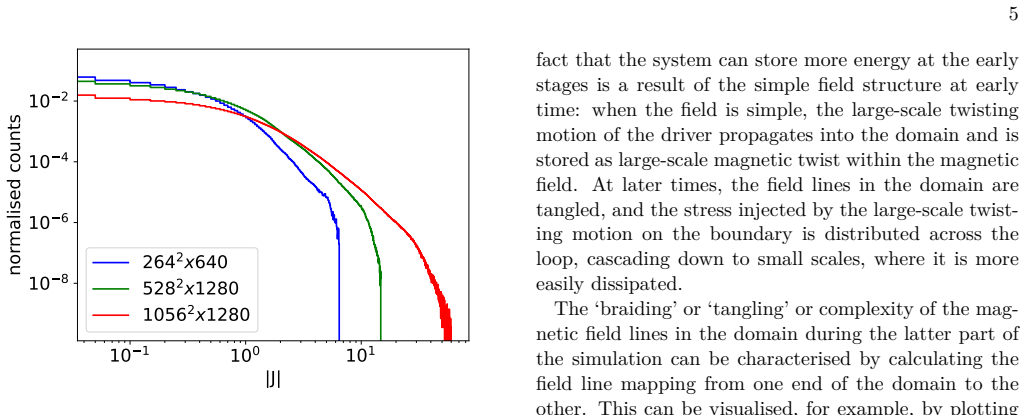
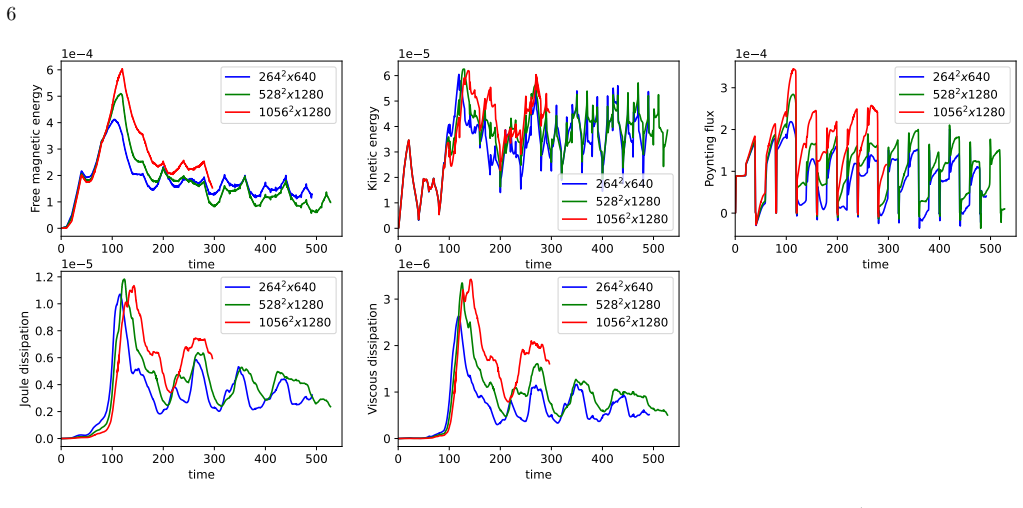
Energy conversion by reconnection-powered nanoflare heating is one of the leading explanations for the heating of the solar chromosphere and corona. The aim of this paper is to shed light on this mechanism by exploring the magnetic Reynolds number dependence of the energy conversion process. To do this we employ boundary-driven, magnetohydrodynamic, flux-braiding simulations at different magnetic Reynolds numbers ($R_m$), and explore in detail the properties of the individual magnetic energy release events. The properties of the reconnecting current sheets that mediate the energy release are shown to depend on $R_m$. For increasing $R_m$, the current sheets become thinner, more intense, and more numerous. For sufficiently large $R_m$, the current sheets fragment along their length, leading to a sharp cutoff in the current sheet length distribution. The cutoff is consistent with the threshold for non-linear tearing/plasmoid instability. For increasing $R_m$ the magnetic field lines become increasingly tangled, the mean and peak values of the magnetic field strength increase, and the Poynting flux into the domain increases, implying that the heating rate also increases. The global reconnection rate is essentially independent of $R_m$. These results support the braiding mechanism as a viable way to effectively heat the internal portions of coherent flux tubes in the corona.
Editorial analysis
A structured set of objections, weighed in public.
Referee Report
Summary. The paper presents boundary-driven resistive MHD simulations of magnetic flux braiding at varying magnetic Reynolds numbers (Rm). It reports that reconnecting current sheets become thinner, more intense, and more numerous with increasing Rm; at sufficiently high Rm they fragment along their length, consistent with the nonlinear tearing/plasmoid instability threshold. Field lines become more tangled, mean and peak |B| increase, and Poynting flux rises (implying higher heating), while the global reconnection rate remains essentially Rm-independent. These trends are used to argue that braiding is a viable mechanism for heating the internal portions of coherent coronal flux tubes.
Significance. If the reported Rm scalings and the Rm-independent global rate are robust within the model, the work supplies concrete numerical evidence on how current-sheet statistics and energy-release distributions evolve with resistivity, strengthening the case for braiding-driven nanoflare heating in the corona.
major comments (2)
- [Abstract / Setup description] The central claim that the results 'support the braiding mechanism as a viable way to effectively heat the internal portions of coherent flux tubes in the corona' (abstract) rests on the assumption that the single-fluid resistive MHD setup with idealized boundary driving faithfully captures the multi-scale, partially ionized photospheric/chromospheric conditions that braid coronal field lines. The manuscript provides no quantitative test or discussion of how the omission of ambipolar diffusion, height-dependent ionization, and turbulent spectrum alters current-sheet thinning, fragmentation threshold, or Poynting-flux scaling; without such justification the transfer of the reported Rm trends to the real corona is not demonstrated.
- [Results on current-sheet statistics] The reported Rm dependence of current-sheet properties and the Rm independence of the global reconnection rate are presented as key results, yet the text does not specify the numerical values of Rm explored, the functional form of resistivity, or any resolution-convergence tests for the fragmentation cutoff. These omissions make it impossible to assess whether the sharp cutoff in the length distribution is physical or numerical, directly affecting the load-bearing claim about the tearing-instability threshold.
minor comments (1)
- Notation for magnetic Reynolds number is introduced as $R_m$ in the abstract but the precise definition (e.g., reference length and velocity) is not restated when results are discussed; a brief reminder would improve clarity.
Simulated Author's Rebuttal
Thank you for the opportunity to respond to the referee's report. We address each major comment in turn below, providing clarifications and indicating where revisions will be made to the manuscript.
read point-by-point responses
-
Referee: [Abstract / Setup description] The central claim that the results 'support the braiding mechanism as a viable way to effectively heat the internal portions of coherent flux tubes in the corona' (abstract) rests on the assumption that the single-fluid resistive MHD setup with idealized boundary driving faithfully captures the multi-scale, partially ionized photospheric/chromospheric conditions that braid coronal field lines. The manuscript provides no quantitative test or discussion of how the omission of ambipolar diffusion, height-dependent ionization, and turbulent spectrum alters current-sheet thinning, fragmentation threshold, or Poynting-flux scaling; without such justification the transfer of the reported Rm trends to the real corona is not demonstrated.
Authors: We acknowledge that our simulations employ an idealized single-fluid resistive MHD model with uniform resistivity and do not incorporate ambipolar diffusion, height-dependent ionization, or a turbulent photospheric spectrum. The study is designed to isolate the effect of varying Rm on current sheet statistics and energy release within this framework, which is commonly used in the literature on coronal heating. We will revise the manuscript to include an expanded discussion section that outlines these limitations and the regimes in which the reported Rm scalings are likely to remain relevant. However, a quantitative assessment of the omitted physics would require a separate set of multi-fluid or more complex simulations, which is outside the scope of this work. Therefore, the revision will be partial. revision: partial
-
Referee: [Results on current-sheet statistics] The reported Rm dependence of current-sheet properties and the Rm independence of the global reconnection rate are presented as key results, yet the text does not specify the numerical values of Rm explored, the functional form of resistivity, or any resolution-convergence tests for the fragmentation cutoff. These omissions make it impossible to assess whether the sharp cutoff in the length distribution is physical or numerical, directly affecting the load-bearing claim about the tearing-instability threshold.
Authors: We thank the referee for pointing out these omissions. The simulations were performed at Rm = 1000, 5000, 10000, and 50000, with a constant resistivity eta. We will add explicit statements of these values and the resistivity model in the methods section. Additionally, we have conducted resolution studies and will include a paragraph describing the convergence tests, which indicate that the fragmentation is resolved at the highest resolutions used and consistent with the plasmoid instability threshold. This will strengthen the manuscript and we will make these changes. revision: yes
- Quantitative evaluation of the effects of ambipolar diffusion, partial ionization, and turbulent driving on the current-sheet properties and energy release distributions.
Circularity Check
No circularity: results are direct outputs of numerical MHD experiments
full rationale
The paper reports outcomes from a series of boundary-driven resistive MHD flux-braiding simulations performed at multiple values of Rm. Quantities such as current-sheet thickness, intensity, number, fragmentation, field-line tangling, mean/peak |B|, Poynting flux, and global reconnection rate are extracted directly from the simulation data. No analytical derivation chain, parameter fitting followed by renamed prediction, or load-bearing self-citation is present; the central support for the braiding-heating scenario follows immediately from the reported simulation statistics without reduction to the inputs by construction.
Axiom & Free-Parameter Ledger
axioms (2)
- domain assumption Resistive MHD equations govern the evolution of the magnetic field and plasma in the modeled domain.
- domain assumption Boundary driving at the base represents the effect of photospheric motions on coronal field lines.
Reference graph
Works this paper leans on
-
[1]
2023,, 1 Zenodo, doi: 10.5281/zenodo.10301324
Aslanyan, V., & Meyer, K. 2023,, 1 Zenodo, doi: 10.5281/zenodo.10301324
-
[2]
Aslanyan, V., Scott, R. B., Wilkins, C. P., et al. 2024, ApJ, 971, 137, doi: 10.3847/1538-4357/ad55ca
-
[3]
1986, Phys
Biskamp, D. 1986, Phys. Fluids, 29, 1520
1986
-
[4]
2000, Dr
Bradski, G. 2000, Dr. Dobb’s Journal of Software Tools
2000
-
[5]
Breu, C., Pontin, D., Priest, E., & Moortel, I. D. 2025
2025
-
[6]
Canny, J. 1986, IEEE Transactions on Pattern Analysis and Machine Intelligence, PAMI-8, 679, doi: 10.1109/TPAMI.1986.4767851
-
[7]
Dahlburg, R. B., Klimchuk, J. A., & Antiochos, S. K. 2005, Astrophys. J., 622, 1191, doi: 10.1086/425645
-
[8]
Dahlburg, R. B., Liu, J. H., Klimchuk, J. A., & Nigro, G. 2009, Astrophys. J., 704, 1059, doi: 10.1088/0004-637X/704/2/1059
-
[9]
DeForest, C. E., Hagenaar, H. J., Lamb, D. A., Parnell, C. E., & Welsch, B. T. 2007, ApJ, 666, 576, doi: 10.1086/518994
-
[10]
Dmitruk, P., & Gómez, D. O. 1999, Astrophys. J., 527, L63
1999
-
[11]
O., & Matthaeus, W
Dmitruk, P., Gómez, D. O., & Matthaeus, W. H. 2003, Phys. Plasmas, 10, 3584
2003
-
[12]
Galsgaard, K., & Nordlund, A. 1996, J. Geophys. Res., 101, 13445, doi: 10.1029/96JA00428
-
[13]
Galsgaard, K., & Nordlund, A. 1997, J. Geophys. Res., 102, 231
1997
-
[14]
Gudiksen, B. V., Carlsson, M., Hansteen, V. H., et al. 2011, A&A, 531, A154, doi: 10.1051/0004-6361/201116520
-
[15]
Harris, C. R., Millman, K. J., van der Walt, S. J., et al. 2020, Nature, 585, 357, doi: 10.1038/s41586-020-2649-2
-
[16]
2013, Physics of Plasmas, 20, 055702, doi: 10.1063/1.4802941
Huang, Y.-M., & Bhattacharjee, A. 2013, Physics of Plasmas, 20, 055702, doi: 10.1063/1.4802941
-
[17]
2016, The Astrophysical Journal, 818, 1, doi: 10.3847/0004-637X/818/1/20
Huang, Y.-M., & Bhattacharjee, A. 2016, The Astrophysical Journal, 818, 1, doi: 10.3847/0004-637X/818/1/20
-
[18]
Hunter, J. D. 2007, Computing in Science & Engineering, 9, 90, doi: 10.1109/MCSE.2007.55
-
[19]
Klimchuk, J. A. 2015, Philosophical Transactions of the Royal Society of London Series A, 373, 20140256, doi: 10.1098/rsta.2014.0256
-
[20]
Klimchuk, J. A., & Antiochos, S. K. 2021, Frontiers in Astronomy and Space Sciences, 8, 83, doi: 10.3389/fspas.2021.662861
-
[21]
Johnston, C. D. 2023, Frontiers in Physics, 11, 1198194, doi: 10.3389/fphy.2023.1198194
-
[22]
Leake, J. E., Daldorff, L. K. S., & Klimchuk, J. A. 2020, The Astrophysical Journal, 891, 62, doi: 10.3847/1538-4357/ab7193
-
[23]
Leake, J. E., Daldorff, L. K. S., & Klimchuk, J. A. 2024, Astrophys. J., 973, 21, doi: 10.3847/1538-4357/ad5e71
-
[24]
Loureiro, N. F., Schekochihin, A. A., & Uzdensky, D. A. 2013, Phys. Rev. E, 87, 013102, doi: 10.1103/PhysRevE.87.013102 Mikić, Z., Schnack, D. D., & van Hoven, G. 1989, Astrophys. J., 338, 1148, doi: 10.1086/167265
-
[25]
S., Lin, L., & Bhattacharjee, A
Ng, C. S., Lin, L., & Bhattacharjee, A. 2012, The Astrophysical Journal, 747, 109
2012
-
[26]
2010, Physics of Plasmas, 17, 052109, doi: 10.1063/1.3428553
Ni, L., Germaschewski, K., Huang, Y.-M., et al. 2010, Physics of Plasmas, 17, 052109, doi: 10.1063/1.3428553
-
[27]
1997,, Tech
Nordlund, A., & Galsgaard, K. 1997,, Tech. rep., Astronomical Observatory, Copenhagen University
1997
-
[28]
Parker, E. N. 1972, Astrophys. J., 174, 499, doi: 10.1086/151512
-
[29]
Parker, E. N. 1983, ApJ, 264, 635, doi: 10.1086/160636
-
[30]
Parker, E. N. 1988, Astrophys. J., 330, 474
1988
-
[31]
Pontin, D. I., & Hornig, G. 2015, Astrophys. J., 805, 47, doi: 10.1088/0004-637X/805/1/47
-
[32]
Pontin, D. I., & Hornig, G. 2020, Living Reviews in Solar Physics, 17, 5, doi: 10.1007/s41116-020-00026-5
-
[33]
Pontin, D. I., & Priest, E. R. 2022, Living Reviews in Solar Physics, 19, 1, doi: 10.1007/s41116-022-00032-9
-
[34]
Galsgaard, K. 2011, Astron. Astrophys., 525, A57, doi: 10.1051/0004-6361/201014544
-
[35]
R., Heyvaerts, J
Priest, E. R., Heyvaerts, J. F., & Title, A. M. 2002, Astrophys. J., 576, 533
2002
-
[36]
F., Velli, M., & Einaudi, G
Rappazzo, A. F., Velli, M., & Einaudi, G. 2010, Astrophys. J., 722, 65 18
2010
-
[37]
F., Velli, M., Einaudi, G., & Dahlburg, R
Rappazzo, A. F., Velli, M., Einaudi, G., & Dahlburg, R. B. 2008, Astrophys. J., 677, 1348, doi: 10.1086/528786
-
[38]
2017, The Astrophysical Journal Supplement Series, 230, 18, doi: 10.3847/1538-4365/aa6254
Rembiasz, T., Obergaulinger, M., Cerdá-Durán, P., Aloy, M.-A., & Müller, E. 2017, The Astrophysical Journal Supplement Series, 230, 18, doi: 10.3847/1538-4365/aa6254
-
[39]
Ritchie, M. L., Wilmot-Smith, A. L., & Hornig, G. 2016, ApJ, 824, 19, doi: 10.3847/0004-637X/824/1/19
-
[40]
Schindler, K., Hesse, M., & Birn, J. 1988, J. Geophys. Res., 93, 5547, doi: 10.1029/JA093iA06p05547
-
[41]
Titov, V. S. 2007, Astrophys. J., 660, 863, doi: 10.1086/512671 van Ballegooijen, A. A. 1988a, Geophys. Astrophys. Fluid Dynamics, 41, 181 van Ballegooijen, A. A. 1988b, in Solar and Stellar Coronal Structure and Dynamics, ed. R. C. Altrock, 115–124 van der Walt, S., Schönberger, J. L., Nunez-Iglesias, J., et al. 2014, PeerJ, 2, e453, doi: 10.7717/peerj.453
-
[42]
L., Pontin, D
Wilmot-Smith, A. L., Pontin, D. I., & Hornig, G. 2010, Astron. Astrophys., 516, A5
2010
-
[43]
Wyper, P. F., & Hesse, M. 2015, Physics of Plasmas, 22, 042117, doi: 10.1063/1.4918335
-
[44]
Wyper, P. F., & Pontin, D. I. 2014, Phys. Plasmas, 21, 082114, doi: 10.1063/1.4893149
discussion (0)
Sign in with ORCID, Apple, or X to comment. Anyone can read and Pith papers without signing in.