Making Multimodal LLMs Reliable Chart Data Extractors: A Benchmark and Training Framework
Pith reviewed 2026-06-30 05:27 UTC · model grok-4.3
The pith
A training framework based on progressive human-like learning enables 7B multimodal models to extract precise chart data at state-of-the-art levels.
A machine-rendered reading of the paper's core claim, the machinery that carries it, and where it could break.
Core claim
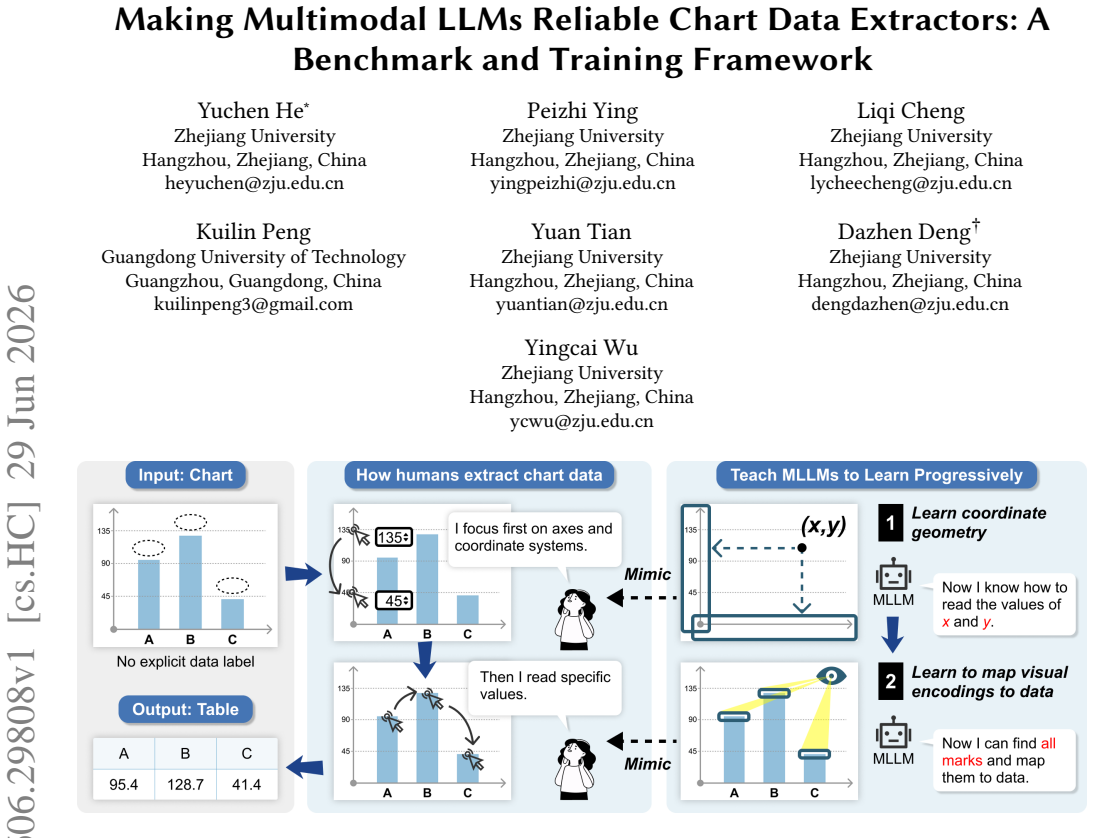
Chart data extraction from images should mimic the progressive learning process humans use when reading charts. Implementing this in a training framework for multimodal LLMs substantially improves the recovery of precise numerical values from unlabeled charts, resulting in state-of-the-art performance from a 7B-parameter model on a new benchmark of real-world charts.
What carries the argument
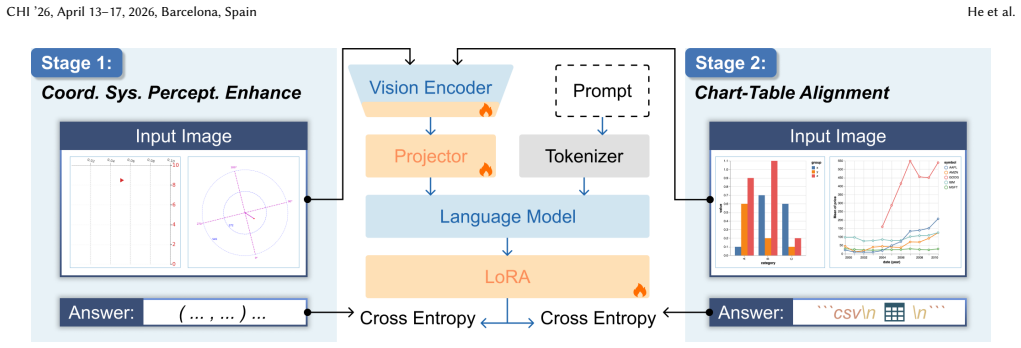
The progressive training framework that models chart reading as a step-by-step human-like process to improve value recovery.
Load-bearing premise
That modeling chart reading as a progressive human-like learning process will reliably close the gap in precise value recovery on the authors' benchmark of unlabeled real-world charts.
What would settle it
Running the progressive training on the benchmark and finding no significant gain in numerical accuracy over baseline fine-tuning would falsify the central claim.
Figures
read the original abstract
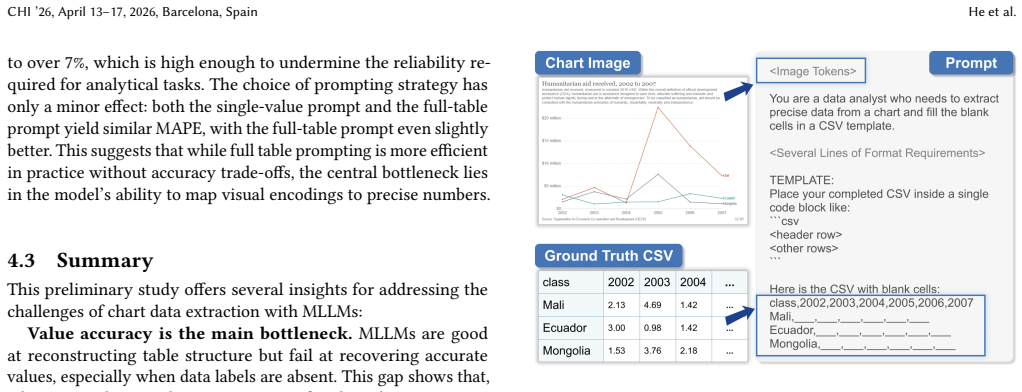
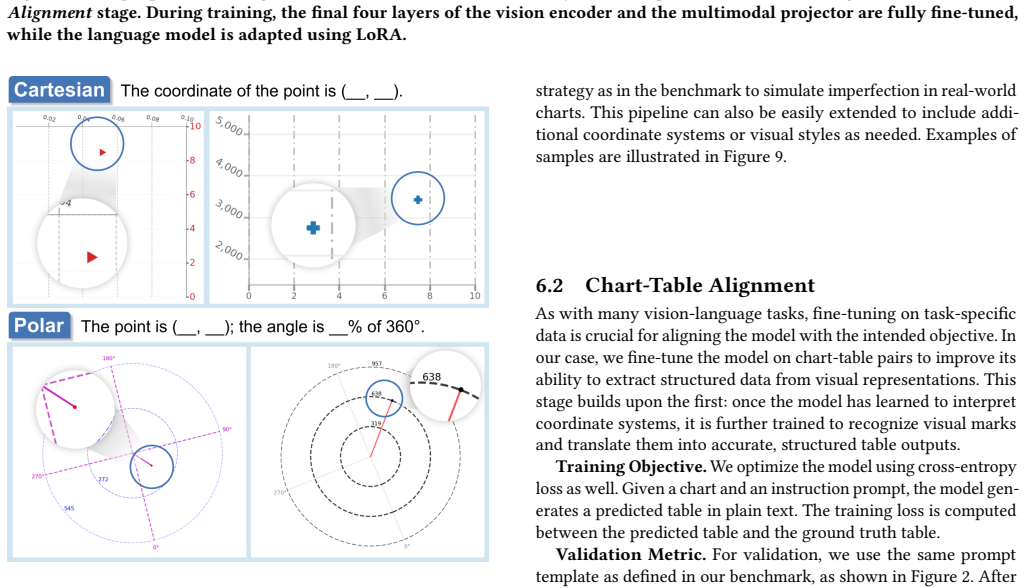
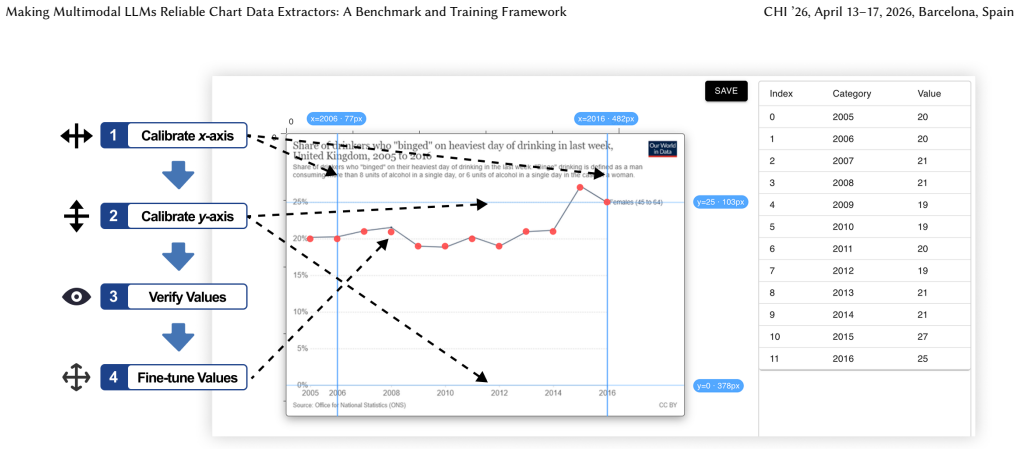
Chart data extraction, which reverse-engineers data tables from chart images, is essential for reproducibility, analysis, retrieval, and redesign. Existing interactive tools are reliable but tedious, and mixed-initiative systems, while more efficient, lack generalizability. Recent multimodal large language models (MLLMs) offer a unified interface for chart interpretation, yet their ability to extract accurate data tables, especially without visible labels, remains unclear. We build a benchmark featuring diverse real-world charts without data labels to evaluate this capability. Results show that, while current MLLMs reliably reconstruct table structures, they struggle with precise value recovery. To address this, we revisit chart data extraction from a human-centered perspective and argue that extraction should follow a progressive learning process similar to how people read charts. Our training framework substantially improves numerical accuracy, achieving state-of-the-art performance with a 7B-parameter model. A user study further shows that our model effectively supports mixed-initiative workflows for reliable chart data extraction.
Editorial analysis
A structured set of objections, weighed in public.
Referee Report
Summary. The paper introduces a benchmark of diverse unlabeled real-world charts to evaluate MLLMs on chart data extraction. It reports that current MLLMs reliably reconstruct table structures but struggle with precise numerical value recovery. The authors propose a human-centered progressive training framework modeled on how people read charts; this framework is claimed to substantially improve numerical accuracy and reach state-of-the-art performance using a 7B-parameter model. A user study is presented showing the model supports mixed-initiative workflows.
Significance. If the quantitative claims hold on a properly constructed benchmark, the work would demonstrate a practical route to reliable chart data extraction with relatively small models, which could benefit reproducibility, data analysis, and visualization tools. The human-centered progressive-learning framing is a constructive angle that merits empirical testing.
major comments (1)
- [Abstract] Abstract: the central claim of 'state-of-the-art performance' and 'substantially improves numerical accuracy' is asserted without any reported metrics, baselines, dataset sizes, error bars, or exclusion criteria, rendering the magnitude and reliability of the improvement unverifiable from the provided text.
Simulated Author's Rebuttal
We thank the referee for their review and for highlighting the need for greater verifiability in the abstract. We address the comment below and will revise the manuscript accordingly.
read point-by-point responses
-
Referee: [Abstract] Abstract: the central claim of 'state-of-the-art performance' and 'substantially improves numerical accuracy' is asserted without any reported metrics, baselines, dataset sizes, error bars, or exclusion criteria, rendering the magnitude and reliability of the improvement unverifiable from the provided text.
Authors: We agree that the abstract, as currently written, summarizes the claims at a high level without the supporting quantitative details the referee requests. The full manuscript reports these elements in the experimental sections (benchmark construction, baseline comparisons, numerical accuracy results with standard deviations, and dataset statistics). To make the central claims immediately verifiable from the abstract itself, we will revise it to include the key metrics, baseline references, and dataset scale. This is a straightforward and warranted change. revision: yes
Circularity Check
No significant circularity detected
full rationale
The provided abstract and text describe a benchmark of unlabeled real-world charts plus a human-centered progressive training framework for MLLMs. No equations, fitted parameters, self-citations, or uniqueness theorems appear. The central claim of improved numerical accuracy is presented as an empirical outcome of the framework rather than a derivation that reduces to its own inputs by construction. The derivation chain is therefore self-contained against external benchmarks.
Axiom & Free-Parameter Ledger
Reference graph
Works this paper leans on
-
[1]
Mubashara Akhtar, Nikesh Subedi, Vivek Gupta, Sahar Tahmasebi, Oana Co- carascu, and Elena Simperl. 2024. ChartCheck: Explainable Fact-Checking over Real-World Chart Images. InFindings of the Association for Computational Lin- guistics: ACL 2024. Association for Computational Linguistics, Bangkok, Thailand, 13921–13937. doi:10.18653/v1/2024.findings-acl.828
-
[2]
Shuai Bai, Keqin Chen, Xuejing Liu, Jialin Wang, Wenbin Ge, Sibo Song, Kai Dang, Peng Wang, Shijie Wang, Jun Tang, et al. 2025. Qwen2.5-VL Technical Report. arXiv:2502.13923 [cs.CV]
work page internal anchor Pith review Pith/arXiv arXiv 2025
-
[3]
Aaron Bangor, Philip T. Kortum, and James T. Miller. 2008. An Empirical Evalu- ation of the System Usability Scale.International Journal of Human–Computer Interaction24, 6 (2008), 574–594. doi:10.1080/10447310802205776
-
[4]
Ekaba Bisong. 2019. Matplotlib and Seaborn. InBuilding Machine Learning and Deep Learning Models on Google Cloud Platform: A Comprehensive Guide for Beginners. Apress, Berkeley, CA, 151–165. doi:10.1007/978-1-4842-4470-8_12
-
[5]
John Brooke. 2013. SUS: a retrospective.J. Usability Studies8, 2 (Feb. 2013), 29–40
2013
-
[6]
Chengliang Chai, Guoliang Li, Ju Fan, and Yuyu Luo. 2021. CrowdChart: Crowd- sourced Data Extraction From Visualization Charts.IEEE Transactions on Knowl- edge and Data Engineering33, 11 (2021), 3537–3549. doi:10.1109/TKDE.2020. 2972543
-
[7]
Jinyue Chen, Lingyu Kong, Haoran Wei, Chenglong Liu, Zheng Ge, Liang Zhao, Jianjian Sun, Chunrui Han, and Xiangyu Zhang. 2024. OneChart: Purify the Chart Structural Extraction via One Auxiliary Token. InProceedings of the 32nd ACM International Conference on Multimedia(Melbourne VIC, Australia)(MM ’24). Association for Computing Machinery, New York, NY, U...
-
[8]
Nan Chen, Yuge Zhang, Jiahang Xu, Kan Ren, and Yuqing Yang. 2025. VisEval: A Benchmark for Data Visualization in the Era of Large Language Models.IEEE Transactions on Visualization and Computer Graphics31, 1 (2025), 1301–1311. doi:10.1109/TVCG.2024.3456320
- [9]
-
[10]
Zixin Chen, Sicheng Song, KaShun Shum, Yanna Lin, Rui Sheng, Weiqi Wang, and Huamin Qu. 2025. Unmasking Deceptive Visuals: Benchmarking Multimodal Large Language Models on Misleading Chart Question Answering. InProceedings of the 2025 Conference on Empirical Methods in Natural Language Processing. Association for Computational Linguistics, Suzhou, China, ...
2025
-
[11]
Zhe Chen, Jiannan Wu, Wenhai Wang, Weijie Su, Guo Chen, Sen Xing, Muyan Zhong, Qinglong Zhang, Xizhou Zhu, Lewei Lu, et al. 2024. InternVL: Scaling up Vision Foundation Models and Aligning for Generic Visual-Linguistic Tasks. In Proceedings of the IEEE/CVF Conference on Computer Vision and Pattern Recognition (CVPR). 24185–24198
2024
-
[12]
Gheorghe Comanici, Eric Bieber, Mike Schaekermann, Ice Pasupat, Noveen Sachdeva, Inderjit Dhillon, Marcel Blistein, Ori Ram, Dan Zhang, Evan Rosen, et al . 2025. Gemini 2.5: Pushing the Frontier with Advanced Reason- ing, Multimodality, Long Context, and Next Generation Agentic Capabilities. arXiv:2507.06261 [cs.CL]
work page internal anchor Pith review Pith/arXiv arXiv 2025
-
[13]
Wenjing Dai, Meng Wang, Zhibin Niu, and Jiawan Zhang. 2018. Chart decoder: Generating textual and numeric information from chart images automatically. Journal of Visual Languages & Computing48 (2018), 101–109
2018
- [14]
-
[15]
Kenny Davila, Srirangaraj Setlur, David Doermann, Bhargava Urala Kota, and Venu Govindaraju. 2020. Chart mining: A survey of methods for automated chart analysis.IEEE transactions on pattern analysis and machine intelligence43, 11 (2020), 3799–3819
2020
-
[16]
Dazhen Deng, Yihong Wu, Xinhuan Shu, Jiang Wu, Siwei Fu, Weiwei Cui, and Yingcai Wu. 2023. VisImages: A Fine-Grained Expert-Annotated Visualization Dataset.IEEE Transactions on Visualization and Computer Graphics29, 7 (2023), 3298–3311. doi:10.1109/TVCG.2022.3155440
- [17]
-
[18]
Wenyi Hong, Wenmeng Yu, Xiaotao Gu, Guo Wang, Guobing Gan, Haomiao Tang, Jiale Cheng, Ji Qi, Junhui Ji, Lihang Pan, et al. 2025. GLM-4.5V and GLM-4.1V- Thinking: Towards Versatile Multimodal Reasoning with Scalable Reinforcement Learning. arXiv:2507.01006 [cs.CV]
work page internal anchor Pith review Pith/arXiv arXiv 2025
-
[19]
Enamul Hoque, Parsa Kavehzadeh, and Ahmed Masry. 2022. Chart Question Answering: State of the Art and Future Directions.Computer Graphics Forum41, 3 (2022), 555–572. doi:10.1111/cgf.14573
-
[20]
Eric Horvitz. 1999. Principles of mixed-initiative user interfaces. InProceedings of the SIGCHI Conference on Human Factors in Computing Systems(Pittsburgh, Pennsylvania, USA)(CHI ’99). Association for Computing Machinery, New York, NY, USA, 159–166. doi:10.1145/302979.303030
-
[21]
Edward J Hu, Yelong Shen, Phillip Wallis, Zeyuan Allen-Zhu, Yuanzhi Li, Shean Wang, Lu Wang, Weizhu Chen, et al. 2022. Lora: Low-rank adaptation of large language models.ICLR1, 2 (2022), 3
2022
-
[22]
Bakker, Stephen Li, Tim Kraska, and César Hidalgo
Kevin Hu, Michiel A. Bakker, Stephen Li, Tim Kraska, and César Hidalgo. 2019. VizML: A Machine Learning Approach to Visualization Recommendation. In Proceedings of the 2019 CHI Conference on Human Factors in Computing Systems (Glasgow, Scotland Uk)(CHI ’19). Association for Computing Machinery, New York, NY, USA, 1–12. doi:10.1145/3290605.3300358
-
[23]
Gaikwad, Madelon Hulsebos, Michiel A
Kevin Hu, Snehalkumar ’Neil’ S. Gaikwad, Madelon Hulsebos, Michiel A. Bakker, Emanuel Zgraggen, César Hidalgo, Tim Kraska, Guoliang Li, Arvind Satya- narayan, and Çağatay Demiralp. 2019. VizNet: Towards A Large-Scale Visu- alization Learning and Benchmarking Repository. InProceedings of the 2019 CHI Conference on Human Factors in Computing Systems(Glasgow...
-
[24]
Kung-Hsiang Huang, Hou Pong Chan, May Fung, Haoyi Qiu, Mingyang Zhou, Shafiq Joty, Shih-Fu Chang, and Heng Ji. 2025. From Pixels to Insights: A Survey on Automatic Chart Understanding in the Era of Large Foundation Models. IEEE Transactions on Knowledge and Data Engineering37, 5 (2025), 2550–2568. doi:10.1109/TKDE.2024.3513320
-
[25]
Kung-Hsiang Huang, Mingyang Zhou, Hou Pong Chan, Yi Fung, Zhenhailong Wang, Lingyu Zhang, Shih-Fu Chang, and Heng Ji. 2024. Do LVLMs Understand Charts? Analyzing and Correcting Factual Errors in Chart Captioning. InFindings of the Association for Computational Linguistics: ACL 2024. Association for Compu- tational Linguistics, Bangkok, Thailand, 730–749. ...
-
[26]
Aaron Hurst, Adam Lerer, Adam P Goucher, Adam Perelman, Aditya Ramesh, Aidan Clark, AJ Ostrow, Akila Welihinda, Alan Hayes, Alec Radford, et al. 2024. GPT-4o System Card. arXiv:2410.21276 [cs.CL]
work page internal anchor Pith review Pith/arXiv arXiv 2024
-
[27]
OpenAI Inc. 2025. Introducing GPT-4.1 in the API. https://openai.com/index/gpt- 4-1/
2025
-
[28]
Mohaiminul Islam and Shangzhu Jin. 2019. An Overview of Data Visualization. In2019 International Conference on Information Science and Communications Technologies (ICISCT). 1–7. doi:10.1109/ICISCT47635.2019.9012031
-
[29]
Mohammed Saidul Islam, Raian Rahman, Ahmed Masry, Md Tahmid Rahman Laskar, Mir Tafseer Nayeem, and Enamul Hoque. 2024. Are Large Vision Language Models up to the Challenge of Chart Comprehension and Reasoning. InFindings of the Association for Computational Linguistics: EMNLP 2024. Association for Computational Linguistics, Miami, Florida, USA, 3334–3368....
-
[30]
Hyeon Jeon, Hyunwook Lee, Yun-Hsin Kuo, Taehyun Yang, Daniel Archambault, Sungahn Ko, Takanori Fujiwara, Kwan-Liu Ma, and Jinwook Seo. 2025. Unveil- ing High-dimensional Backstage: A Survey for Reliable Visual Analytics with Dimensionality Reduction. InProceedings of the 2025 CHI Conference on Human Factors in Computing Systems (CHI ’25). Association for ...
-
[31]
Daekyoung Jung, Wonjae Kim, Hyunjoo Song, Jeong-in Hwang, Bongshin Lee, Bohyoung Kim, and Jinwook Seo. 2017. ChartSense: Interactive Data Extraction from Chart Images. InProceedings of the 2017 CHI Conference on Human Factors in Computing Systems(Denver, Colorado, USA)(CHI ’17). Association for Computing Machinery, New York, NY, USA, 6706–6717. doi:10.114...
-
[32]
Kushal Kafle, Brian Price, Scott Cohen, and Christopher Kanan. 2018. DVQA: Understanding Data Visualizations via Question Answering. InProceedings of the IEEE Conference on Computer Vision and Pattern Recognition (CVPR)
2018
-
[33]
Samira Ebrahimi Kahou, Vincent Michalski, Adam Atkinson, Akos Kadar, Adam Trischler, and Yoshua Bengio. 2018. FigureQA: An Annotated Figure Dataset for Visual Reasoning. arXiv:1710.07300 [cs.CV]
work page internal anchor Pith review Pith/arXiv arXiv 2018
-
[34]
UW Interactive Data Lab. 2025. Vega-Lite Example Gallery. https://vega.github. io/vega-lite/examples/
2025
-
[35]
Yijie Lian, Jianing Hao, Wei Zeng, and Qiong Luo. 2025. A survey of visual insight mining: Connecting data and insights via visualization.Visual Informatics9, 4 (2025), 100271. doi:10.1016/j.visinf.2025.100271
- [36]
-
[37]
Fangyu Liu, Francesco Piccinno, Syrine Krichene, Chenxi Pang, Kenton Lee, Man- dar Joshi, Yasemin Altun, Nigel Collier, and Julian Eisenschlos. 2023. MatCha: Enhancing Visual Language Pretraining with Math Reasoning and Chart Deren- dering. InProceedings of the 61st Annual Meeting of the Association for Com- putational Linguistics (Volume 1: Long Papers)....
-
[38]
Haotian Liu, Chunyuan Li, Yuheng Li, and Yong Jae Lee. 2024. Improved Baselines with Visual Instruction Tuning. InProceedings of the IEEE/CVF Conference on CHI ’26, April 13–17, 2026, Barcelona, Spain He et al. Computer Vision and Pattern Recognition (CVPR). 26296–26306
2024
-
[39]
Haotian Liu, Chunyuan Li, Yuheng Li, Bo Li, Yuanhan Zhang, Sheng Shen, and Yong Jae Lee. 2024. LLaVA-NeXT: Improved reasoning, OCR, and world knowl- edge. https://llava-vl.github.io/blog/2024-01-30-llava-next/
2024
-
[40]
Haotian Liu, Chunyuan Li, Qingyang Wu, and Yong Jae Lee. 2023. Visual in- struction tuning.Advances in neural information processing systems36 (2023), 34892–34916
2023
- [41]
-
[42]
Yuan Liu, Haodong Duan, Yuanhan Zhang, Bo Li, Songyang Zhang, Wangbo Zhao, Yike Yuan, Jiaqi Wang, Conghui He, Ziwei Liu, Kai Chen, and Dahua Lin
-
[43]
InComputer Vision – ECCV 2024
MMBench: Is Your Multi-modal Model an All-Around Player?. InComputer Vision – ECCV 2024. Springer Nature Switzerland, Cham, 216–233
2024
-
[44]
Automeris LLC. 2024. WebPlotDigitizer. https://automeris.io
2024
-
[45]
Junyu Luo, Zekun Li, Jinpeng Wang, and Chin-Yew Lin. 2021. ChartOCR: Data Extraction From Charts Images via a Deep Hybrid Framework. InProceedings of the IEEE/CVF Winter Conference on Applications of Computer Vision (W ACV). 1917–1925
2021
- [46]
-
[47]
Ahmed Masry, Mohammed Saidul Islam, Mahir Ahmed, Aayush Bajaj, Firoz Kabir, Aaryaman Kartha, Md Tahmid Rahman Laskar, Mizanur Rahman, Shadikur Rahman, Mehrad Shahmohammadi, et al. 2025. ChartQAPro: A More Diverse and Challenging Benchmark for Chart Question Answering. arXiv:2504.05506 [cs.CL]
- [48]
-
[49]
Ahmed Masry, Do Xuan Long, Jia Qing Tan, Shafiq Joty, and Enamul Hoque. 2022. ChartQA: A Benchmark for Question Answering about Charts with Visual and Logical Reasoning. InFindings of the Association for Computational Linguistics: ACL 2022. Association for Computational Linguistics, Dublin, Ireland, 2263–2279. doi:10.18653/v1/2022.findings-acl.177
-
[50]
Ahmed Masry, Mehrad Shahmohammadi, Md Rizwan Parvez, Enamul Hoque, and Shafiq Joty. 2024. ChartInstruct: Instruction Tuning for Chart Comprehension and Reasoning. InFindings of the Association for Computational Linguistics: ACL 2024. Association for Computational Linguistics, Bangkok, Thailand, 10387–10409. doi:10.18653/v1/2024.findings-acl.619
-
[51]
Damien Masson, Sylvain Malacria, Daniel Vogel, Edward Lank, and Géry Casiez
-
[52]
ChartDetective: Easy and Accurate Interactive Data Extraction from Complex Vector Charts. InProceedings of the 2023 CHI Conference on Hu- man Factors in Computing Systems(Hamburg, Germany)(CHI ’23). Associa- tion for Computing Machinery, New York, NY, USA, Article 147, 17 pages. doi:10.1145/3544548.3581113
-
[53]
Nacenta, and Sebastien Vandenheste
Gonzalo Gabriel Méndez, Miguel A. Nacenta, and Sebastien Vandenheste. 2016. iVoLVER: Interactive Visual Language for Visualization Extraction and Recon- struction. InProceedings of the 2016 CHI Conference on Human Factors in Com- puting Systems(San Jose, California, USA)(CHI ’16). Association for Computing Machinery, New York, NY, USA, 4073–4085. doi:10.1...
- [54]
-
[55]
Khapra, and Pratyush Kumar
Nitesh Methani, Pritha Ganguly, Mitesh M. Khapra, and Pratyush Kumar. 2020. PlotQA: Reasoning over Scientific Plots. InProceedings of the IEEE/CVF Winter Conference on Applications of Computer Vision (W ACV)
2020
- [56]
-
[57]
Donald A. Norman. 1994. How might people interact with agents.Commun. ACM37, 7 (July 1994), 68–71. doi:10.1145/176789.176796
- [58]
-
[59]
PlotDigitizer. 2025. PlotDigitizer. https://plotdigitizer.com
2025
-
[60]
Raian Rahman, Rizvi Hasan, Abdullah Al Farhad, Md. Tahmid Rahman Laskar, Md. Hamjajul Ashmafee, and Abu Raihan Mostofa Kamal. 2023. ChartSumm: A Comprehensive Benchmark for Automatic Chart Summarization of Long and Short Summaries.Proceedings of the Canadian Conference on Artificial Intelligence (June 2023). doi:10.21428/594757db.0b1f96f6
-
[61]
Arvind Satyanarayan, Dominik Moritz, Kanit Wongsuphasawat, and Jeffrey Heer
-
[62]
Vega-Lite: A Grammar of Interactive Graphics.IEEE Transactions on Visualization and Computer Graphics23, 1 (2017), 341–350. doi:10.1109/TVCG. 2016.2599030
-
[63]
Manolis Savva, Nicholas Kong, Arti Chhajta, Li Fei-Fei, Maneesh Agrawala, and Jeffrey Heer. 2011. ReVision: automated classification, analysis and redesign of chart images. InProceedings of the 24th Annual ACM Symposium on User Interface Software and Technology(Santa Barbara, California, USA)(UIST ’11). Association for Computing Machinery, New York, NY, U...
-
[64]
Danqing Shi, Yao Wang, Yunpeng Bai, Andreas Bulling, and Antti Oulasvirta. 2025. Chartist: Task-driven Eye Movement Control for Chart Reading. InProceedings of the 2025 CHI Conference on Human Factors in Computing Systems (CHI ’25). Association for Computing Machinery, New York, NY, USA, Article 1167, 14 pages. doi:10.1145/3706598.3713128
-
[65]
Benny Tang, Angie Boggust, and Arvind Satyanarayan. 2023. VisText: A Bench- mark for Semantically Rich Chart Captioning. InProceedings of the 61st Annual Meeting of the Association for Computational Linguistics (Volume 1: Long Pa- pers). Association for Computational Linguistics, Toronto, Canada, 7268–7298. doi:10.18653/v1/2023.acl-long.401
-
[66]
Yuan Tian, Weiwei Cui, Dazhen Deng, Xinjing Yi, Yurun Yang, Haidong Zhang, and Yingcai Wu. 2025. ChartGPT: Leveraging LLMs to Generate Charts From Abstract Natural Language.IEEE Transactions on Visualization and Computer Graphics31, 3 (2025), 1731–1745. doi:10.1109/TVCG.2024.3368621
- [67]
-
[68]
Yuan Tian, Chuhan Zhang, Xiaotong Wang, Sitong Pan, Weiwei Cui, Haidong Zhang, Dazhen Deng, and Yingcai Wu. 2025. ReSpark: Leveraging Previous Data Reports as References to Generate New Reports with LLMs. InProceedings of the 38th Annual ACM Symposium on User Interface Software and Technology (UIST ’25). Association for Computing Machinery, New York, NY, ...
-
[69]
B. Tummers. 2006. DataThief III. https://datathief.org
2006
-
[70]
Zirui Wang, Mengzhou Xia, Luxi He, Howard Chen, Yitao Liu, Richard Zhu, Kaiqu Liang, Xindi Wu, Haotian Liu, Sadhika Malladi, et al. 2024. Charxiv: Charting gaps in realistic chart understanding in multimodal llms.Advances in Neural Information Processing Systems37 (2024), 113569–113697
2024
-
[71]
Jiayang Wu, Wensheng Gan, Zefeng Chen, Shicheng Wan, and Philip S. Yu
-
[72]
In2023 IEEE International Conference on Big Data (BigData)
Multimodal Large Language Models: A Survey. In2023 IEEE International Conference on Big Data (BigData). 2247–2256. doi:10.1109/BigData59044.2023. 10386743
- [73]
- [74]
-
[75]
Zhengzhuo Xu, Sinan Du, Yiyan Qi, Chengjin Xu, Chun Yuan, and Jian Guo
-
[76]
ChartBench: A Benchmark for Complex Visual Reasoning in Charts. arXiv:2312.15915 [cs.CV]
- [77]
- [78]
-
[79]
Yilin Ye, Jianing Hao, Yihan Hou, Zhan Wang, Shishi Xiao, Yuyu Luo, and Wei Zeng. 2024. Generative AI for visualization: State of the art and future directions. Visual Informatics8, 2 (2024), 43–66. doi:10.1016/j.visinf.2024.04.003
-
[80]
Shukang Yin, Chaoyou Fu, Sirui Zhao, Ke Li, Xing Sun, Tong Xu, and Enhong Chen. 2024. A survey on multimodal large language models.National Science Review11, 12 (11 2024), nwae403. doi:10.1093/nsr/nwae403
discussion (0)
Sign in with ORCID, Apple, or X to comment. Anyone can read and Pith papers without signing in.