Assessing Ultra-Cool Dwarf Contamination in Photometrically Selected High-Redshift Galaxy Samples
Pith reviewed 2026-07-03 09:21 UTC · model grok-4.3
The pith
FC-ENZO predicts ultra-cool dwarf contamination fractions are similar across deep surveys but concentrated near each survey's limiting magnitude.
A machine-rendered reading of the paper's core claim, the machinery that carries it, and where it could break.
Core claim
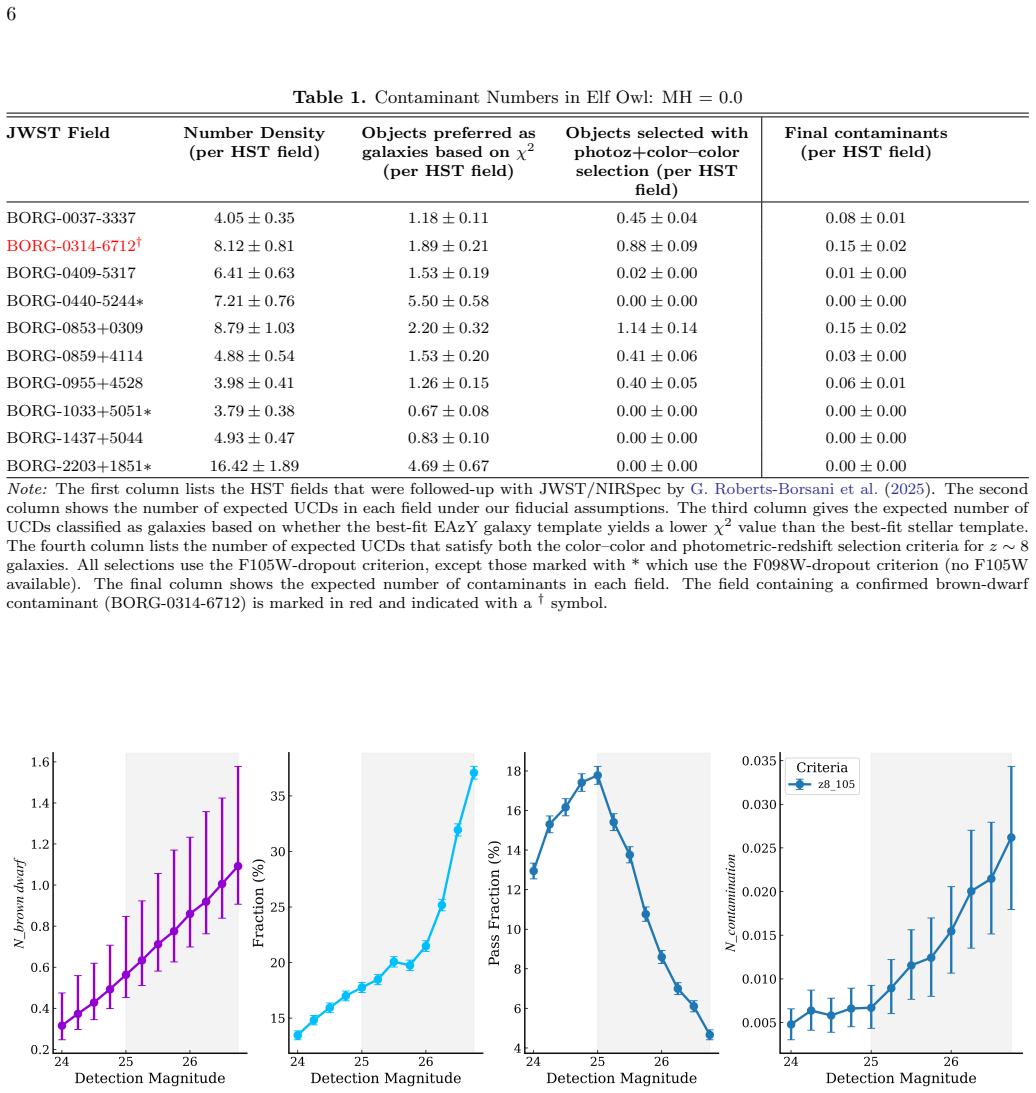
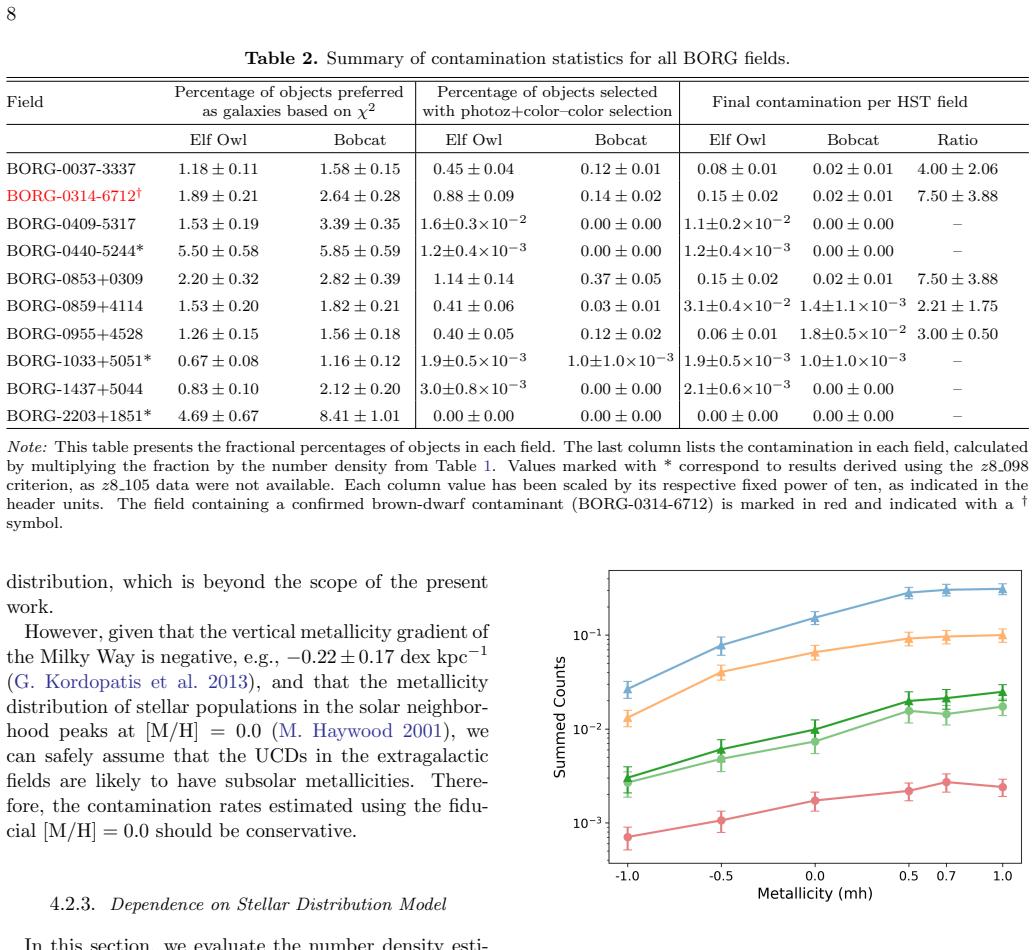
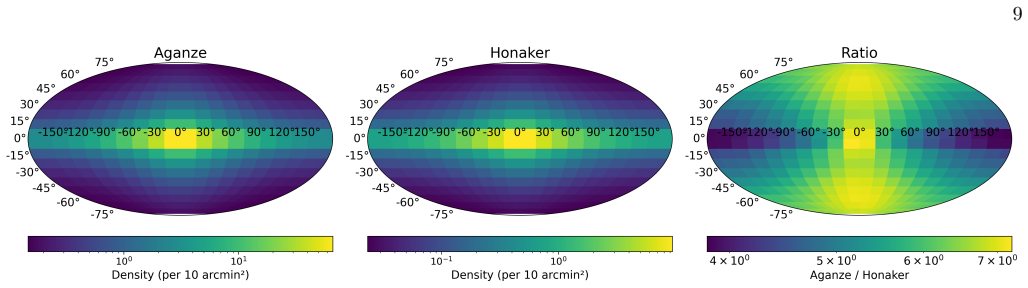
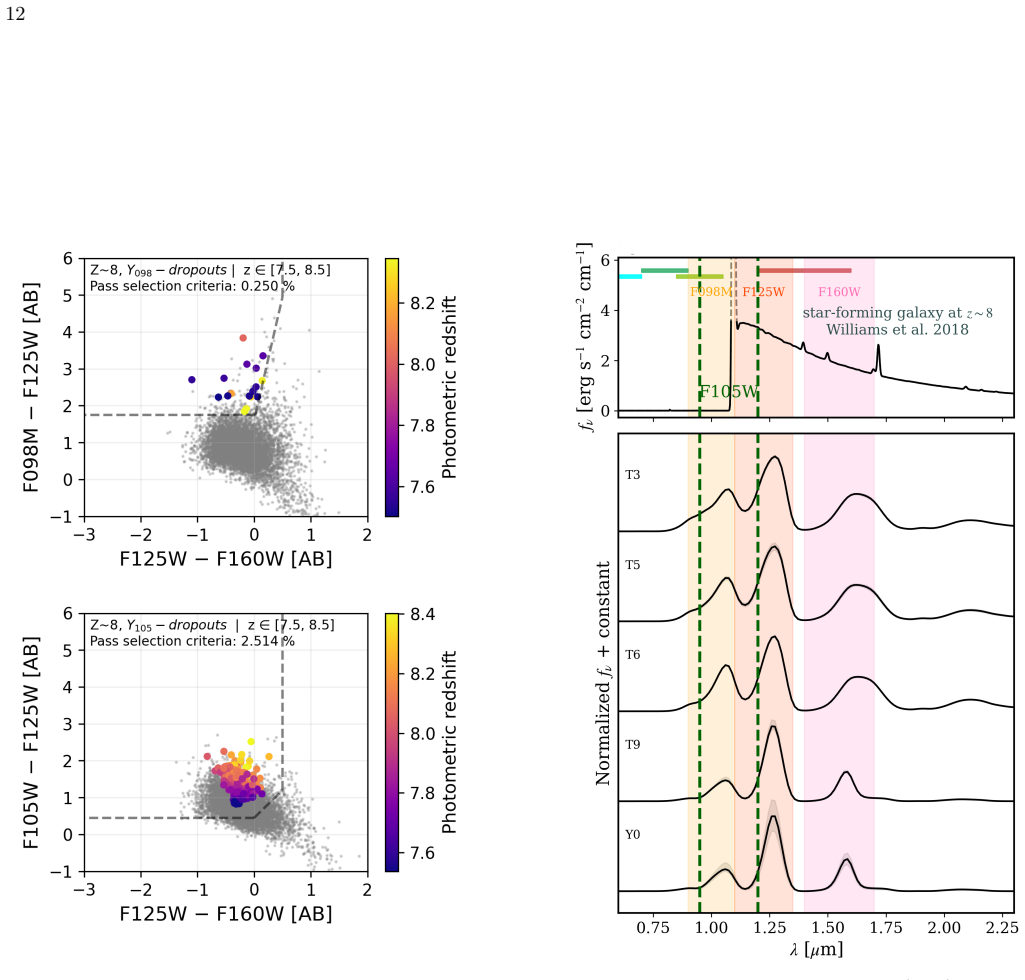
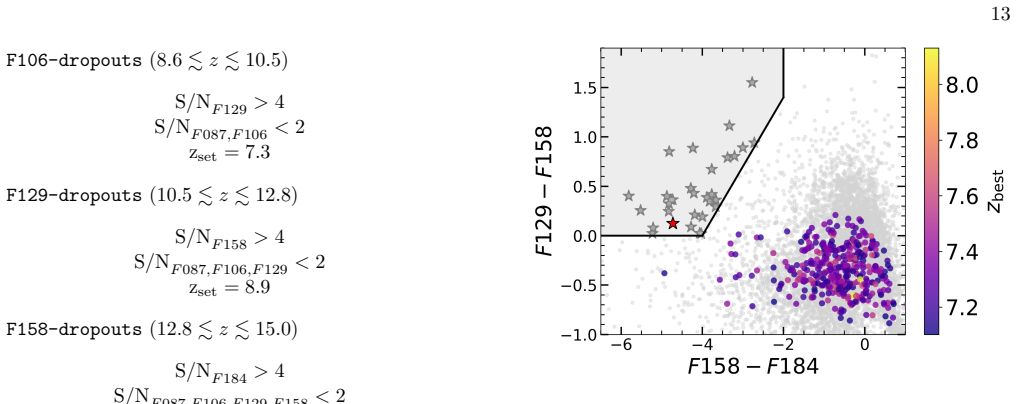
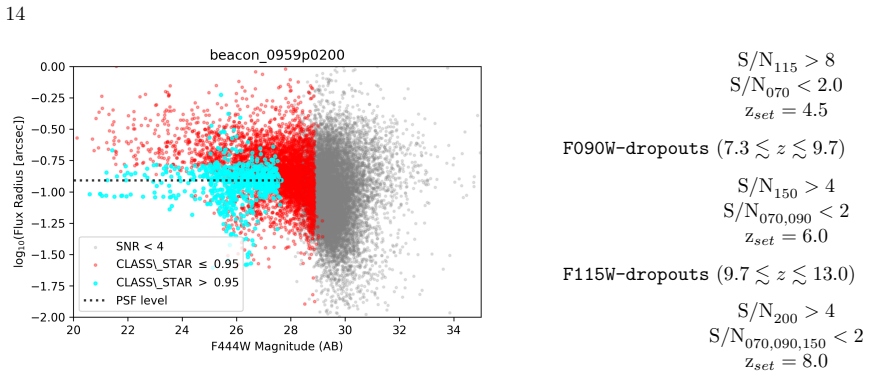
FC-ENZO models the expected surface density of UCDs, synthesizes their photometry from two libraries, and counts how many pass a user's color or photo-z cuts; the resulting contaminant fractions rise with metallicity, are higher with the ELF OWL library than with BOBCAT, and remain similar across telescope surveys within a given redshift bin while concentrating near the limiting magnitude.
What carries the argument
FC-ENZO, a code that synthesizes dwarf-star photometry from chosen SED libraries and counts the fraction that satisfy user-specified high-redshift selection criteria.
If this is right
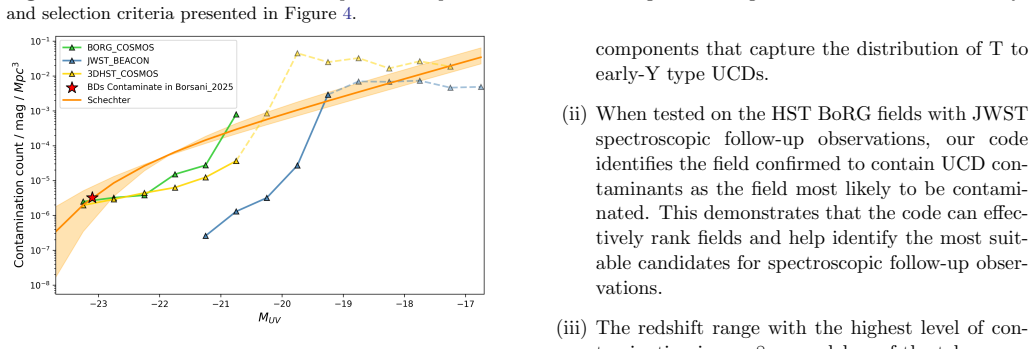
- Contamination rises with metallicity and is highest for T to early-Y dwarfs at z approximately 8.
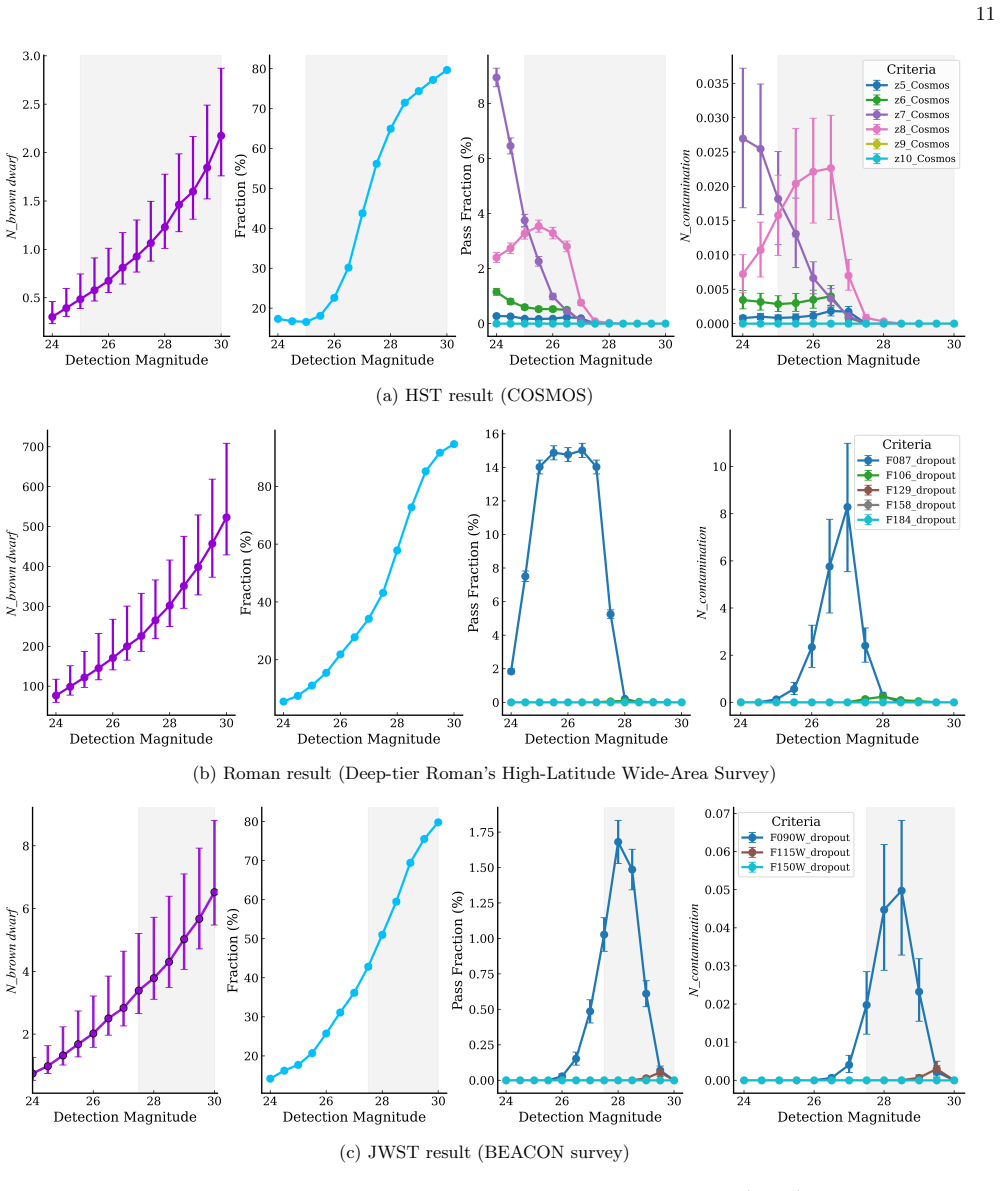
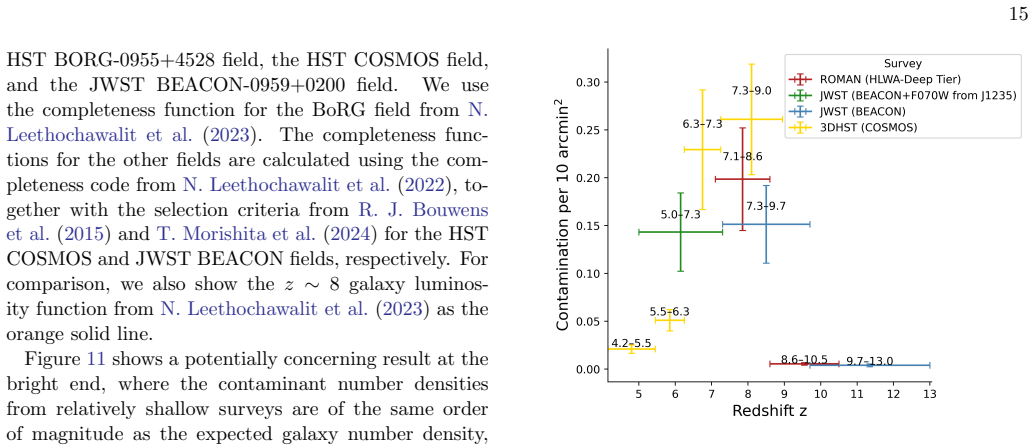
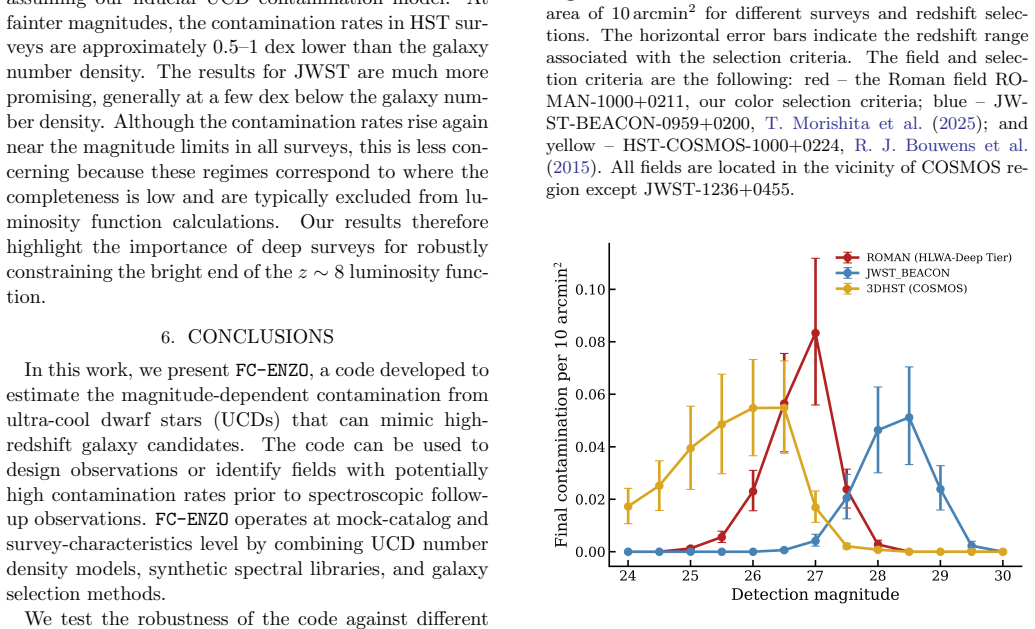
- Overall contamination levels are comparable across deep HST, Roman, and JWST surveys in the same redshift range.
- The bulk of contaminants sit near each survey's limiting magnitude.
- At brighter magnitudes the relative contamination is largest for HST, then Roman, then JWST.
- The code supplies a practical way to rank fields for spectroscopic follow-up.
Where Pith is reading between the lines
- Survey teams could run FC-ENZO before finalizing filter sets to shift the contamination peak away from the science sample.
- Brighter subsets of a catalog are likely to need less aggressive cleaning than the faintest bins.
- The library-to-library difference points to a need for improved atmospheric models of UCDs before contamination can be treated as a solved systematic.
- The same machinery could be adapted to test contamination by other foreground populations once their SED libraries exist.
Load-bearing premise
The two synthetic spectral libraries and the chosen stellar density models give an unbiased picture of real ultra-cool dwarf spectra and spatial distribution.
What would settle it
A spectroscopic census of ultra-cool dwarfs in one of the survey fields that yields a number of interlopers differing by more than the model's stated uncertainty from the FC-ENZO prediction for the same magnitude and color cuts.
Figures
read the original abstract
Ultra-cool dwarf stars (UCDs) are a common source of contamination in high-redshift galaxy searches as both sources are red and these early-forming galaxies can have sizes that are difficult to resolve even with space telescopes. Standard selection techniques, including photometric redshift estimation and color-color criteria, cannot fully eliminate this contamination. We develop \textbf{F}oreground \textbf{C}ontamination \textbf{E}valuator of \textbf{N}earby dwarf stars in high-\textbf{Z} photometrically selected \textbf{O}bjects (FC-ENZO), a code that predicts the number of dwarf stars misidentified as high-redshift galaxies for a given survey setup. FC-ENZO models the number of UCDs and evaluates the fraction of synthesized dwarf stars that passes user-specified selection methods. We compare two synthetic spectral energy distribution libraries and find that the ELF OWL library, which relaxes the assumption of chemical equilibrium, predicts larger contaminant fractions than the BOBCAT library, because of stronger absorption features around $ 1 $ \micron. The contamination fraction increases with metallicity and also depends on the adopted stellar number-density model. The dominant contaminants are T to early Y-type UCDs, which are most commonly misclassified as galaxies at $z \sim 8$. Comparing deep surveys from different space telescopes, we find similar overall contamination levels within the same redshift range. However, the contamination is concentrated near the limiting magnitude of each survey. At brighter magnitudes, the relative contamination is highest for HST (COSMOS), followed by Roman deep-tier survey, and JWST. Although the predicted contaminant numbers remain sensitive to model assumptions, FC-ENZO provides a practical tool for survey design and for identifying optimal fields for spectroscopic follow-up.
Editorial analysis
A structured set of objections, weighed in public.
Referee Report
Summary. The paper introduces FC-ENZO, a code that uses two synthetic SED libraries (ELF OWL and BOBCAT) together with stellar number-density models to predict the number of ultra-cool dwarf (UCD) stars that pass photometric selection criteria and are therefore misidentified as high-redshift galaxies. It reports that ELF OWL yields higher contamination fractions than BOBCAT owing to stronger ~1 μm absorption, that fractions increase with metallicity, that T-to-early-Y dwarfs dominate at z~8, and that overall contamination levels are similar across deep HST, Roman, and JWST surveys within a given redshift bin although concentrated near each survey’s limiting magnitude.
Significance. If the adopted SED libraries and density models prove representative of real UCD populations, FC-ENZO would supply a practical, survey-specific forecasting tool that could inform both observing strategy and the choice of fields for spectroscopic follow-up. The cross-survey comparison and the identification of the dominant contaminant spectral types are potentially useful for the design of next-generation high-z galaxy programs.
major comments (2)
- [Abstract] Abstract and methods: the quantitative contamination fractions rest on the unvalidated premise that the ELF OWL and BOBCAT libraries correctly reproduce the distribution of real UCD absorption features (especially near 1 μm) and that the chosen stellar number-density models give unbiased spatial counts; no comparison to spectroscopically confirmed UCD contaminants or to observed number counts is described, so the absolute fractions and the claim of similar contamination across HST/Roman/JWST cannot be assessed for systematic bias.
- [Abstract] Abstract: no description is given of the precise algorithm or selection-function implementation used to compute the fraction of synthesized dwarfs that pass the user-specified photometric criteria, nor are error bars or sensitivity ranges on those fractions reported despite the explicit dependence on metallicity and density-model choice.
minor comments (2)
- [Abstract] The abstract states that contamination is “concentrated near the limiting magnitude” but does not define the magnitude binning or the precise metric used to quantify this concentration.
- The paper would benefit from a short table or figure that tabulates the adopted free parameters (metallicity grid, density-model variants) and the resulting range in contamination fractions for each survey.
Simulated Author's Rebuttal
We thank the referee for their careful reading and valuable comments on our manuscript introducing FC-ENZO. We address each of the major comments below. Where appropriate, we have revised the manuscript to improve clarity on methods and limitations.
read point-by-point responses
-
Referee: [Abstract] Abstract and methods: the quantitative contamination fractions rest on the unvalidated premise that the ELF OWL and BOBCAT libraries correctly reproduce the distribution of real UCD absorption features (especially near 1 μm) and that the chosen stellar number-density models give unbiased spatial counts; no comparison to spectroscopically confirmed UCD contaminants or to observed number counts is described, so the absolute fractions and the claim of similar contamination across HST/Roman/JWST cannot be assessed for systematic bias.
Authors: We acknowledge that our quantitative predictions depend on the accuracy of the adopted SED libraries and density models, which have not been directly validated against observed UCD contaminants in high-redshift galaxy samples. The manuscript presents FC-ENZO as a modeling tool to explore the impact of different libraries and models rather than providing empirically calibrated fractions. We have revised the discussion to explicitly state the potential for systematic biases in absolute numbers and to clarify that the reported similarity in contamination levels across surveys holds within the framework of the chosen models. We also highlight that the dominant spectral types and trends with metallicity are robust features across the libraries. revision: partial
-
Referee: [Abstract] Abstract: no description is given of the precise algorithm or selection-function implementation used to compute the fraction of synthesized dwarfs that pass the user-specified photometric criteria, nor are error bars or sensitivity ranges on those fractions reported despite the explicit dependence on metallicity and density-model choice.
Authors: We agree with this assessment. The original manuscript provided only a high-level overview of the code. In the revised version, we have added a detailed description of the algorithm in the Methods section, including how synthetic photometry is computed from the SEDs, how the selection criteria are applied, and the integration with stellar density models. Additionally, we now present sensitivity ranges in the results by varying metallicity and density models, shown as shaded regions or multiple curves in the figures, to quantify the dependence on these choices. revision: yes
- Providing direct comparisons to spectroscopically confirmed UCDs or observed number counts, as this would require access to or collection of specific observational datasets not available for this study.
Circularity Check
No circularity; FC-ENZO applies external SED libraries and density models without internal fitting or self-referential definitions
full rationale
The paper presents FC-ENZO as a forward-modeling code that ingests two external synthetic SED libraries (ELF OWL, BOBCAT) and adopted stellar number-density models, then computes the fraction of simulated UCDs that pass user-specified photometric selection criteria. No equations, parameters, or outputs are defined in terms of the predicted contamination fractions themselves, and no self-citations supply load-bearing uniqueness theorems or ansatzes. The reported differences between libraries and dependence on metallicity/density models are explicit acknowledgments that results are conditional on the chosen external inputs rather than tautological reductions. The derivation chain is therefore self-contained against external benchmarks.
Axiom & Free-Parameter Ledger
free parameters (2)
- stellar number-density model
- metallicity
axioms (1)
- domain assumption The ELF OWL and BOBCAT synthetic SED libraries span the relevant range of ultra-cool dwarf spectral properties.
Reference graph
Works this paper leans on
-
[1]
Aganze, C., Burgasser, A. J., Malkan, M., et al. 2022a, ApJ, 924, 114, doi: 10.3847/1538-4357/ac35ea
-
[2]
Aganze, C., Burgasser, A. J., Malkan, M., et al. 2022b, ApJ, 934, 73, doi: 10.3847/1538-4357/ac7053
-
[3]
Bagley, M. B., Finkelstein, S. L., Rhoads, J., et al. 2026, arXiv e-prints, arXiv:2603.09828, doi: 10.48550/arXiv.2603.09828
-
[4]
1996, A&AS, 117, 393, doi: 10.1051/aas:1996164
Bertin, E., & Arnouts, S. 1996, A&AS, 117, 393, doi: 10.1051/aas:1996164
-
[5]
2019, MNRAS, 486, 1167, doi: 10.1093/mnras/stz217
Bland-Hawthorn, J., Sharma, S., Tepper-Garcia, T., et al. 2019, MNRAS, 486, 1167, doi: 10.1093/mnras/stz217
-
[6]
Bouwens, R. J., Illingworth, G. D., Oesch, P. A., et al. 2011, ApJ, 737, 90, doi: 10.1088/0004-637X/737/2/90
-
[7]
Bouwens, R. J., Illingworth, G. D., Oesch, P. A., et al. 2015, ApJ, 803, 34, doi: 10.1088/0004-637X/803/1/34
-
[8]
Bowler, R. A. A., Dunlop, J. S., McLure, R. J., et al. 2012, MNRAS, 426, 2772, doi: 10.1111/j.1365-2966.2012.21904.x
-
[9]
Bowler, R. A. A., Dunlop, J. S., McLure, R. J., et al. 2015, MNRAS, 452, 1817, doi: 10.1093/mnras/stv1403
-
[10]
Brammer, G. B., van Dokkum, P. G., & Coppi, P. 2008, ApJ, 686, 1503, doi: 10.1086/591786 19
work page internal anchor Pith review doi:10.1086/591786 2008
-
[11]
Burgasser, A. J. 2014, in Astronomical Society of India Conference Series, Vol. 11, Astronomical Society of India Conference Series, 7–16, doi: 10.48550/arXiv.1406.4887
work page internal anchor Pith review Pith/arXiv arXiv doi:10.48550/arxiv.1406.4887 2014
-
[12]
Caballero, J. A., Burgasser, A. J., & Klement, R. 2008, A&A, 488, 181, doi: 10.1051/0004-6361:200809520 Carnero Rosell, A., Santiago, B., dal Ponte, M., et al. 2019, MNRAS, 489, 5301, doi: 10.1093/mnras/stz2398
-
[13]
Casey, C. M., Kartaltepe, J. S., Drakos, N. E., et al. 2023, ApJ, 954, 31, doi: 10.3847/1538-4357/acc2bc
-
[14]
Chen, B., Stoughton, C., Smith, J. A., et al. 2001, ApJ, 553, 184, doi: 10.1086/320647
-
[15]
1997, ApJ, 477, 765, doi: 10.1086/303726
Chiappini, C., Matteucci, F., & Gratton, R. 1997, ApJ, 477, 765, doi: 10.1086/303726
-
[16]
Conroy, C., Naidu, R. P., Zaritsky, D., et al. 2019, ApJ, 887, 237, doi: 10.3847/1538-4357/ab5710
-
[17]
2024a, MNRAS, 533, 2391, doi: 10.1093/mnras/stae2006
Dalmasso, N., Leethochawalit, N., Trenti, M., & Boyett, K. 2024a, MNRAS, 533, 2391, doi: 10.1093/mnras/stae2006
-
[18]
2024b, MNRAS, 528, 898, doi: 10.1093/mnras/stad3901
Dalmasso, N., Trenti, M., & Leethochawalit, N. 2024b, MNRAS, 528, 898, doi: 10.1093/mnras/stad3901
-
[19]
Dietz, S. E., Yoon, J., Beers, T. C., & Placco, V. M. 2020, ApJ, 894, 34, doi: 10.3847/1538-4357/ab7fa4
-
[20]
2013, NewAR, 57, 80, doi: 10.1016/j.newar.2013.06.001
Feltzing, S., & Chiba, M. 2013, NewAR, 57, 80, doi: 10.1016/j.newar.2013.06.001
-
[21]
Finkelstein, S. L., Ryan, Jr., R. E., Papovich, C., et al. 2015, ApJ, 810, 71, doi: 10.1088/0004-637X/810/1/71
-
[22]
L., Bagley, M., Song, M., et al
Finkelstein, S. L., Bagley, M., Song, M., et al. 2022, ApJ, 928, 52, doi: 10.3847/1538-4357/ac3aed
-
[23]
Finkelstein, S. L., Bagley, M. B., Ferguson, H. C., et al. 2023, ApJL, 946, L13, doi: 10.3847/2041-8213/acade4
-
[24]
Finkelstein, S. L., Leung, G. C. K., Bagley, M. B., et al. 2024, ApJL, 969, L2, doi: 10.3847/2041-8213/ad4495
-
[25]
Franco, M., Casey, C. M., Akins, H. B., et al. 2025, arXiv e-prints, arXiv:2508.04791, doi: 10.48550/arXiv.2508.04791
-
[26]
Geballe, T. R., Knapp, G. R., Leggett, S. K., et al. 2002, ApJ, 564, 466, doi: 10.1086/324078
-
[27]
2009, ApJ, 692, 1075, doi: 10.1088/0004-637X/692/2/1075
Gillessen, S., Eisenhauer, F., Trippe, S., et al. 2009, ApJ, 692, 1075, doi: 10.1088/0004-637X/692/2/1075
-
[28]
Grogin, N. A., Kocevski, D. D., Faber, S. M., et al. 2011, ApJS, 197, 35, doi: 10.1088/0067-0049/197/2/35
-
[30]
Hainline, K. N., Johnson, B. D., Robertson, B., et al. 2024b, ApJ, 964, 71, doi: 10.3847/1538-4357/ad1ee4
-
[31]
Hainline, K. N., Helton, J. M., Johnson, B. D., et al. 2024c, ApJ, 964, 66, doi: 10.3847/1538-4357/ad20d1
-
[32]
2024, ApJ, 960, 56, doi: 10.3847/1538-4357/ad0b7e
Harikane, Y., Nakajima, K., Ouchi, M., et al. 2024, ApJ, 960, 56, doi: 10.3847/1538-4357/ad0b7e
-
[33]
2016, ApJ, 821, 123, doi: 10.3847/0004-637X/821/2/123
Harikane, Y., Ouchi, M., Ono, Y., et al. 2016, ApJ, 821, 123, doi: 10.3847/0004-637X/821/2/123
-
[34]
2001, MNRAS, 325, 1365, doi: 10.1046/j.1365-8711.2001.04510.x
Haywood, M. 2001, MNRAS, 325, 1365, doi: 10.1046/j.1365-8711.2001.04510.x
-
[35]
Heintz, K. E., Brammer, G. B., Watson, D., et al. 2025, A&A, 693, A60, doi: 10.1051/0004-6361/202450243
-
[36]
Honaker, E. J., & Gizis, J. E. 2025, ApJ, 985, 48, doi: 10.3847/1538-4357/adc689 Juri´ c, M., Ivezi´ c,ˇZ., Brooks, A., et al. 2008, ApJ, 673, 864, doi: 10.1086/523619
-
[37]
Kakazu, Y., Hu, E. M., Liu, M. C., et al. 2010, ApJ, 723, 184, doi: 10.1088/0004-637X/723/1/184
-
[38]
Kirkpatrick, J. D. 2005, ARA&A, 43, 195, doi: 10.1146/annurev.astro.42.053102.134017
-
[39]
Kirkpatrick, J. D., Gelino, C. R., Faherty, J. K., et al. 2021, ApJS, 253, 7, doi: 10.3847/1538-4365/abd107
-
[40]
Koekemoer, A. M., Faber, S. M., Ferguson, H. C., et al. 2011, ApJS, 197, 36, doi: 10.1088/0067-0049/197/2/36
-
[41]
Kordopatis, G., Gilmore, G., Wyse, R. F. G., et al. 2013, MNRAS, 436, 3231, doi: 10.1093/mnras/stt1804
-
[42]
Kreilgaard, K. C., Mason, C. A., Morishita, T., et al. 2026, arXiv e-prints, arXiv:2604.17963, doi: 10.48550/arXiv.2604.17963
work page internal anchor Pith review Pith/arXiv arXiv doi:10.48550/arxiv.2604.17963 2026
-
[43]
2023, ApJ, 950, 8, doi: 10.3847/1538-4357/acc8cb
Lacy, B., & Burrows, A. 2023, ApJ, 950, 8, doi: 10.3847/1538-4357/acc8cb
-
[44]
Lee, Y. S., Beers, T. C., Kim, Y. K., et al. 2017, ApJ, 836, 91, doi: 10.3847/1538-4357/836/1/91
-
[45]
2026, ApJ, 998, 217, doi: 10.3847/1538-4357/ae374b
Trenti, M. 2026, ApJ, 998, 217, doi: 10.3847/1538-4357/ae374b
-
[46]
2023, MNRAS, 524, 5454, doi: 10.1093/mnras/stad2202
Trenti, M., & Treu, T. 2023, MNRAS, 524, 5454, doi: 10.1093/mnras/stad2202
-
[47]
2022, MNRAS, 509, 5836, doi: 10.1093/mnras/stab3265
Roberts-Borsani, G., & Treu, T. 2022, MNRAS, 509, 5836, doi: 10.1093/mnras/stab3265
-
[48]
Marley, M., Saumon, D., Morley, C., et al. 2021, Sonora Bobcat: cloud-free, substellar atmosphere models, spectra, photometry, evolution, and chemistry, Sonora Bobcat Zenodo, doi: 10.5281/zenodo.5063476
-
[49]
S., Saumon, D., Visscher, C., et al
Marley, M. S., Saumon, D., Visscher, C., et al. 2021, ApJ, 920, 85, doi: 10.3847/1538-4357/ac141d
-
[50]
Masters, D., McCarthy, P., Burgasser, A. J., et al. 2012, ApJL, 752, L14, doi: 10.1088/2041-8205/752/1/L14
-
[51]
2024, MNRAS, 527, 583, doi: 10.1093/mnras/stad2952
Mazzi, A., Girardi, L., Trabucchi, M., et al. 2024, MNRAS, 527, 583, doi: 10.1093/mnras/stad2952
-
[52]
McLure, R. J., Dunlop, J. S., Bowler, R. A. A., et al. 2013, MNRAS, 432, 2696, doi: 10.1093/mnras/stt627
-
[53]
2021, ApJS, 253, 4, doi: 10.3847/1538-4365/abce67
Morishita, T. 2021, ApJS, 253, 4, doi: 10.3847/1538-4365/abce67
-
[54]
2018, ApJ, 867, 150, doi: 10.3847/1538-4357/aae68c 20
Morishita, T., Trenti, M., Stiavelli, M., et al. 2018, ApJ, 867, 150, doi: 10.3847/1538-4357/aae68c 20
-
[55]
2020, ApJ, 904, 50, doi: 10.3847/1538-4357/abba83
Morishita, T., Stiavelli, M., Trenti, M., et al. 2020, ApJ, 904, 50, doi: 10.3847/1538-4357/abba83
-
[56]
2024, ApJ, 963, 9, doi: 10.3847/1538-4357/ad1404
Morishita, T., Stiavelli, M., Chary, R.-R., et al. 2024, ApJ, 963, 9, doi: 10.3847/1538-4357/ad1404
-
[57]
Morishita, T., Mason, C. A., Kreilgaard, K. C., et al. 2025, ApJ, 983, 152, doi: 10.3847/1538-4357/adbbdc
-
[58]
2026, AJ, 171, 191, doi: 10.3847/1538-3881/ae40f1
McConachie, I., & Brammer, G. 2026, AJ, 171, 191, doi: 10.3847/1538-3881/ae40f1
-
[59]
Mukherjee, S., Batalha, N. E., Fortney, J. J., & Marley, M. S. 2023, ApJ, 942, 71, doi: 10.3847/1538-4357/ac9f48
-
[60]
2016, ApJ, 830, 159, doi: 10.3847/0004-637X/830/2/159
Nakajima, T., & Sorahana, S. 2016, ApJ, 830, 159, doi: 10.3847/0004-637X/830/2/159
-
[61]
Oesch, P. A., Bouwens, R. J., Illingworth, G. D., Labb´ e, I., & Stefanon, M. 2018, ApJ, 855, 105, doi: 10.3847/1538-4357/aab03f
-
[62]
Oesch, P. A., Bouwens, R. J., Illingworth, G. D., et al. 2013, ApJ, 773, 75, doi: 10.1088/0004-637X/773/1/75
-
[63]
2009, ApJ, 706, 1136, doi: 10.1088/0004-637X/706/2/1136
Ouchi, M., Mobasher, B., Shimasaku, K., et al. 2009, ApJ, 706, 1136, doi: 10.1088/0004-637X/706/2/1136
-
[64]
Pirzkal, N., Sahu, K. C., Burgasser, A., et al. 2005, ApJ, 622, 319, doi: 10.1086/427896
-
[65]
Pirzkal, N., Burgasser, A. J., Malhotra, S., et al. 2009, ApJ, 695, 1591, doi: 10.1088/0004-637X/695/2/1591
-
[66]
Pontoppidan, K. M., Pickering, T. E., Laidler, V. G., et al. 2016, in Society of Photo-Optical Instrumentation Engineers (SPIE) Conference Series, Vol. 9910, Observatory Operations: Strategies, Processes, and Systems VI, ed. A. B. Peck, R. L. Seaman, & C. R. Benn, 991016, doi: 10.1117/12.2231768
-
[67]
2022, ApJ, 927, 236, doi: 10.3847/1538-4357/ac4803
Leethochawalit, N., & Trenti, M. 2022, ApJ, 927, 236, doi: 10.3847/1538-4357/ac4803
-
[68]
2025, ApJ, 983, 18, doi: 10.3847/1538-4357/adba60
Roberts-Borsani, G., Bagley, M., Rojas-Ruiz, S., et al. 2025, ApJ, 983, 18, doi: 10.3847/1538-4357/adba60
-
[69]
Robertson, B., Johnson, B. D., Tacchella, S., et al. 2024, ApJ, 970, 31, doi: 10.3847/1538-4357/ad463d
-
[70]
Robertson, B. E., Ellis, R. S., Furlanetto, S. R., & Dunlop, J. S. 2015, ApJ, 802, L19, doi: 10.1088/2041-8205/802/2/l19
-
[71]
Ryan, Jr., R. E., Hathi, N. P., Cohen, S. H., & Windhorst, R. A. 2005, ApJL, 631, L159, doi: 10.1086/497368
-
[72]
Ryan, Jr., R. E., & Reid, I. N. 2016, AJ, 151, 92, doi: 10.3847/0004-6256/151/4/92
-
[73]
Skelton, R. E., Whitaker, K. E., Momcheva, I. G., et al. 2014, The Astrophysical Journal Supplement Series, 214, 24, doi: 10.1088/0067-0049/214/2/24
-
[74]
2019, ApJ, 870, 118, doi: 10.3847/1538-4357/aaf1a7
Sorahana, S., Nakajima, T., & Matsuoka, Y. 2019, ApJ, 870, 118, doi: 10.3847/1538-4357/aaf1a7
-
[75]
, archivePrefix = "arXiv", eprint =
Stanway, E. R., Bremer, M. N., & Lehnert, M. D. 2008, MNRAS, 385, 493–510, doi: 10.1111/j.1365-2966.2008.12853.x
-
[76]
Stanway, E. R., Bunker, A. J., McMahon, R. G., et al. 2004, ApJ, 607, 704, doi: 10.1086/383531
-
[77]
Steidel, C. C., Adelberger, K. L., Giavalisco, M., Dickinson, M., & Pettini, M. 1999, The Astrophysical Journal, 519, 1, doi: 10.1086/307363
-
[78]
Adelberger, K. L. 1996, ApJL, 462, L17, doi: 10.1086/310029
-
[79]
Sutanto, R. A., Morishita, T., Kodama, T., et al. 2026, arXiv e-prints, arXiv:2602.04333, doi: 10.48550/arXiv.2602.04333
work page internal anchor Pith review Pith/arXiv arXiv doi:10.48550/arxiv.2602.04333 2026
-
[80]
J., Ahmed, S., & Laithwaite, R
Warren, S. J., Ahmed, S., & Laithwaite, R. C. 2021, The Open Journal of Astrophysics, 4, 4, doi: 10.21105/astro.2010.11093
-
[81]
Weibel, A., Oesch, P. A., Williams, C. C., et al. 2026, ApJ, 1002, 136, doi: 10.3847/1538-4357/ae5a9c
discussion (0)
Sign in with ORCID, Apple, or X to comment. Anyone can read and Pith papers without signing in.