REVIEW 4 major objections 8 minor 18 references
Reviewed by Pith at T0; open to challenge.
T0 means a machine referee read the full paper against a public rubric. The mark states how deep the mechanical check went, never who wrote it. the ladder, T0–T4 →
T0 review · glm-5.2
GPU workloads weaponized to destabilize renewable-powered grids
2026-07-08 19:17 UTC pith:QKLXN54A
load-bearing objection Novel cross-domain vulnerability with real hardware validation, but headline severity numbers rest on an unrealistic synchronization assumption the 4 major comments →
Bit2Watt: A Cyber-Physical Vulnerability Exploiting GPU Workloads Across Power and Computing Infrastructures
The pith
A machine-rendered reading of the paper's core claim, the machinery that carries it, and where it could break.
Core claim
The central discovery is that legitimate, user-level GPU workload manipulation can serve as a high-frequency actuator capable of destabilizing inverter-dominated power grids. The mechanism rests on two interacting properties: the negative incremental resistance of GPU clusters as constant-power loads, and the frequency-shaped output impedance of inverter-based DERs, which exhibits resonant peaks at high frequencies that conventional stability analysis does not typically consider. When GPU-induced power modulations align with these resonant frequencies, they can amplify harmonic distortion, degrade system damping past the stability boundary (Hopf bifurcation), and in simulated extreme cases,
What carries the argument
Impedance-based model linking GPU constant-power-load negative incremental resistance with DER inverter frequency-shaped output impedance, validated through Simulink simulations and hardware experiments on GPU clusters and PV inverters
Load-bearing premise
The synchronized worst-case aggregation model assumes all victim GPUs switch between high- and low-power states with identical modulation frequency and phase, without modeling device-level heterogeneity, phase dispersion, or communication delays. The paper acknowledges this is a conservative bound, and its own analysis shows that at 100 microseconds of timing jitter, attack amplitude drops by roughly 20%. Real cloud environments exhibit millisecond-scale scheduling non-determ
What would settle it
If realistic cloud scheduling jitter (millisecond-scale) and device heterogeneity reduce the aggregated modulation amplitude below the threshold needed to excite DER resonant modes or push damping negative, the attack would not achieve grid destabilization with practically obtainable numbers of GPUs.
If this is right
- Cloud providers and grid operators may need to jointly monitor workload-level power signatures and grid-side power quality, as isolated monitoring at either layer fails to detect this attack class.
- Data center power architecture standards may need revision to account for high-frequency load modulation capabilities of GPU clusters, particularly as DER penetration increases and grid stiffness decreases.
- The Watt2Bit feedback loop suggests that power-quality degradation from workload manipulation could cascade into computing service disruptions, creating a self-reinforcing cyber-physical failure cycle.
- The demonstrated EMI exfiltration channel (99%+ accuracy) suggests that workload-induced power modulation could serve as a covert communication path across air-gapped or isolated computing environments.
- Grid stability analysis for regions with high data-center concentration and high DER penetration may need to incorporate workload-induced high-frequency excitation as a threat scenario.
Editorial analysis
A structured set of objections, weighed in public.
Referee Report
Summary. This paper introduces Bit2Watt, a cyber-physical vulnerability in which a legitimate but malicious cloud tenant manipulates GPU workloads to induce high-frequency power modulations (up to 6 kHz) that can destabilize local power infrastructure in high-DER-penetration scenarios. The paper proposes two attack methods (SWMA and LTMA), validates GPU power modulation on 6 GPU models, and validates the CPL/NIR behavior of GPU clusters and the frequency response of DER output impedance through hardware experiments. The grid impact is assessed via Simulink simulations, showing that 1,000 synchronized GPUs in a 1-MW system with 90% DERs can raise current THD to 46.8% and produce a negative damping ratio of -0.27. The paper also analyzes a Watt2Bit feedback path including DoS and EMI-based exfiltration.
Significance. The paper identifies a genuinely novel and timely attack surface at the intersection of GPU-accelerated computing and renewable-integrated power systems. The cross-domain threat model—operating entirely within legitimate tenant privileges—is well-motivated. Strengths include real-world GPU power modulation measurements across 6 architectures (Table 1), hardware testbed experiments validating CPL/NIR behavior with 10 trials (Figure 6), impedance-based stability analysis using the standard Middlebrook criterion (Eq. 1), a hardware power delivery chain testbed (Figure 10), and a detectability analysis against realistic monitoring tools (Table 4, Figure 14). The falsifiable predictions regarding THD and damping ratio under specific GPU counts and DER penetration levels are commendable.
major comments (4)
- §5.1: The synchronized worst-case aggregation model is the load-bearing assumption for all headline grid-impact results (46.8% THD, -0.27 damping ratio, 81% cascading load loss). The paper models 1,000 GPUs as a single ideal current source with perfect phase alignment. The paper's own jitter analysis (§5.3.2) reports ~20% amplitude reduction at σ_τ = 100 μs for 2 kHz modulation. However, realistic cloud scheduling jitter—including OS scheduling non-determinism, CUDA kernel launch latency, VRM response variability, and network latency—plausibly falls in the 0.5–5 ms range, which would largely randomize phases at the claimed 2–6 kHz modulation frequencies. With randomized phases, aggregate amplitude scales as √N rather than N, reducing the effective modulation from 1,000 GPUs to approximately 3% of the synchronized value. The paper does not adequately characterize realistic jitter magnitud
- §5.3.2: The claim that asynchronization 'can be compensated by increasing the number of victim devices, owing to the scaling effect of large populations' is misleading. If phase randomization reduces aggregate amplitude by a factor of k, compensating requires k² more devices (since √N scaling), not k more. This statement should be corrected, as it materially affects the feasibility assessment of the attack under realistic conditions.
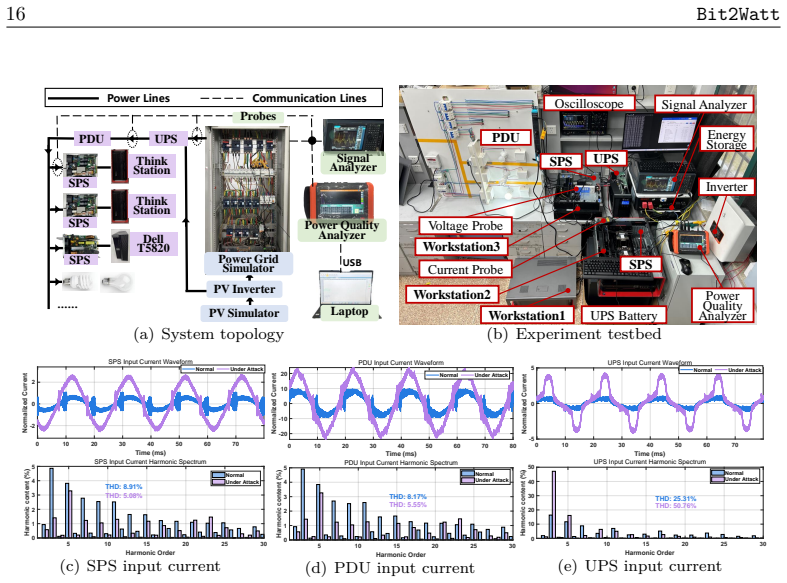
- §5.1 and §5.2.1: The simulation models 1,000 GPUs as a single current source, bypassing per-GPU SPS dynamics. However, the paper's own hardware experiments (§5.2.1, Figure 11a) show that 'the SPS stage introduces the strongest high-frequency attenuation,' absorbing high-frequency modulation locally. The simulation thus omits a filtering stage that the paper's own empirical evidence identifies as the primary attenuator of the attack signal. The paper should either (a) incorporate per-GPU SPS filtering into the simulation model and re-evaluate the headline results, or (b) provide a quantitative bound on how much the SPS attenuation would reduce the effective aggregated modulation reaching the PCC, and discuss the implications for the reported THD and damping ratio values.
- §5.3.2: The jitter analysis is limited to σ_τ ≤ 100 μs at a single frequency (2 kHz). Given that the paper claims modulation frequencies up to 6 kHz (period ≈ 167 μs), and that the robustness 'decreases as the frequency increases' (acknowledged in the text), the absence of jitter analysis at higher frequencies leaves the feasibility of the most novel aspect of the attack (high-frequency modulation) unexamined. A sensitivity analysis at 5–6 kHz with realistic jitter values would substantially strengthen or constrain the claims.
minor comments (8)
- Table 1: The LTMA frequency for RTX 2080 is listed as 1,200 Hz, but the text in §4.2.3 references '1.23 kHz' for LTMA. Please reconcile.
- §4.2.3: The sentence 'This limitation is attributed to the finite dynamic response of GPU power management and voltage regulation, which cannot fully track rapid workload transitions' could benefit from a quantitative characterization of the VRM bandwidth to support the 6 kHz ceiling claim.
- Figure 4: The x-axis labels are somewhat unclear regarding which segments correspond to which attack. Consider adding vertical separators or annotations.
- §5.1: The load composition (1/4 GPU, 3/4 background) is motivated by Virginia electricity consumption patterns, but no specific citation or data is provided for this ratio. Please add a reference.
- Table 3: The SPS rectifier inner loop lists i*_q = 0, but the SPS is a DC-DC converter. Please clarify whether this refers to a front-end AC-DC stage or correct if it is a typo.
- Figure 19 (Appendix C): The legend text appears garbled ('<<== = 10.0 77s'). Please fix the rendering of σ_τ values.
- §5.3.5: The exfiltration experiment uses a 50-bit test sequence. A BER analysis over a longer sequence with varying SNR conditions would strengthen the covert channel claim.
- The paper would benefit from a clearer statement, early in §5.1, that all simulation results represent a synchronized worst-case bound, so that readers do not interpret the headline numbers as expected realistic outcomes.
Simulated Author's Rebuttal
We thank the referee for a careful and substantive review. The referee's comments on synchronization realism, the SPS filtering gap between simulation and hardware, and the limited jitter analysis are well-taken. We address each below.
read point-by-point responses
-
Referee: §5.1: The synchronized worst-case aggregation model is the load-bearing assumption for all headline grid-impact results. Realistic cloud scheduling jitter (0.5–5 ms) would largely randomize phases at 2–6 kHz, reducing aggregate amplitude from N to √N scaling. The paper does not adequately characterize realistic jitter magnitudes.
Authors: The referee raises a valid and important concern. We acknowledge that the synchronized worst-case aggregation model represents an idealized upper bound, and that realistic cloud scheduling jitter—arising from OS scheduling non-determinism, CUDA kernel launch latency, VRM response variability, and network latency—would substantially reduce the aggregate modulation amplitude. The referee's estimate of 0.5–5 ms jitter is plausible for general cloud environments, and at 2–6 kHz modulation frequencies (periods of 500 μs to 167 μs), such jitter would indeed drive the system toward √N scaling rather than N scaling, reducing the effective aggregate modulation by roughly an order of magnitude or more. Our current jitter analysis (σ_τ ≤ 100 μs at 2 kHz) does not cover this realistic regime. We will revise the manuscript to: (1) explicitly acknowledge that the headline results (46.8% THD, -0.27 damping ratio, 81% cascading loss) represent a synchronized worst-case upper bound; (2) add a quantitative discussion of the √N scaling regime under realistic jitter, including the implied increase in required GPU counts; and (3) reframe the contribution as characterizing the vulnerability's maximum potential impact rather than its expected impact under typical conditions. We believe the vulnerability remains relevant even under √N scaling—large-scale GPU deployments of 10⁴–10⁵ units are increasingly common—but the required scale and the framing of results must be revised to reflect this honestly. revision: yes
-
Referee: §5.3.2: The claim that asynchronization 'can be compensated by increasing the number of victim devices, owing to the scaling effect of large populations' is misleading. If phase randomization reduces aggregate amplitude by a factor of k, compensating requires k² more devices (since √N scaling), not k more.
Authors: The referee is mathematically correct. Under √N scaling, if the aggregate amplitude is reduced by a factor of k relative to the synchronized case, compensating for this reduction requires k² additional devices, not k. Our statement as written is misleading and will be corrected. We will revise §5.3.2 to state the correct scaling relationship and discuss its implications for attack feasibility. Specifically, we will note that under realistic jitter conditions, the number of GPUs required to achieve the same impact as the synchronized case grows quadratically with the amplitude reduction factor, which materially affects the feasibility assessment. revision: yes
-
Referee: §5.1 and §5.2.1: The simulation models 1,000 GPUs as a single current source, bypassing per-GPU SPS dynamics. The paper's own hardware experiments show SPS introduces the strongest high-frequency attenuation. The simulation omits a filtering stage that the paper's own empirical evidence identifies as the primary attenuator.
Authors: This is a fair and significant observation. There is an internal inconsistency in the paper: our hardware experiments (Figure 11a) demonstrate that the SPS stage introduces the strongest high-frequency attenuation, yet the Simulink model in §5.1 aggregates all GPUs into a single current source at the PCC without explicitly modeling per-GPU SPS filtering. We will address this in two ways. First, we will add a quantitative bound on the SPS attenuation effect. Based on the spectral measurements in Figure 11a, the SPS stage attenuates high-frequency components (above ~1 kHz) by approximately 15–25 dB relative to the GPU-side signal. We will incorporate this as a frequency-dependent attenuation factor applied to the aggregated current source in the simulation, and re-evaluate the headline THD and damping ratio results. We expect the THD and damping degradation to be reduced but not eliminated, since (a) the SPS attenuation is frequency-dependent and less severe below ~300 Hz, and (b) the UPS stage reshapes rather than purely attenuates the disturbance, projecting energy into lower-frequency bands that still interact with DER control loops. Second, we will explicitly discuss the gap between the simulation model and the hardware measurements as a limitation, and clarify that the revised results represent a more realistic—though still conservative—estimate. We note that fully incorporating per-GPU SPS dynamics with individual VRM models for 1,000 GPUs is computationally prohibitive in Simulink, so the attenuation-factor approach is a practical middle ground. revision: partial
-
Referee: §5.3.2: The jitter analysis is limited to σ_τ ≤ 100 μs at a single frequency (2 kHz). Given claims up to 6 kHz (period ≈ 167 μs), the absence of jitter analysis at higher frequencies leaves the feasibility of the most novel aspect unexamined.
Authors: The referee is correct that the jitter analysis should be extended to higher frequencies. At 5–6 kHz, the modulation period is 167–200 μs, meaning that even σ_τ = 50 μs represents a quarter-period of jitter, which would significantly degrade phase coherence. We will add a sensitivity analysis at 5 kHz and 6 kHz with σ_τ values of 10, 50, 100, 500, and 1000 μs. Based on preliminary reasoning, we expect that at 6 kHz, even σ_τ = 50 μs will reduce aggregate amplitude by more than 50%, and σ_τ ≥ 500 μs will effectively randomize phases entirely. This analysis will likely constrain the feasibility of high-frequency modulation under realistic conditions and will be reported honestly. We anticipate that the results will show a clear frequency-dependent feasibility boundary: lower modulation frequencies (e.g., 500 Hz–1 kHz) remain robust under realistic jitter, while the highest frequencies (5–6 kHz) require either very tight synchronization (as in dedicated HPC clusters with PTP) or very large GPU populations to compensate for √N scaling. This will strengthen the paper by providing a more nuanced and realistic feasibility assessment rather than presenting the maximum frequency as practically achievable under all conditions. revision: yes
Circularity Check
No circularity found: GPU modulation data is hardware-measured, stability analysis uses standard Middlebrook criterion, and simulation parameters are independently specified.
full rationale
The paper's derivation chain is self-contained and does not reduce to its own inputs by construction. (1) GPU power modulation frequencies and amplitudes (Table 1) are independently measured from real hardware experiments using a DAQ on GPU power supply lines (Section 4.2.3). (2) The impedance-based stability analysis (Section 4.3) uses the standard Middlebrook criterion (Eq. 1) from Sun11, an external reference, not a self-authored definition. (3) The simulation parameters (Tables 2-3) are independently specified physical values (PV array specs, PI controller gains, line parameters). (4) The headline grid-impact results (46.8% THD, -0.27 damping ratio) are outputs of Simulink simulations fed by these independently measured and specified inputs, not fitted parameters renamed as predictions. (5) The synchronized aggregation model (Section 5.1) is an explicit modeling assumption stated as a 'conservative bound,' not a result derived from a self-citation chain. While the worst-case synchronization assumption is a strong modeling choice that affects the magnitude of downstream results, it is a stated assumption, not a circular derivation. The paper's own jitter analysis (Section 5.3.2) independently quantifies sensitivity to this assumption. No step in the derivation chain reduces to its inputs by definition or through a self-citation that is itself unverified. The concerns about synchronization realism are correctness/assessment risks, not circularity. The derivation is self-contained against external benchmarks (real hardware measurements, standard stability criteria, IEEE standard bus systems).
Axiom & Free-Parameter Ledger
free parameters (5)
- Simulink PV array configuration =
Nseries=100, Nparallel=47, Pm=214.97W
- DER penetration levels =
10%, 50%, 80%, 90%
- Number of manipulated GPUs =
200-1000
- PI controller gains (all loops) =
Various, e.g., Kp=0.001/Ki=0.01 for PV DC/DC, Kp=30/Ki=200 for inverter current loop
- Attack modulation frequency =
Up to 6000 Hz (SWMA), up to 3000 Hz (LTMA)
axioms (4)
- domain assumption GPU clusters behave as constant-power loads (CPL) with negative incremental resistance in the short-term electrical regime.
- standard math The Middlebrook stability criterion (|Zg/Zdl| < 1) is applicable to the grid-DER-GPU system.
- ad hoc to paper All victim GPUs can be synchronized to switch between high- and low-power states with identical frequency and phase.
- domain assumption Cloud monitoring tools (NVML, RAPL, BMC, PDU) do not capture high-frequency power signatures relevant to this attack.
read the original abstract
Modern data centers increasingly rely on large-scale GPU clusters and on-site renewable energy resources, resulting in a tightly coupled cyber-physical system between computing workloads and power-electronic-dominated grids. In this paper, we reveal Bit2Watt, a previously unexplored vulnerability in which an adversary manipulates GPU workloads to induce controlled, high-frequency power modulations that destabilize local power infrastructure and propagate back to disrupt computing services. Unlike traditional attacks that compromise grid-side devices or communication channels, Bit2Watt operates entirely within the cyber layer as a legal tenant, which could amplify fluctuations, harmonic distortion, and damping degradation, particularly in high-DER-penetration scenarios. This risk is difficult to detect under routine cloud- and facility-side monitoring because it exploits legitimate workload execution paths and concentrates much of its distinctive behavior in high-frequency components that are weakly captured by common telemetry. We validate Bit2Watt through impedance-based analysis, power system simulations, and real-world experiments on GPUs and grid-connected PV inverters. Under the synchronized worst-case aggregation model studied in the paper, manipulating 1,000 GPUs in a 1-MW local power system with 90% DERs raises current THD to 46.8% and results in a damping ratio of -0.27. We further show that the resulting power-quality degradation can stress data-center power-delivery equipment, trigger protection mechanisms, and, in extreme simulated cases, induce cascading failures in transmission-scale systems. In addition, we analyze a plausible Watt2Bit feedback path, including denial-of-service risks and covert information exfiltration via EMI side channels. This work highlights the urgent need for cross-layer defenses that jointly consider workload scheduling and power electronics.
Figures






Reference graph
Works this paper leans on
-
[1]
[Ass18] IEEE Standards Association. IEEE Standard for Interconnection and Inter- operability of Distributed Energy Resources with Associated Electric Power Systems. IEEE Std 1547-2018 (Revision of IEEE Std 1547-2003) ,
work page 2018
-
[2]
Power Stabilization for AI Training Datacenters
[CWH+25] Esha Choukse, Brijesh Warrier, Scot Heath, Luz Belmont, April Zhao, Has- san Ali Khan, Brian Harry, Matthew Kappel, Russell J Hewett, Kushal Datta, et al. Power stabilization for AI training datacenters. arXiv preprint arXiv:2508.14318,
work page internal anchor Pith review Pith/arXiv arXiv
-
[3]
See where data centers are across the US on our interactive map
[DC25] Hannah Beckler Dakin Campbell. See where data centers are across the US on our interactive map. https://www.businessinsider.com/data-center-loc ations-us-map-ai-boom-2025-9 ,
work page 2025
-
[4]
[DPO25] Daniel Nishball Dylan Patel and Jeremie Eliahou Ontiveros. Gigawatt Clus- ters, Telecom Networking, Long Haul Fiber, Hierarchical & Asynchronous SGD, Distributed Infrastructure Winners. https://semianalysis.com/2024/ 09/04/multi-datacenter-training-openais/ ,
work page 2024
-
[5]
https://docs.jarvislabs.ai/blog/h100-price#2-cloud-gpu-pricing-p er-hour,
[GPU25b] NVIDIA H100 Price Guide 2025: Detailed Costs, Comparisons & Expert Insights. https://docs.jarvislabs.ai/blog/h100-price#2-cloud-gpu-pricing-p er-hour,
work page 2025
-
[6]
[Int11] International Electrotechnical Commission. Electromagnetic compatibility (EMC) - Part 3-12: Limits - Limits for harmonic currents produced by equipment connected to public low-voltage systems with input current > 16 A and <= 75 A per phase. Standard IEC 61000-3-12:2011, IEC, Geneva, Switzerland,
work page 2011
-
[7]
A novel side-channel timing attack on GPUs
[JFK17] Zhen Hang Jiang, Yunsi Fei, and David Kaeli. A novel side-channel timing attack on GPUs. In Proceedings of the Great Lakes Symposium on VLSI 2017, pages 167–172,
work page 2017
-
[8]
AI Load Dynamics--A Power Electronics Perspective
[LL25] Yuzhuo Li and Yunwei Li. AI Load Dynamics–A Power Electronics Perspec- tive. arXiv preprint arXiv:2502.01647 ,
work page internal anchor Pith review Pith/arXiv arXiv
-
[9]
Empirical Measurements of AI Training Power Demand on a GPU-Accelerated Node
[LNC+24] Imran Latif, Alex C Newkirk, Matthew R Carbone, Arslan Munir, Yuewei Lin, Jonathan Koomey, Xi Yu, and Zhiuha Dong. Empirical Measurements of AI Training Power Demand on a GPU-Accelerated Node. arXiv preprint arXiv:2412.08602,
work page internal anchor Pith review Pith/arXiv arXiv
-
[10]
Targeted attack synthesis for smart grid vulnerability analy- sis
[MBA+23] Suman Maiti, Anjana Balabhaskara, Sunandan Adhikary, Ipsita Koley, and Soumyajit Dey. Targeted attack synthesis for smart grid vulnerability analy- sis. In Proceedings of the 2023 ACM SIGSAC Conference on Computer and Communications Security, pages 2576–2590,
work page 2023
-
[11]
Opportunities of Renewable Energy Powered DNN Inference
[NG23] Seyed Morteza Nabavinejad and Tian Guo. Opportunities of renewable en- ergy powered DNN inference. arXiv preprint arXiv:2306.12247 ,
work page internal anchor Pith review Pith/arXiv arXiv
-
[12]
Rendered insecure: GPU side channel attacks are practical
[NNQAG18] Hoda Naghibijouybari, Ajaya Neupane, Zhiyun Qian, and Nael Abu- Ghazaleh. Rendered insecure: GPU side channel attacks are practical. In Proceedings of the 2018 ACM SIGSAC conference on computer and commu- nications security, pages 2139–2153,
work page 2018
-
[13]
Meta signs deals to source more solar, wind power for data centers
[Reu25] Reuters. Meta signs deals to source more solar, wind power for data centers. https://www.reuters.com/sustainability/invenergy-supply-meta-with-addit ional-791-mw-data-center-operations-2025-06-26/ ,
work page 2025
-
[14]
[SWB+21] Siddharth Samsi, Matthew L Weiss, David Bestor, Baolin Li, Michael Jones, Albert Reuther, Daniel Edelman, William Arcand, Chansup Byun, John Holodnack, et al. The MIT Supercloud Dataset. In 2021 IEEE High Per- formance Extreme Computing Conference (HPEC) , pages 1–8. IEEE,
work page 2021
-
[15]
[SZ21] Chao Su and Qingkai Zeng. Survey of CPU Cache-Based Side-Channel At- tacks: Systematic Analysis, Security Models, and Countermeasures. Security and Communication Networks , 2021(1):5559552,
work page 2021
-
[16]
[WL23] Fanrong Wei and Xiangning Lin
Accessed: 2026-07-04. [WL23] Fanrong Wei and Xiangning Lin. Cyber-physical attack launched from EVSE botnet. IEEE Transactions on Power Systems , 39(2):3603–3614,
work page 2026
-
[17]
[ZL25] Junfan Zhu and Jiqiang Lu. Leading degree: A metric for model performance evaluation and hyperparameter tuning in deep learning-based side-channel analysis. IACR Transactions on Cryptographic Hardware and Embedded Sys- tems, 2025(2):333–361,
work page 2025
-
[18]
A Landscape of U.S. Data Centers and Power Grid Stress This appendix provides supplementary evidence for the scale and distribution of data- center loads discussed in Section 2.1. As shown in Figure 16, data centers in the U.S. are widely deployed and form dense clusters in several major computing hubs. Table 5 further shows that data centers already cons...
work page 2024
discussion (0)
Sign in with ORCID, Apple, or X to comment. Anyone can read and Pith papers without signing in.