REVIEW 2 major objections 5 minor 39 references
CGS: Configurable Graph Summarization with Bounded Neighborhood Loss and Query Support
T0 review · 2 major / 5 minor · reviewed 2026-07-14 · grok-4.5
Pith's one-line read A graph summary can be made lossless or one-sided-lossy with a per-node neighborhood-loss bound, while still answering neighborhood, reachability and shortest-path queries accurately.
desk verdict Solid, configurable one-sided-error graph summarizer with real proofs, open code, and competitive compression; runtime and baseline gaps are real but secondary. read the letter →
The pith
A machine-rendered reading of the paper's core claim, the machinery that carries it, and where it could break.
The reading
What carries the argument
Safe greedy merge of 2-hop neighbors: at every step the pair with highest compression gain is tested against the ancestor-degree update rules; if the projected neighborhood loss stays ≤ δ_u the merge is performed and the heap is updated, otherwise it is discarded.
What would settle it
On a graph known to contain many overlapping neighborhoods, run the algorithm with a moderate δ and measure the final neighborhood losses; if any node exceeds its prescribed δ_u, or if a different merge order yields a strictly smaller summary that still respects the same δ, the safety claim fails.
Extended reading notes
Core claim
Three merge rules—exact common-neighborhood (CGS-E), intersection (CGS-I) and union (CGS-U)—together with a safety check that never lets any node’s neighborhood deviate by more than a prescribed fraction δ_u, produce a summary whose reconstruction and query answers obey exact equality or one-sided inclusion with a hard per-node loss bound.
Load-bearing premise
That repeatedly accepting the single currently safest highest-gain merge never later forces a configuration that violates the global loss bound or leaves better merges unexplored.
Signed reviews
Editorial analysis
A structured set of objections, weighed in public.
Referee Report
Summary. The paper introduces ConfiGS and the CGS framework for configurable summarization of undirected unweighted graphs. Nodes (or supernodes) that share common neighborhoods are greedily merged into supernodes under three variants: lossless CGS-E (exact neighborhoods), CGS-I (intersection; only false-negative edges, no false positives), and CGS-U (union; only false-positive edges, no false negatives). A per-node neighborhood-loss tolerance threshold δ_u (or uniform δ) bounds the fractional neighborhood discrepancy after reconstruction. Correctness of the one-sided inclusions, exact reconstruction for CGS-E, and the neighborhood-loss invariant are proved (Theorem 1, Lemmas 1–2); necessary/sufficient conditions for positive compression and a detailed complexity analysis (Theorem 5) are given. Local decompression supports neighborhood, reachability and shortest-path queries with the characteristics of Table 2. Experiments on ten SNAP graphs plus BA/ER families report compression ratios, reconstruction error, query accuracy and wall-clock times against SLUGGER, MoSSo, SWeG, GraphZip and SSumM, claiming superior or competitive compression and high query accuracy.
Significance. If the claims hold, CGS fills a genuine gap: a single framework that lets the user choose lossless versus one-sided lossy reconstruction, bound per-node neighborhood loss, and answer standard graph queries on the summary without full decompression. The formal guarantees (exact or one-sided neighborhoods with nl(u) ≤ δ_u) are stronger than most prior lossy summarizers that only report aggregate reconstruction error. The public C++ implementation and the breadth of the experimental suite (real + synthetic, compression + queries + scalability) make the contribution reproducible and practically usable. The work is therefore of clear interest to the graph-mining and data-management communities.
major comments (2)
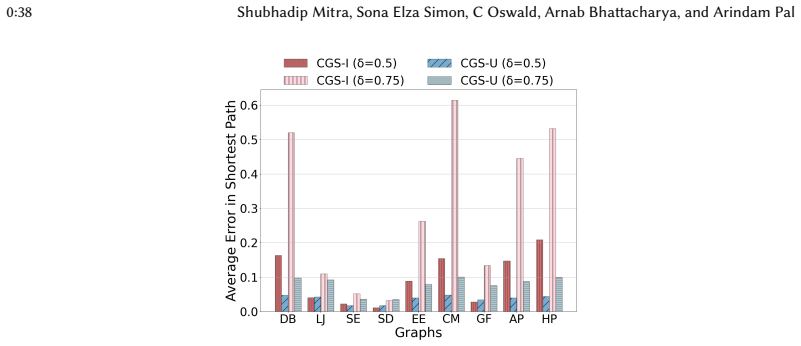
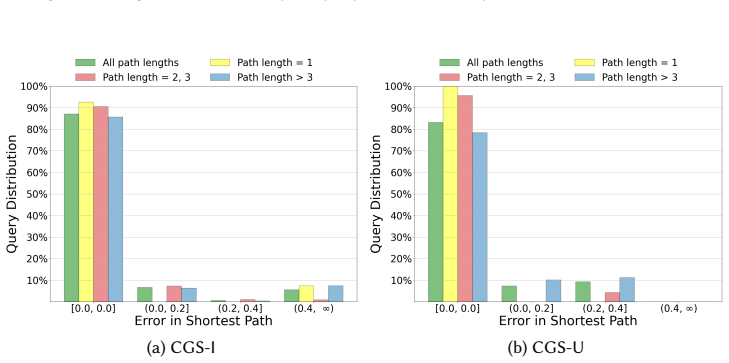
- The experimental comparison for lossy methods is limited to SSumM (Sec. 10.2.4, Figs. 5–9). The authors correctly note that the lossy variant of SWeG and several other competitors (LDME, GraSS, etc.) were unavailable or produced negative compression after format conversion. Because the central empirical claim is “superior summarization than the state-of-the-art,” the paper should either (a) obtain or re-implement at least one additional recent lossy baseline that supports bounded error, or (b) explicitly qualify the claim as “superior to the publicly runnable baselines we could evaluate.” Without this, the strength of the empirical superiority statement remains overstated relative to the evidence presented.
- Complexity (Theorem 5) is O(m d*^3 log n) for CGS-E and higher for the lossy variants. On the denser SNAP graphs (GF, AP, HP) and on the larger synthetic instances the reported wall-clock times already reach hours (Figs. 21–24). The paper never discusses whether the cubic dependence on maximum degree can be mitigated (sampling of candidate pairs, approximate heaps, parallelization, etc.). Given that the abstract advertises “efficiency,” a short discussion of practical scalability limits and possible algorithmic improvements is needed for the claim to be fully credible.
minor comments (5)
- Table 1 lists many related methods; a short paragraph explaining why the chosen baselines are the most competitive among those that support both lossless/lossy modes and query answering would help the reader.
- Notation for reconstructed degree deg_Gr(u) is introduced in Algo. 1 and used heavily in IsSafeMerge/UpdateDegree, yet never formally defined in the main text; a one-line definition would improve readability.
- In Sec. 10.3.1 the authors observe that denser graphs compress better under CGS-E; a brief theoretical remark linking this observation to Theorems 2–4 would strengthen the narrative.
- Figures 2–7 would benefit from error bars or at least a statement that each bar is a single deterministic run (the algorithm is deterministic once δ is fixed).
- A few typographical inconsistencies remain (e.g., “ConfiGS” vs. “CGS”, occasional missing spaces around mathematical operators).
Circularity Check
No circularity: correctness and bounded-loss claims follow by construction from elementary set operations and explicit safety checks, with no fitted parameters or load-bearing self-citations.
full rationale
The paper's central results (Theorem 1 on reconstruction invariants, Lemmas 1–2 on UpdateDegree/IsSafeMerge, Theorems 2–4 on compression conditions, and Table 2 query characteristics) are derived directly from the definitions of the three merge rules (intersection/union/exact common neighborhoods in Sec. 4.2), the ancestor-based degree tracking (Algos. 5–8), and the explicit pre-merge safety test that enforces nl(u) ≤ δ_u for every node. These are ordinary algorithmic invariants maintained by construction; they do not reduce a claimed “prediction” or “first-principles result” to an input that already encodes the same quantity. δ_u is an explicit user knob, never fitted to data and then re-presented as a prediction. No uniqueness theorem, ansatz, or empirical pattern is imported via self-citation; the related-work citations are to independent prior algorithms used only for empirical baselines. Empirical superiority claims are ordinary head-to-head measurements on public SNAP and synthetic graphs, not forced by any fitted constant. The derivation chain is therefore self-contained and free of the six circularity patterns.
Assumptions & free parameters
free parameters (1)
- neighborhood loss tolerance threshold δ_u (or uniform δ) =
0.25 / 0.5 / 0.75 (uniform)
assumptions (3)
- domain assumption Graphs are undirected, unweighted and simple; adjacency-list size is |V|+2|E|.
- ad hoc to paper A merge is safe if and only if the ancestor-based degree-update rules keep every node’s reconstructed degree inside the δ_u interval.
- standard math Compression gain of a candidate pair is exactly the change in |V|+2|E| plus the constant overhead of one supernode (Eq. 7).
invented entities (1)
-
CGS-E / CGS-I / CGS-U supernode hierarchy with parent/ancestor sets
independent evidence
Cite this review
Pith. "Pith review of CGS: Configurable Graph Summarization with Bounded Neighborhood Loss and Query Support." pith.science (2026). https://pith.science/paper/HBANS5HR
@misc{pith2026260710969,
  author       = {Pith},
  title        = {Pith review of: CGS: Configurable Graph Summarization with Bounded Neighborhood Loss and Query Support},
  year         = {2026},
  howpublished = {\url{https://pith.science/paper/HBANS5HR}},
  note         = {Machine review of arXiv:2607.10969}
}
read the original abstract
Given a large graph, how to generate a compact summary graph that is configurable by the user and supports multiple graph queries with either no loss or with high accuracy? The ever growing size of graph datasets makes the above question on graph summarization very pertinent. Although, there are several approaches, there does not exist a configurable graph summarization method that offers high compression along with support for multiple graph queries on the summary graph with high accuracy, and allows the user to configure the summarization based on: (1) lossless or lossy summarization, (2) amount of tolerable neighborhood loss, (3) the type of loss it can tolerate, in terms of false positive edges (i.e., extra edges), false negative edges (i.e., missing edges), or neither, in both the (a) reconstructed graph and the (b) query answers. To overcome these limitations, we propose a novel graph summarization framework CGS (Configurable Graph Summarizer) that builds upon the idea of aggregating nodes with common neighborhoods. The CGS framework consists of three summarization variants, CGS-E, CGS-I and CGS-U. While CGS-E is a lossless scheme, CGS-I and CGS-U are lossy schemes that allow reconstruction of the input graph with no false positive edges and no false negative edges, respectively. To bound the graph reconstruction loss, we introduce a user-specified parameter neighborhood loss tolerance threshold, that limits the maximum loss allowed in the neighborhood of each node. This allows graph reconstruction and neighborhood query evaluation with either no loss or with bounded loss guarantees. Empirical evaluation on several synthetic and real-world graphs shows that CGS offers superior summarization than the state-of-the-art methods, and can answer graph queries with fairly high accuracy and efficiency.
Figures


Figures from the paper (17 more)




Reference graph
Works this paper leans on
-
[1]
Sarwan Ali, Muhammad Ahmad, Maham Anwer Beg, Imdad Ullah Khan, Safiullah Faizullah, and Muhammad Asad Khan. 2024. Ssag: Summarization and sparsification of attributed graphs.ACM Transactions on Knowledge Discovery from Data18, 6 (2024), 1–22
2024
-
[2]
Aris Anagnostopoulos, Valentina Arrigoni, Francesco Gullo, Giorgia Salvatori, and Lorenzo Severini. 2024. General- purpose query processing on summary graphs.Social Network Analysis and Mining14, 1 (2024), 157
2024
-
[3]
Albert-László Barabási and Réka Albert. 1999. Emergence of Scaling in Random Networks.Science286, 5439 (Oct. 1999), 509–512. ACM Trans. Knowl. Discov. Data., Vol. 0, No. 0, Article 0. Publication date: 2025. CGS: Configurable Graph Summarization with Bounded Neighborhood Loss and Query Support 0:43
1999
-
[4]
Maham Anwar Beg, Muhammad Ahmad, Arif Zaman, and Imdadullah Khan. 2018. Scalable approximation algorithm for graph summarization. InAdvances in Knowledge Discovery and Data Mining: 22nd Pacific-Asia Conference, PAKDD 2018, Melbourne, VIC, Australia, June 3-6, 2018, Proceedings, Part III 22. Springer, 502–514. doi:10.1007/978-3-319-93040-4_40
-
[5]
Dimitris Berberidis, Pierre J Liang, and Leman Akoglu. 2022. Summarizing labeled multi-graphs. InJoint European Conference on Machine Learning and Knowledge Discovery in Databases. Springer, 53–68
2022
-
[6]
Maciej Besta and Torsten Hoefler. 2018. Survey and taxonomy of lossless graph compression and space-efficient graph representations. arXiv preprint arXiv:1806.01799. doi:10.48550/arXiv.1806.01799
-
[7]
Maciej Besta, Simon Weber, Lukas Gianinazzi, Robert Gerstenberger, Andrey Ivanov, Yishai Oltchik, and Torsten Hoefler. 2019. Slim graph: Practical lossy graph compression for approximate graph processing, storage, and analytics. InHPCNSA. 1–25. doi:10.1145/3295500.3356182
-
[8]
Paolo Boldi, Marco Rosa, Massimo Santini, and Sebastiano Vigna. 2011. Layered label propagation: a multiresolution coordinate-free ordering for compressing social networks. InProceedings of the 20th International Conference on World Wide Web(Hyderabad, India)(WWW ’11). Association for Computing Machinery, New York, NY, USA, 587–596. doi:10.1145/1963405.1963488
Show all 39 references
-
[9]
Paolo Boldi and Sebastiano Vigna. 2004. The webgraph framework I: compression techniques. InProceedings of the 13th international conference on World Wide Web. 595–602. doi:10.1145/988672.988752
2004 doi
-
[10]
2022.Introduction to algorithms
Thomas H Cormen, Charles E Leiserson, Ronald L Rivest, and Clifford Stein. 2022.Introduction to algorithms. MIT press
2022
-
[11]
Amin Emamzadeh Esmaeili Nejad, Mansoor Zolghadri Jahromi, and Mohammad Taheri. 2021. Graph compression based on transitivity for neighborhood query.Information Sciences576 (2021), 312–328. doi:10.1016/j.ins.2021.06.050
2021 doi
-
[12]
Erdös and A
P. Erdös and A. Rényi. 1959. On random graphs, I.Publicationes Mathematicae (Debrecen)6 (1959), 290–297
1959
-
[13]
Wenfei Fan, Jianzhong Li, Xin Wang, and Yinghui Wu. 2012. Query preserving graph compression. InProceedings of the 2012 ACM SIGMOD international conference on management of data. 157–168. doi:10.1145/2213836.2213855
2012 doi
- [14]
- [15]
-
[16]
Arijit Khan, Sourav S Bhowmick, and Francesco Bonchi. 2017. Summarizing static and dynamic big graphs.Proceedings of the VLDB Endowment10, 12 (2017), 1981–1984. doi:10.14778/3137765.3137825
2017 doi
-
[17]
Kifayat Ullah Khan, Waqas Nawaz, and Young-Koo Lee. 2015. Set-based approximate approach for lossless graph summarization.Computing97 (2015), 1185–1207. doi:10.1007/s00607-015-0454-9
2015 doi
-
[18]
Jihoon Ko, Yunbum Kook, and Kijung Shin. 2020. Incremental lossless graph summarization. InProceedings of the 26th ACM SIGKDD International Conference on Knowledge Discovery & Data Mining. 317–327. doi:10.1145/3394486.3403074
2020 doi
-
[19]
Danai Koutra, U Kang, Jilles Vreeken, and Christos Faloutsos. 2014. Vog: Summarizing and understanding large graphs. InProceedings of the 2014 SIAM international conference on data mining. SIAM, 91–99. doi:10.1002/sam.11267
2014 doi
-
[20]
K Ashwin Kumar and Petros Efstathopoulos. 2018. Utility-driven graph summarization.Proceedings of the VLDB Endowment12, 4 (2018), 335–347. doi:10.14778/3297753.3297755
2018 doi
-
[21]
Emory Melody Lab. 2024. Graph Reduction / Summarization / Simplification. GitHub repository
2024
-
[22]
Meiquan Lai, Yaqi Huang, Zhidan Liu, and Kaishun Wu. 2023. An optimized lossless graph summarization for large-scale graphs. In2023 IEEE 29th International Conference on Parallel and Distributed Systems (ICPADS). IEEE, 355–362
2023
-
[23]
Kyuhan Lee, Hyeonsoo Jo, Jihoon Ko, Sungsu Lim, and Kijung Shin. 2020. SsumM: Sparse summarization of massive graphs. InProceedings of the 26th ACM SIGKDD International Conference on Knowledge Discovery & Data Mining. 144–154. doi:10.1145/3394486.3403057
2020 doi
-
[24]
Kyuhan Lee, Jihoon Ko, and Kijung Shin. 2022. Slugger: Lossless hierarchical summarization of massive graphs. In 2022 IEEE 38th International Conference on Data Engineering (ICDE). IEEE, 472–484. doi:10.1109/ICDE53745.2022.00040
2022 doi
-
[25]
Kristen LeFevre and Evimaria Terzi. 2010. GraSS: Graph structure summarization. InProceedings of the 2010 SIAM International Conference on Data Mining. SIAM, 454–465. doi:10.1137/1.9781611972801.40
2010 doi
-
[26]
Jure Leskovec and Andrej Krevl. 2014. SNAP Datasets: Stanford Large Network Dataset Collection. http://snap.stanford. edu/data
2014
-
[27]
Faming Li, Zhaonian Zou, Jianzhong Li, and Yingshu Li. 2019. Graph compression with stars. InAdvances in Knowledge Discovery and Data Mining: 23rd Pacific-Asia Conference, PAKDD 2019, Macau, China, April 14-17, 2019, Proceedings, Part II 23. Springer, 449–461. doi:10.1007/978-...
2019 doi
-
[28]
Panagiotis Liakos, Katia Papakonstantinopoulou, and Michael Sioutis. 2014. On the effect of locality in compressing social networks. InEuropean Conference on Information Retrieval. Springer, 650–655. doi:10.1007/978-3-319-06028-6_71
2014 doi
-
[29]
Yuzhi Liang, Chen Chen, Yukun Wang, Kai Lei, Min Yang, and Ziyu Lyu. 2020. Reachability preserving compression for dynamic graph.Information Sciences520, C (2020), 232–249. doi:10.1016/j.ins.2020.02.028 ACM Trans. Knowl. Discov. Data., Vol. 0, No. 0, Article 0. Publication dat...
2020 doi
-
[30]
Yike Liu, Tara Safavi, Abhilash Dighe, and Danai Koutra. 2018. Graph summarization methods and applications: A survey.ACM computing surveys (CSUR)51, 3 (2018), 1–34. doi:10.1145/3186727
2018 doi
- [31]
-
[32]
Hossein Maserrat and Jian Pei. 2010. Neighbor query friendly compression of social networks. InProceedings of the 16th ACM SIGKDD international conference on Knowledge discovery and data mining. 533–542
2010
-
[33]
Chemseddine Nabti and Hamida Seba. 2017. Querying massive graph data: A compress and search approach.Future Generation Computer Systems74 (2017), 63–75
2017
-
[34]
Saket Navlakha, Rajeev Rastogi, and Nisheeth Shrivastava. 2008. Graph summarization with bounded error. In Proceedings of the 2008 ACM SIGMOD international conference on Management of data. 419–432. doi:10.1145/1376616. 1376661
2008 doi
-
[35]
Morteza Ramezani, Mahmut T Kandemir, and Anand Sivasubramaniam. 2022. GraphGuess: Approximate Graph Processing System with Adaptive Correction. InEuropean Conference on Parallel Processing. Springer, 285–300
2022
-
[36]
Matteo Riondato, David García-Soriano, and Francesco Bonchi. 2017. Graph summarization with quality guarantees. Data mining and knowledge discovery31 (2017), 314–349. doi:10.1109/ICDM.2014.56
2017 doi
-
[37]
Ryan A Rossi and Rong Zhou. 2018. Graphzip: a clique-based sparse graph compression method.Journal of Big Data5, 1 (2018), 10. doi:10.1186/s40537-018-0121-z
2018 doi
-
[38]
Kijung Shin, Amol Ghoting, Myunghwan Kim, and Hema Raghavan. 2019. Sweg: Lossless and lossy summarization of web-scale graphs. InThe World Wide Web Conference. 1679–1690. doi:10.1145/3308558.3313402
2019 doi
-
[39]
Quinton Yong, Mahdi Hajiabadi, Venkatesh Srinivasan, and Alex Thomo. 2021. Efficient graph summarization using weighted lsh at billion-scale. InProceedings of the 2021 International Conference on Management of Data. 2357–2365. doi:10.1145/3448016.3457331 Received 7th February,...
2021 doi
Reviewed July 14, 2026 · model on record in the stance chip above.
Discussion (0). Continue with ORCID to comment.