REVIEW 3 major objections 4 minor 75 references
UrbanAgent turns urban indicator prediction into a collaborative, tool-using reasoning process, reporting an average 8.1% R2 gain over static multimodal models and smaller performance drops on unseen cities.
Reviewed by Pith at T0; open to challenge. T0 means a machine referee read the full paper against a public rubric. the ladder, T0–T4 →
A multi-agent LLM framework with reinforcement-learned tool use outperforms prior urban profiling models on GDP, population, and carbon estimation, including on unseen cities.
T0 review reviewed 2026-08-02 challenge →
load-bearing objection The 8.1% R2 gain is consistent across settings, but the paper never rules out the simplest explanation: the tools, especially nightlight retrieval, give the model a strong label proxy that looks like reasoning. the 3 major comments →
Multi-Agent Collaborative Reasoning with Tool-Augmented Evidence for Urban Region Profiling
The pith
A machine-rendered reading of the paper's core claim, the machinery that carries it, and where it could break.
The reading
Core claim
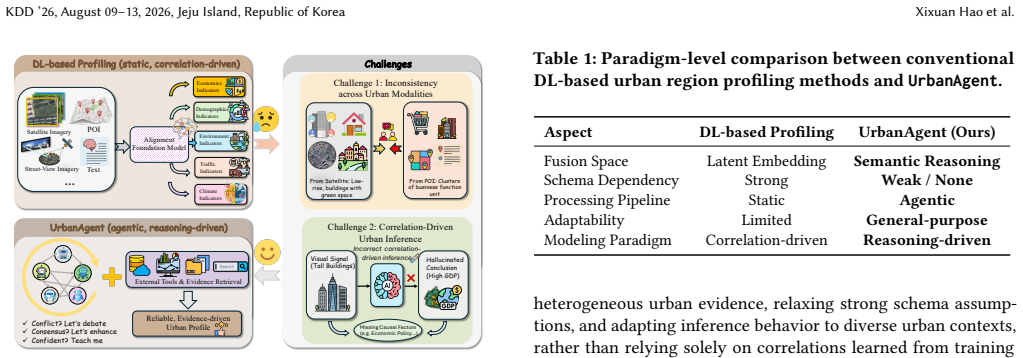
On its own terms, the paper's discovery is that urban region profiling can be recast from a static fusion task into an inference task, and that the recasting pays off. Each modality-specific agent first learns through supervised fine-tuning plus group relative policy optimization to produce grounded predictions and confidence scores, and to invoke tools such as web search, crop-and-zoom, nightlight retrieval, and historical satellite retrieval. Then a heterogeneous graph connects agents whose predictions agree within a threshold (corroboration), disagree beyond a threshold (rectification), or differ sharply in confidence (supervision), and iterative message passing reconciles the estimates.
What carries the argument
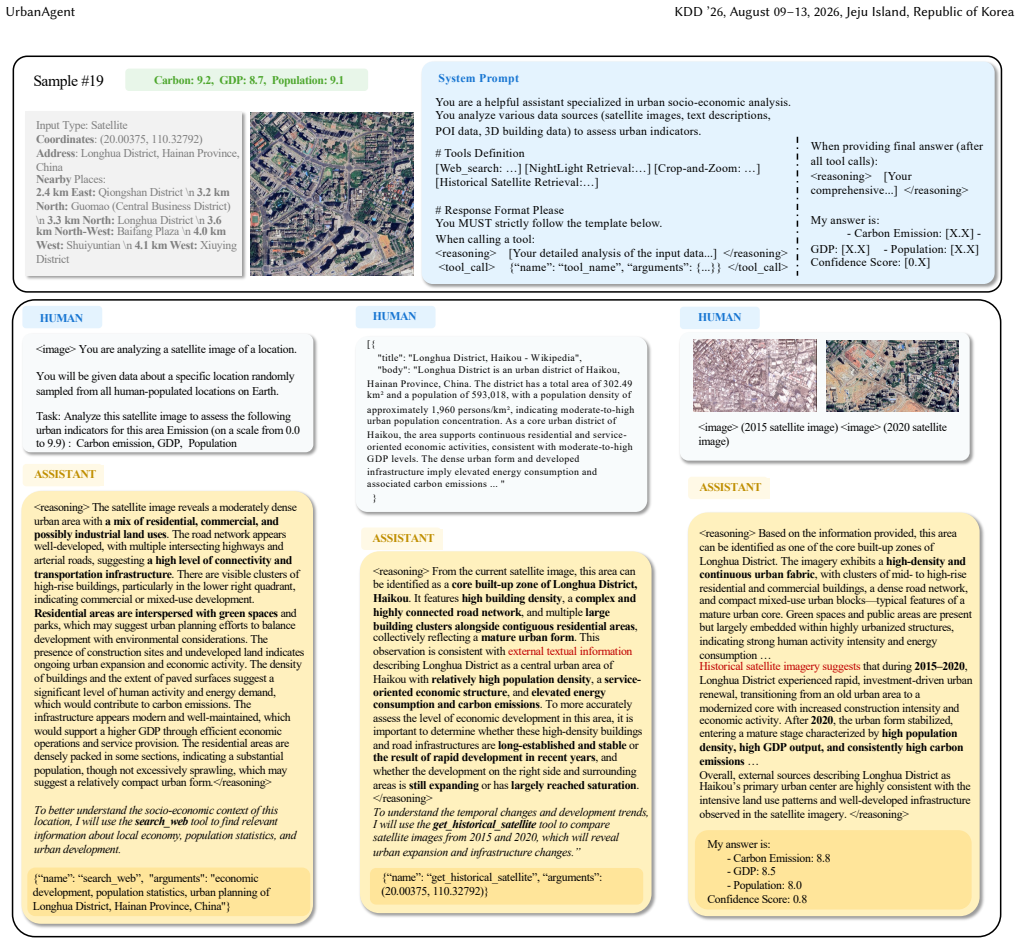
The load-bearing machinery is the multi-agent interaction graph together with the tool-augmented learning loop. Nodes are modality-specific agents; directed edges are constructed from prediction differences (corroboration if close, rectification if far) and confidence gaps (supervision), and each round of message passing uses a gated update, with a final spatio-temporal judge weighting agents. The learning loop uses group relative policy optimization with a composite reward for outcome accuracy, output format, and tool-use process, letting agents acquire external evidence instead of relying only on internal correlations.
Load-bearing premise
The framework's gain rests on the premise that the external tools supply genuinely independent evidence rather than a near-direct read-out of the target label: the paper argues in Appendix A.1 that web search returns only city-level qualitative information and that label scaling blocks direct retrieval, but it supplies no empirical check of whether nightly-lighting retrieval or web text acts as a strong proxy, and the RL training would exploit such a proxy if present.
What would settle it
Run UrbanAgent with the web-search and nightlight tools disabled, keeping only crop-and-zoom and historical satellite imagery. If R² on unseen cities remains close to the full system, the gains come from visual reasoning; if it falls to baseline levels, the reported improvement is a tool-lookup effect. A complementary probe: inject plausible-but-false web snippets for known regions and check whether predictions move toward the false text, which would indicate the model is reading web results as ground truth rather than using them as corroborative evidence.
If this is right
- If correct, urban socioeconomic indicators can be derived from public satellite, POI, 3D, and text data with higher accuracy than static embedding models, reducing the need for expensive field surveys.
- The unseen-city results imply the method's advantage is not city-specific memorization; the reasoning process may transfer to data-scarce countries and regions.
- The interaction graph makes the inference traceable: an observer can see which agents agreed, which corrected others, and which high-confidence agent dominated.
- Because the reward decomposes into accuracy, format, and process, the same recipe can be adapted to other indicators or to new tools without redesigning the framework.
Where Pith is reading between the lines
- The paper does not ablate the nightlight and web-search tools separately; a reader might test whether the RL policy learns generalizable inference or a proxy-reading shortcut, since nightlight intensity is a strong correlate of GDP and population.
- The three edge thresholds are fixed hyperparameters; learning them or making them context-dependent could improve performance in highly heterogeneous regions, an extension the paper leaves open.
- With 2,000 training cells, the benchmark is small relative to the diversity of global urban form; the reported 8.1% gain and transferability deserve a larger, continent-balanced confirmation before being treated as a stable law.
Editorial analysis
A structured set of objections, weighed in public.
Referee Report
Summary. UrbanAgent reframes urban region profiling as an agentic, reasoning-driven inference problem. Modality-specific LLM agents are trained with SFT and GRPO to invoke external tools (web search, crop-and-zoom, nightlight retrieval, historical satellite imagery) and to emit confidence estimates; a second stage organizes the agents into a heterogeneous graph with corroboration, rectification, and supervisory edges, followed by iterative message passing and a hierarchical judge. The paper reports experiments on carbon emission, GDP, and population estimation over 2,000 1 km×1 km regions, claiming an average 8.1% R2 improvement over strong baselines and robust transfer to 200 locations from four unseen countries (Table 2).
Significance. If the reported gains reflect the proposed mechanism, the paper makes a useful contribution: it gives a concrete architecture for moving urban region profiling from static latent fusion to explicit evidence acquisition and multi-agent conflict resolution, and it evaluates against external ground-truth labels with a broad set of baselines and ablations (including single-agent tool-use and no-tool variants). The appendices provide useful detail on tool construction, data sources, and baselines. However, the central empirical claim is currently confounded: the tool suite includes channels that are strong numeric proxies for the very targets being predicted, and no baseline is given equal access to those channels. In addition, all headline numbers come from a single run with no error bars or significance tests, so the magnitude of the claimed gains is not yet established.
major comments (3)
- [§3.1.1, Appendix A, Eq. (1), Table 2] The tool suite is not a neutral evidence channel. Nightlight Retrieval is described in Appendix A as returning a scalar nighttime-light intensity that 'serves as a proxy indicator for regional development.' Nighttime lights are among the strongest known correlates of GDP, population, and carbon emissions. Because the GRPO outcome reward in Eq. (1) directly rewards numeric accuracy, the policy can maximize reward by learning to call Nightlight and map the returned scalar to the target value. Web search can likewise return district-level population and economic statistics, as shown in Figure 10 (Longhua District population and density). None of the baselines in Table 2 has access to these tool outputs, and the final prediction in Eq. (14) is a learned weighted fusion. The reported 8.1% R2 gain and the small unseen-city degradation are therefore equally explained by an extra near-label inpu
- [§4.2, Table 2, §4.4, Figure 5a] All reported results are single-run. Table 2 and the ablations give no standard deviations, confidence intervals, or significance tests. With 2,000 total locations and an unseen-city test set of only 200 locations from four countries, the headline gains of 7.4, 9.5, and 7.3 percentage points in R2 may be within run-to-run variability, particularly for the smaller and heterogeneous unseen-city split. Please provide results over multiple seeds (mean ± std) and paired significance tests for the key comparisons, and report a per-country breakdown for the unseen-city setting.
- [§3.2.1, §4.1.3, Eq. (1)] The method has several free parameters that are load-bearing for the reported configuration but are not fully specified. The reward weights α, β, γ in Eq. (1) are never given numerical values, and the edge thresholds τ_cor, τ_rec, τ_sup are tuned jointly with the number of rounds L on the validation set (Figure 5b). This makes it difficult to assess how much of the gain comes from tuning these hyperparameters. Please report the reward weights, the selection procedure for the thresholds, and the sensitivity of the final test results to these choices.
minor comments (4)
- [Appendix B] Typo: 'we introduction the data sources' should read 'we introduce the data sources.'
- [Abstract / §4.2] The abstract says an 'average improvement of 8.1% in R2,' while Section 4.2 reports per-indicator gains of 7.4%, 9.5%, and 7.3%. Please clarify whether the average is over the three in-domain indicators only or also includes the unseen-city rows, and whether these are percentage-point differences.
- [Table 2] The row labels 'Ours w/o MAS' followed by individual modalities are easy to misread as separate models. Consider relabeling as 'Ours (single agent, satellite)', etc., and adding a separate row for 'Ours w/o tools' in the ablation table.
- [§4.1.3] The implementation paragraph lists many hyperparameters but omits the values of α, β, γ from Eq. (1) and the number of GRPO group samples G. Please include these for reproducibility.
Circularity Check
No circular derivation chain: held-out external labels ground the R2 claim; self-citations are contextual, not load-bearing. Main residual risk is tool-channel leakage, which is a validity concern, not circularity.
full rationale
UrbanAgent's pipeline is a standard supervised/tool-augmented RL pipeline: tool-use trajectories are curated from labeled samples (Section 3.1.1), SFT cold-start and GRPO optimize a composite reward whose outcome term measures agreement with ground-truth labels (Eq. 1), modality agents emit initial predictions, multi-agent graph message passing refines them (Eqs. 4-12), and a learned judge produces the final estimate (Eqs. 13-14). Every fitted parameter (policy weights, fusion thresholds, attention weights) is trained on the 70% training split and evaluated on the held-out 20% test split and on 200 unseen-city samples; the targets (ODIAC carbon, WorldPop population, CityLens/Zenodo GDP) are external data products, not outputs of the model. Nothing in the equations defines the prediction in terms of the target or vice versa; the outcome reward is a measurement of error, not a constraint that forces the reported R2. The paper contains many self-citations (UrbanVLP [13], UrbanCLIP [49], Urban-R1 [43], Traffic-R1 [68], the survey [15]), but these support dataset construction, baseline selection, and design motivation; none is invoked as a uniqueness theorem or as the only evidence for the empirical gain. The most serious concern is not circularity but measurement validity: Appendix A.1 defends web search against direct label retrieval by granularity mismatch and score scaling, but does not analyze the Nightlight Retrieval tool, whose scalar intensity is a well-known proxy for GDP/population/carbon. A controlled comparison giving baselines the same tool outputs would be needed to separate the value of extra input channels from the value of multi-agent reasoning. That is an unaddressed alternative explanation, not a derivation that reduces to its own inputs, so the circularity score remains low.
Axiom & Free-Parameter Ledger
free parameters (3)
- Edge thresholds (τ_cor, τ_rec, τ_sup) =
(0.40, 1.20, 0.25)
- Reward weights α, β, γ (Eq. 1) =
not reported
- Number of reasoning rounds L and hidden state dim d_h (Eqs. 7–14) =
L=5, d_h=192
axioms (4)
- domain assumption Web search results and other tool observations do not contain the 1 km × 1 km ground-truth labels or invertible encodings of them (no label leakage).
- domain assumption Nightlight intensity and historical satellite imagery are valid, non-redundant evidence sources whose use in RL training does not simply reinstate a known proxy correlation.
- domain assumption The SFT cold-start trajectories generated by Qwen3-VL-7B are correct, sufficiently diverse, and do not bias the policy toward the annotation model's errors.
- domain assumption The unseen-city split (200 locations in Japan, Norway, Madagascar, Mexico) provides a meaningful out-of-distribution test rather than an easy near-duplicate of training cities.
Cite this review
Pith. "Pith review of Multi-Agent Collaborative Reasoning with Tool-Augmented Evidence for Urban Region Profiling." pith.science (2026). https://pith.science/paper/5TMQADKA
@misc{pith2026260713558,
  author       = {Pith},
  title        = {Pith review of: Multi-Agent Collaborative Reasoning with Tool-Augmented Evidence for Urban Region Profiling},
  year         = {2026},
  howpublished = {\url{https://pith.science/paper/5TMQADKA}},
  note         = {Machine review of arXiv:2607.13558}
}
read the original abstract
Urban region profiling constitutes a core problem in urban computing, supporting applications such as population estimation, economic assessment, and environmental monitoring. Existing methods typically formulate this task as multimodal representation learning, fusing heterogeneous urban data, e.g., satellite imagery, points of interest, textual descriptions, and 3D building information, into latent embeddings for prediction. However, these approaches are largely correlation-driven, assume cross-modal consistency, and rely on static pipelines, which limit their robustness in heterogeneous or unseen urban regions. We propose UrbanAgent, an agentic framework that reframes urban region profiling as a reasoning-driven inference problem. UrbanAgent instantiates an independent agent for each data modality and performs structured multi-agent collaborative reasoning to explicitly address cross-modal inconsistencies rather than absorbing them into a single representation. In addition, UrbanAgent extends indicator prediction as a closed-loop process of active evidence acquisition and iterative reasoning, enabling agents to verify uncertain inferences through tool-augmented retrieval of external knowledge optimized via reinforcement learning. Extensive experiments on global urban datasets for Carbon emissions, GDP, and Population estimation show that UrbanAgent consistently outperforms existing baselines, achieving an average improvement of 8.1% in R2, and exhibiting strong generalization performance in unseen-city settings.
Figures


Reference graph
Works this paper leans on
-
[1]
Shuai Bai, Yuxuan Cai, Ruizhe Chen, Keqin Chen, Xiong-Hui Chen, Zesen Cheng, Lianghao Deng, Wei Ding, Rongyao Fang, Chang Gao, Chunjiang Ge, Wenbin Ge, Zhifang Guo, Qidong Huang, Qidong Huang, Fei Huang, Binyuan Hui, Shutong Jiang, Zhaohai Li, Mingsheng Li, Mei Li, Kaixin Li, Zicheng Lin, Junyang Lin, Xuejing Liu, Jiawei Liu, Chenglong Liu, Yang Liu, Dayi...
Pith/arXiv arXiv 2025
-
[2]
Shuai Bai, Keqin Chen, Xuejing Liu, Jialin Wang, Wenbin Ge, Sibo Song, Kai Dang, Peng Wang, Shijie Wang, Jun Tang, et al . 2025. Qwen2. 5-vl technical report.arXiv preprint arXiv:2502.13923(2025)
Pith/arXiv arXiv 2025
-
[3]
Jinzhou Cao, Jiashi Chen, Xiangxu Wang, Weiming Huang, Dongsheng Chen, Tianhong Zhao, Wei Tu, and Qingquan Li. 2026. UrbanMMCL: Urban region representations via multi-modal and multi-graph self-supervised contrastive learning.ISPRS Journal of Photogrammetry and Remote Sensing232 (2026), 75–93
2026
-
[4]
Weiliang Chan and Qianqian Ren. 2023. Region-wise attentive multi-view representation learning for urban region embedding. InProceedings of the 32nd ACM International Conference on Information and Knowledge Management. 3763–3767
2023
-
[5]
Yangzi Che, Xuecao Li, Xiaoping Liu, Yuhao Wang, Weilin Liao, Xianwei Zheng, Xucai Zhang, Xiaocong Xu, Qian Shi, Jiajun Zhu, et al. 2024. 3D-GloBFP: The first global three-dimensional building footprint dataset.Earth System Science Data Discussions2024 (2024), 1–28
2024
-
[6]
Zhe Chen, Weiyun Wang, Yue Cao, Yangzhou Liu, Zhangwei Gao, Erfei Cui, Jinguo Zhu, Shenglong Ye, Hao Tian, Zhaoyang Liu, et al . 2024. Expanding performance boundaries of open-source multimodal models with model, data, and test-time scaling.arXiv preprint arXiv:2412.05271(2024)
Pith/arXiv arXiv 2024
-
[7]
Gheorghe Comanici, Eric Bieber, Mike Schaekermann, Ice Pasupat, Noveen Sachdeva, Inderjit Dhillon, Marcel Blistein, Ori Ram, Dan Zhang, Evan Rosen, et al . 2025. Gemini 2.5: Pushing the frontier with advanced reasoning, multimodality, long context, and next generation agentic capabilities.arXiv preprint arXiv:2507.06261(2025)
Pith/arXiv arXiv 2025
-
[8]
Jie Feng, Shengyuan Wang, Tianhui Liu, Yanxin Xi, and Yong Li. 2025. UrbanLLaVA: A Multi-modal Large Language Model for Urban Intelligence with Spatial Reasoning and Understanding. InProceedings of the IEEE/CVF international conference on computer vision
2025
-
[9]
Peilin Feng, Zhutao Lv, Junyan Ye, Xiaolei Wang, Xinjie Huo, Jinhua Yu, Wanghan Xu, Wenlong Zhang, Lei Bai, Conghui He, et al. 2025. Earth-agent: Unlocking the full landscape of earth observation with agents.arXiv preprint arXiv:2509.23141 (2025)
arXiv 2025
-
[10]
Daya Guo, Dejian Yang, Haowei Zhang, Junxiao Song, Ruoyu Zhang, Runxin Xu, Qihao Zhu, Shirong Ma, Peiyi Wang, Xiao Bi, et al . 2025. Deepseek-r1: Incentivizing reasoning capability in llms via reinforcement learning.arXiv preprint arXiv:2501.12948(2025)
Pith/arXiv arXiv 2025
-
[11]
Xusen Guo, Mingxing Peng, Xixuan Hao, Xingchen Zou, Qiongyan Wang, Sijie Ruan, and Yuxuan Liang. 2026. AgentSense: LLMs empower generalizable and explainable web-based participatory urban sensing. InProceedings of the ACM Web Conference 2026. 5439–5450
2026
-
[12]
Xiao Han, Chen Zhu, Hengshu Zhu, and Xiangyu Zhao. 2025. Swarm intelligence in geo-localization: A multi-agent large vision-language model collaborative framework. InProceedings of the 31st ACM SIGKDD Conference on Knowledge Discovery and Data Mining V. 2. 814–825
2025
-
[13]
Xixuan Hao, Wei Chen, Yibo Yan, Siru Zhong, Kun Wang, Qingsong Wen, and Yuxuan Liang. 2025. Urbanvlp: Multi-granularity vision-language pretraining for urban socioeconomic indicator prediction. InProceedings of the AAAI Conference on Artificial Intelligence, Vol. 39. 28061–28069
2025
-
[14]
Xixuan Hao, Wei Chen, Xingchen Zou, and Yuxuan Liang. 2025. Nature makes no leaps: Building continuous location embeddings with satellite imagery from the web. InProceedings of the ACM on Web Conference 2025. 2799–2812
2025
-
[15]
Xixuan Hao, Yutian Jiang, Xingchen Zou, Jiabo Liu, Yifang Yin, and Yuxuan Liang
-
[16]
Xixuan Hao, Guicheng Li, Daiqiang Wu, Xusen Guo, Yumeng Zhu, Zhichao Zou, Peng Zhen, Yao Yao, and Yuxuan Liang. 2026. Enhancing Ride-Hailing Forecasting at DiDi with Multi-View Geospatial Representation Learning from the Web. InProceedings of the ACM Web Conference 2026. 8200–8211
2026
-
[17]
Aaron Hurst, Adam Lerer, Adam P Goucher, Adam Perelman, Aditya Ramesh, Aidan Clark, AJ Ostrow, Akila Welihinda, Alan Hayes, Alec Radford, et al. 2024. Gpt-4o system card.arXiv preprint arXiv:2410.21276(2024)
Pith/arXiv arXiv 2024
-
[18]
Neal Jean, Sherrie Wang, Anshul Samar, George Azzari, David Lobell, and Stefano Ermon. 2019. Tile2vec: Unsupervised representation learning for spatially distributed data. InProceedings of the AAAI Conference on Artificial Intelligence, Vol. 33. 3967–3974
2019
-
[19]
Porter Jenkins, Ahmad Farag, Suhang Wang, and Zhenhui Li. 2019. Unsupervised representation learning of spatial data via multimodal embedding. InProceedings of the 28th ACM international conference on information and knowledge management. 1993–2002
2019
-
[20]
Dongfu Jiang, Xiang Ren, and Bill Yuchen Lin. 2023. LLM-Blender: Ensembling Large Language Models with Pairwise Comparison and Generative Fusion. In Proceedings of the 61th Annual Meeting of the Association for Computational Linguistics (ACL 2023)
2023
-
[21]
Ling Li, Yao Zhou, Yuxuan Liang, Fugee Tsung, and Jiaheng Wei. 2025. Recognition through Reasoning: Reinforcing Image Geo-localization with Large Vision-Language Models. InAdvances in Neural Information Processing Systems
2025
-
[22]
Yi Li, Weiming Huang, Gao Cong, Hao Wang, and Zheng Wang. 2023. Urban region representation learning with openstreetmap building footprints. In Proceedings of the 29th ACM SIGKDD Conference on Knowledge Discovery and Data Mining. 1363–1373
2023
-
[23]
Zechen Li, Weiming Huang, Kai Zhao, Min Yang, Yongshun Gong, and Meng Chen. 2024. Urban region embedding via multi-view contrastive prediction. In Proceedings of the AAAI Conference on Artificial Intelligence, Vol. 38. 8724–8732
2024
-
[24]
Zhonghang Li, Lianghao Xia, Xubin Ren, Jiabin Tang, Tianyi Chen, Yong Xu, and Chao Huang. 2025. Urban computing in the era of large language models.ACM Transactions on Intelligent Systems and Technology16, 6 (2025), 1–43
2025
-
[25]
Zhili Li, Yiqun Xie, Xiaowei Jia, Kara Stuart, Caroline Delaire, and Sergii Skakun
-
[26]
Pingping Liu, Jiamiao Liu, Zijian Zhang, Hao Miao, Qi Jiang, Qingliang Li, Qiuzhan Zhou, and Irwin King. 2026. UrbanMoE: A Sparse Multi-Modal Mixture-of-Experts Framework for Multi-Task Urban Region Profiling.arXiv preprint arXiv:2601.22746(2026)
arXiv 2026
-
[27]
Tianhui Liu, Hetian Pang, Xin Zhang, Jie Feng, Yong Li, and Pan Hui. 2025. CityRiSE: Reasoning Urban Socio-Economic Status in Vision-Language Models via Reinforcement Learning.arXiv preprint arXiv:2510.22282(2025)
arXiv 2025
-
[28]
Tianhui Liu, Hetian Pang, Xin Zhang, Tianjian Ouyang, Zhiyuan Zhang, Jie Feng, Yong Li, and Hui Pan. 2025. CityLens: Evaluating Large Vision-Language Models for Urban Socioeconomic Sensing.arXiv preprint arXiv:2506.00530(2025)
arXiv 2025
-
[29]
Yu Liu, Xin Zhang, Jingtao Ding, Yanxin Xi, and Yong Li. 2023. Knowledge- infused contrastive learning for urban imagery-based socioeconomic prediction. InProceedings of the ACM web conference 2023. 4150–4160
2023
-
[30]
Ilya Loshchilov and Frank Hutter. 2017. Decoupled Weight Decay Regularization. InInternational Conference on Learning Representations. https://api. semanticscholar.org/CorpusID:53592270
2017
-
[31]
Run Luo, Lu Wang, Wanwei He, Longze Chen, Jiaming Li, and Xiaobo Xia. 2025. Gui-r1: A generalist r1-style vision-language action model for gui agents.arXiv preprint arXiv:2504.10458(2025)
Pith/arXiv arXiv 2025
-
[32]
Yan Luo, Fu-lai Chung, and Kai Chen. 2022. Urban region profiling via multi-graph representation learning. InProceedings of the 31st ACM international conference on information & knowledge management. 4294–4298
2022
-
[33]
Lobell, and Stefano Ermon
Rohin Manvi, Samar Khanna, Marshall Burke, David B. Lobell, and Stefano Ermon. 2024. Large Language Models are Geographically Biased. InForty-first International Conference on Machine Learning. https://openreview.net/forum? id=sHtIStlg0v
2024
-
[34]
Rohin Manvi, Samar Khanna, Gengchen Mai, Marshall Burke, David Lobell, and Stefano Ermon. 2024. GeoLLM: Extracting Geospatial Knowledge from Large Language Models. InInternational Conference on Learning Representations, B. Kim, Y. Yue, S. Chaudhuri, K. Fragkiadaki, M. Khan, and Y. Sun (Eds.), Vol. 2024. 38791–38807. https://proceedings.iclr.cc/paper_files...
2024
-
[35]
Dominik J Mühlematter, Lin Che, Ye Hong, Martin Raubal, and Nina Wiedemann
-
[36]
Chanwoo Park, Seungju Han, Xingzhi Guo, Asuman E Ozdaglar, Kaiqing Zhang, and Joo-Kyung Kim. 2025. Maporl: Multi-agent post-co-training for collaborative large language models with reinforcement learning. InProceedings of the 63rd Annual Meeting of the Association for Computational Linguistics (Volume 1: Long Papers). 30215–30248
2025
-
[37]
Ankur Samanta, Akshayaa Magesh, Youliang Yu, Runzhe Wu, Ayush Jain, Daniel Jiang, Boris Vidolov, Paul Sajda, Yonathan Efroni, and Kaveh Hassani. 2025. Internalizing Self-Consistency in Language Models: Multi-Agent Consensus Alignment.arXiv preprint arXiv:2509.15172(2025)
arXiv 2025
-
[38]
UrbanFusion: Stochastic Multimodal Fusion for Contrastive Learning of Robust Spatial Representations.arXiv preprint arXiv:2510.13774(2025)
Pith/arXiv arXiv 2025
-
[39]
Akashah Shabbir, Muhammad Akhtar Munir, Akshay Dudhane, Muham- mad Umer Sheikh, Muhammad Haris Khan, Paolo Fraccaro, Juan Bernabe Moreno, UrbanAgent KDD ’26, August 09–13, 2026, Jeju Island, Republic of Korea Fahad Shahbaz Khan, and Salman Khan. 2025. ThinkGeo: Evaluating Tool- Augmented Agents for Remote Sensing Tasks.arXiv preprint arXiv:2505.23752 (2025)
arXiv 2026
-
[40]
Noah Shinn, Federico Cassano, Ashwin Gopinath, Karthik Narasimhan, and Shunyu Yao. 2023. Reflexion: Language agents with verbal reinforcement learning. Advances in Neural Information Processing Systems36 (2023), 8634–8652
2023
-
[41]
Timo Schick, Jane Dwivedi-Yu, Roberto Dessì, Roberta Raileanu, Maria Lomeli, Eric Hambro, Luke Zettlemoyer, Nicola Cancedda, and Thomas Scialom. 2023. Toolformer: Language models can teach themselves to use tools.Advances in Neural Information Processing Systems36 (2023), 68539–68551
2023
-
[42]
Khanh-Tung Tran, Dung Dao, Minh-Duong Nguyen, Quoc-Viet Pham, Barry O’Sullivan, and Hoang D Nguyen. 2025. Multi-agent collaboration mechanisms: A survey of llms.arXiv preprint arXiv:2501.06322(2025)
Pith/arXiv arXiv 2025
-
[43]
Qiongyan Wang, Xingchen Zou, Yutian Jiang, Haomin Wen, Jiaheng Wei, Qingsong Wen, and Yuxuan Liang. 2025. Urban-R1: Reinforced MLLMs Mitigate Geospatial Biases for Urban General Intelligence.arXiv preprint arXiv:2510.16555 (2025)
arXiv 2025
-
[44]
Kimi Team, Angang Du, Bohong Yin, Bowei Xing, Bowen Qu, Bowen Wang, Cheng Chen, Chenlin Zhang, Chenzhuang Du, Chu Wei, et al . 2025. Kimi-vl technical report.arXiv preprint arXiv:2504.07491(2025)
Pith/arXiv arXiv 2025
-
[45]
Ya Wen and Yulun Zhou. 2024. Demo2vec: Learning region embedding with demographic information. InProceedings of the 7th ACM SIGSPATIAL International Workshop on AI for Geographic Knowledge Discovery. 71–74
2024
-
[46]
Qinzhuo Wu, Wei Liu, Jian Luan, and Bin Wang. 2024. ToolPlanner: A tool augmented LLM for multi granularity instructions with path planning and feedback.arXiv preprint arXiv:2409.14826(2024)
Pith/arXiv arXiv 2024
-
[47]
Yikun Wang, Zuyan Liu, Ziyi Wang, Han Hu, Pengfei Liu, and Yongming Rao
-
[48]
arXiv preprint arXiv:2511.15705(2025)
GeoVista: Web-Augmented Agentic Visual Reasoning for Geolocalization. arXiv preprint arXiv:2511.15705(2025)
arXiv 2025
-
[49]
Yibo Yan, Haomin Wen, Siru Zhong, Wei Chen, Haodong Chen, Qingsong Wen, Roger Zimmermann, and Yuxuan Liang. 2024. Urbanclip: Learning text-enhanced urban region profiling with contrastive language-image pretraining from the web. InProceedings of the ACM Web Conference 2024. 4006–4017
2024
-
[50]
Shunyu Yao, Jeffrey Zhao, Dian Yu, Nan Du, Izhak Shafran, Karthik R Narasimhan, and Yuan Cao. 2022. React: Synergizing reasoning and acting in language models. InThe eleventh international conference on learning representations
2022
-
[51]
Yanxin Xi, Tong Li, Huandong Wang, Yong Li, Sasu Tarkoma, and Pan Hui. 2022. Beyond the first law of geography: Learning representations of satellite imagery by leveraging point-of-interests. InProceedings of the ACM web conference 2022. 3308–3316
2022
-
[52]
Congxi Xiao, Jingbo Zhou, Yixiong Xiao, Jizhou Huang, and Hui Xiong. 2024. Refound: Crafting a foundation model for urban region understanding upon language and visual foundations. InProceedings of the 30th ACM SIGKDD Conference on Knowledge Discovery and Data Mining. 3527–3538
2024
-
[53]
Xixian Yong and Xiao Zhou. 2024. Musecl: predicting urban socioeconomic indicators via multi-semantic contrastive learning.arXiv preprint arXiv:2407.09523 (2024)
arXiv 2024
-
[54]
Cong Zhang, Xin Deik Goh, Dexun Li, Hao Zhang, and Yong Liu. 2025. Planning with multi-constraints via collaborative language agents. InProceedings of the 31st International Conference on Computational Linguistics. 10054–10082
2025
-
[55]
Christopher Yeh, Anthony Perez, Anne Driscoll, George Azzari, Zhongyi Tang, David Lobell, Stefano Ermon, and Marshall Burke. 2020. Using publicly available satellite imagery and deep learning to understand economic well-being in Africa. Nature communications11, 1 (2020), 2583
2020
-
[56]
Xixian Yong and Xiao Zhou. 2024. MuseCL: Predicting Urban Socioeconomic Indicators via Multi-Semantic Contrastive Learning. InProceedings of the Thirty- Third International Joint Conference on Artificial Intelligence, IJCAI-24, Kate Larson (Ed.). International Joint Conferences on Artificial Intelligence Organization, 7536–7544. doi:10.24963/ijcai.2024/83...
-
[57]
Hanchen Zhang, Xiao Liu, Bowen Lv, Xueqiao Sun, Bohao Jing, Iat Long Iong, Zhenyu Hou, Zehan Qi, Hanyu Lai, Yifan Xu, et al. 2025. AgentRL: Scaling Agentic Reinforcement Learning with a Multi-Turn, Multi-Task Framework.arXiv preprint arXiv:2510.04206(2025)
arXiv 2025
-
[58]
Weijia Zhang, Jindong Han, Zhao Xu, Hang Ni, Hao Liu, and Hui Xiong. 2024. Urban foundation models: A survey. InProceedings of the 30th ACM SIGKDD Conference on Knowledge Discovery and Data Mining. 6633–6643
2024
-
[59]
Guibin Zhang, Hejia Geng, Xiaohang Yu, Zhenfei Yin, Zaibin Zhang, Zelin Tan, Heng Zhou, Zhongzhi Li, Xiangyuan Xue, Yijiang Li, et al. 2025. The landscape of agentic reinforcement learning for llms: A survey.arXiv preprint arXiv:2509.02547 (2025)
Pith/arXiv arXiv 2025
-
[60]
Guibin Zhang, Yanwei Yue, Xiangguo Sun, Guancheng Wan, Miao Yu, Junfeng Fang, Kun Wang, Tianlong Chen, and Dawei Cheng. 2025. G-Designer: Architecting Multi-agent Communication Topologies via Graph Neural Networks. InForty-second International Conference on Machine Learning. https://openreview. net/forum?id=LpE54NUnmO
2025
-
[61]
Yimei Zhang, Guojiang Shen, Kaili Ning, Tongwei Ren, Xuebo Qiu, Mengmeng Wang, and Xiangjie Kong. 2026. Improving Region Representation Learning from Urban Imagery with Noisy Long-Caption Supervision. InProceedings of the AAAI Conference on Artificial Intelligence
2026
-
[62]
Yaya Zhao, Kaiqi Zhao, Zixuan Tang, Xiaoling Lu, Yuanyuan Zhang, and Yalei Du
-
[63]
Xin Zhang, Tianjian Ouyang, Yu Shang, Qingmin Liao, and Yong Li. 2025. UrbanMLLM: Joint Learning of Cross-view Imagery for Urban Understanding. (2025)
2025
-
[64]
Yu Zhang, Weiming Huang, Yao Yao, Song Gao, Lizhen Cui, and Zhongmin Yan
-
[65]
Silin Zhou, Dan He, Lisi Chen, Shuo Shang, and Peng Han. 2023. Heterogeneous region embedding with prompt learning. InProceedings of the AAAI conference on artificial intelligence, Vol. 37. 4981–4989
2023
-
[66]
Xingchen Zou, Jiani Huang, Xixuan Hao, Yuhao Yang, Haomin Wen, Yibo Yan, Chao Huang, and Yuxuan Liang. 2024. Space-aware Socioeconomic Indicator Inference with Heterogeneous Graphs.Proceedings of the 33rd ACM International Conference on Advances in Geographic Information Systems(2024). https://api. semanticscholar.org/CorpusID:269982736
2024
-
[67]
Xingchen Zou, Yibo Yan, Xixuan Hao, Yuehong Hu, Haomin Wen, Erdong Liu, Junbo Zhang, Yong Li, Tianrui Li, Yu Zheng, et al . 2025. Deep learning for cross-domain data fusion in urban computing: Taxonomy, advances, and outlook. Information Fusion113 (2025), 102606
2025
-
[68]
InJoint European Conference on Machine Learning and Knowledge Discovery in Databases
GraphJCL: A Dual-Perspective Graph-Based Framework for Urban Region Representation via Joint Contrastive Learning. InJoint European Conference on Machine Learning and Knowledge Discovery in Databases. Springer, 37–53
-
[69]
Heng Zheng, Yuling Shi, Xiaodong Gu, Haochen You, Zijian Zhang, Lubin Gan, Hao Zhang, Wenjun Huang, and Jin Huang. 2025. GraphGeo: Multi-Agent Debate Framework for Visual Geo-localization with Heterogeneous Graph Neural Networks.arXiv preprint arXiv:2511.00908(2025)
arXiv 2025
-
[70]
Siru Zhong, Xixuan Hao, Yibo Yan, Ying Zhang, Yangqiu Song, and Yuxuan Liang
-
[71]
InProceedings of the 32nd ACM International Conference on Multimedia
Urbancross: Enhancing satellite image-text retrieval with cross-domain adaptation. InProceedings of the 32nd ACM International Conference on Multimedia. 6307–6315
-
[75]
high-intensity industrial zone
Xingchen Zou, Yuhao Yang, Zheng Chen, Xixuan Hao, Yiqi Chen, Chao Huang, and Yuxuan Liang. 2025. Traffic-r1: Reinforced llms bring human-like reasoning to traffic signal control systems.arXiv preprint arXiv:2508.02344(2025). KDD ’26, August 09–13, 2026, Jeju Island, Republic of Korea Xixuan Hao et al. Appendix A Detailed Introduction of Tool-Use In this s...
arXiv 2025
-
[2023]
InProceedings of the AAAI Conference on Artificial Intelligence, Vol
Point-to-region co-learning for poverty mapping at high resolution using satellite imagery. InProceedings of the AAAI Conference on Artificial Intelligence, Vol. 37. 14321–14328
-
[2024]
Urban region representation learning with human trajectories: a multi-view approach incorporating transition, spatial, and temporal perspectives.GIScience & Remote Sensing61, 1 (2024), 2387392
2024
-
[2025]
Unlocking Location Intelligence: A Survey from Deep Learning to The LLM Era.arXiv preprint arXiv:2505.09651(2025)
arXiv 2025
This paper was first reviewed by deepseek-v4-flash on August 2, 2026.
discussion (0)
Sign in with ORCID, Apple, or X to comment. Anyone can read and Pith papers without signing in.