REVIEW 3 major objections 4 minor 90 references
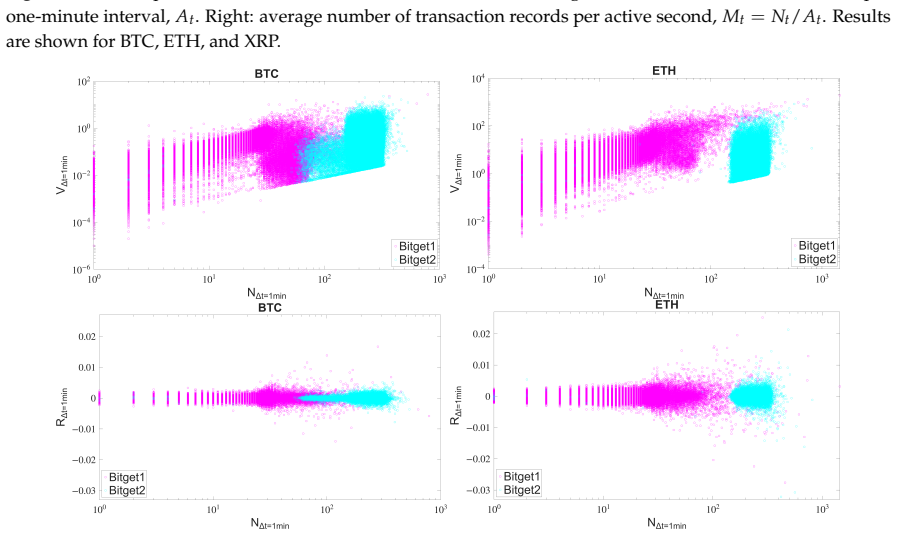
Transaction counts on Bitget for BTC and ETH decouple from volume and returns after May 21, 2025, revealing a noise-like regime in trading activity.
Reviewed by Pith at T0; open to challenge. T0 means a machine referee read the full paper against a public rubric. the ladder, T0–T4 →
A complexity-measure analysis of 1-minute crypto trade data reveals a Bitget-specific post-May-2025 surge in small, noise-like BTC and ETH transactions that decouple from volume and returns.
T0 review reviewed 2026-08-02 challenge →
load-bearing objection A solid, honestly-hedged case study of a Bitget-specific transaction-count anomaly; the finding is real but the single data source keeps it from being conclusive. the 3 major comments →
Detecting unusual trading patterns on cryptocurrency exchanges by means of complexity measures
The pith
A machine-rendered reading of the paper's core claim, the machinery that carries it, and where it could break.
The reading
Core claim
The paper's core claim is that, after May 21, 2025, the transaction-count process for BTC and ETH on Bitget becomes statistically different from its own earlier behavior and from the corresponding processes on Binance, Kraken, and KuCoin, while price dynamics remain largely synchronized across exchanges. The elevated transaction counts are driven by low-volume trades that do not translate into proportional volume or price impact. This is supported by a within-minute decomposition: active seconds per minute rise from about 12 to 55.5 for BTC, and the average records per active second rise from 1.9 to 3.3. Removing the smallest trades makes no-trade intervals visible again. The anomaly is not
What carries the argument
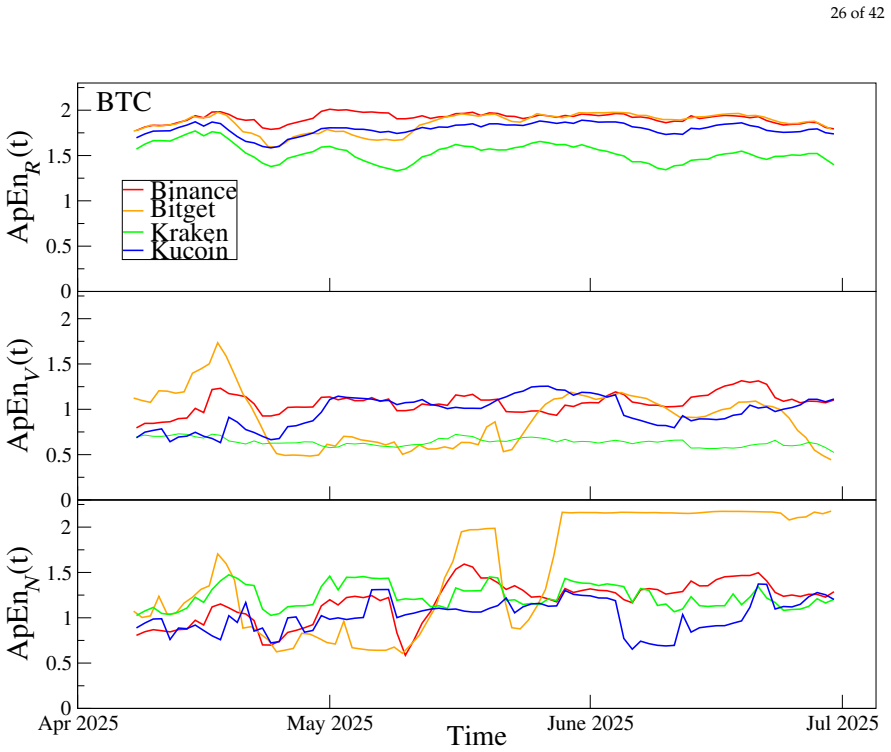
The framework combines multifractal detrended fluctuation analysis (MFDFA), multifractal detrended cross-correlation analysis (MFCCA), the q-dependent detrended cross-correlation coefficient ρ(q,s), approximate entropy (ApEn) and sample entropy (SampEn) computed in rolling windows, autocorrelation functions, tail distributions, and a formal change-point detection procedure. The central object carrying the argument is the detrended cross-correlation coefficient ρ(q=2,s) between pairs of |R|, V, and N, together with the entropy measures on N. These tools identify a time-localized structural break around May 21, 2025, and quantify how the transaction-count process loses its usual coupling to vo
Load-bearing premise
The analysis defines 'usual' trading behavior empirically from Binance, Kraken, KuCoin, and Bitget's pre-May data; if Bitget changed its reporting, fee structure, or incentives around May 21, the detected anomaly could be a benign platform change rather than artificially generated transactions.
What would settle it
If public records show that Bitget altered its timestamp precision, minimum trade size, fee schedule, or market-making rebates on or around May 21, 2025, or if account-level data reveal that the low-volume trades originate from a small set of known market makers, the anomaly interpretation would be weakened. Conversely, if the same framework flags no similar pattern on other exchanges over the same window, that would support an exchange-specific artificial-activity explanation.
If this is right
- Transaction-count series are a highly informative diagnostic for exchange-specific anomalies that remain hidden in price-based measures.
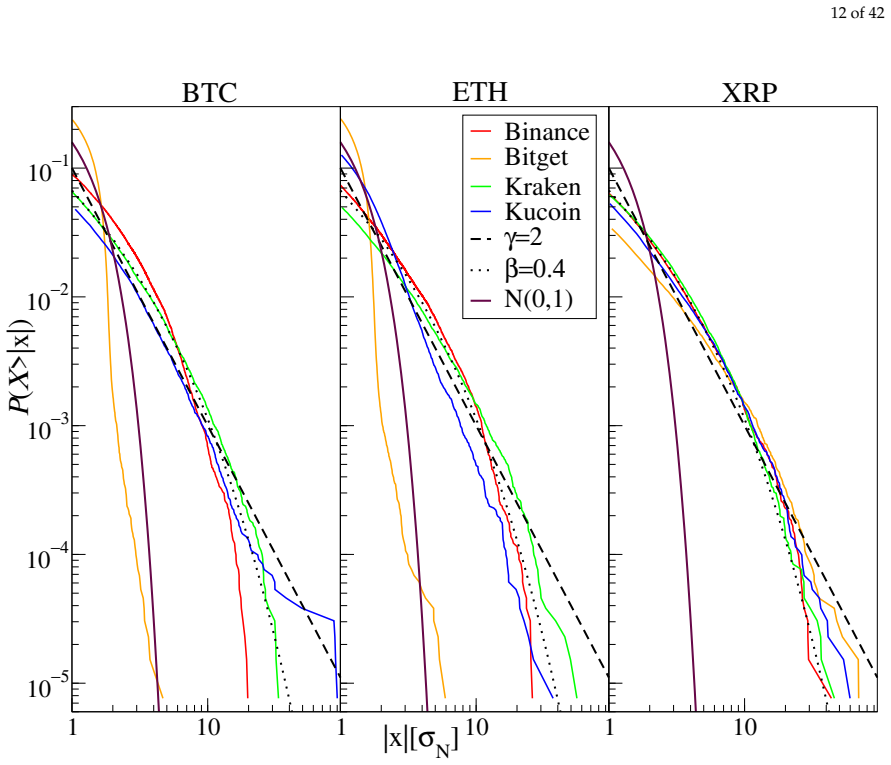
- A persistent departure from empirically defined regular trading patterns -- narrower distributions, weakened autocorrelations, reduced multifractal organization, and weaker cross-correlations -- can flag unusual trading activity even without account-level data.
- The Bitget anomaly is specific to BTC and ETH, not exchange-wide, since XRP on the same exchange does not exhibit the same regime shift.
- The post-break regime is consistent with a noise-like component in trading activity, likely driven by extremely small trades that add records without adding proportionally to volume or price impact.
- Complexity-based indicators can complement standard liquidity and price diagnostics for assessing the reliability of reported market activity on centralized cryptocurrency exchanges.
Where Pith is reading between the lines
- If the anomaly stems from a benign platform change -- such as altered timestamp granularity, fee tiers, or market-making incentives -- then the same framework applied to order-book depth, trade direction, or account-level data could separate natural fragmentation from artificial inflation.
- The simultaneity of the BTC and ETH regime changes, combined with weak cross-asset transaction-count correlations, suggests independent or separately coordinated generation processes rather than a single synchronized market-wide event; testing the timing of order submissions could clarify this.
- The rolling-window entropy and cross-correlation approach could be applied prospectively to other exchanges and assets as a near-real-time surveillance tool for wash-trading-like patterns.
- A testable extension is to compare Bitget's post-May behavior with specific exchange announcements or fee changes: if the regime shift aligns with a known policy change, the benign-mechanism explanation becomes more likely than artificial activity.
Editorial analysis
A structured set of objections, weighed in public.
Referee Report
Summary. The paper proposes a diagnostic framework for detecting unusual trading patterns on centralized cryptocurrency exchanges using complexity and statistical-structure measures. It analyzes 1-minute log-returns, trading volume, and transaction counts for BTC, ETH, and XRP on Binance, Bitget, Kraken, and KuCoin over April 1–June 30, 2025, using CCDFs, autocorrelations, MFDFA, MFCCA, detrended cross-correlation coefficients, ApEn/SampEn, and change-point detection. The central claim is that after May 21, 2025, the BTC and ETH transaction-count processes on Bitget changed structurally: transaction counts increased sharply, became near-Gaussian and weakly autocorrelated, lost multifractal organization, and became weakly cross-correlated with volume and returns, while XRP on Bitget and all other exchanges remained unaffected. The authors interpret this as a noise-like component possibly consistent with artificial activity, but explicitly caution that direct proof of wash trading is absent.
Significance. If the empirical finding holds, the paper demonstrates that complexity-based measures can reveal an exchange- and asset-specific anomaly that is invisible in standard price-based indicators. The study's main strengths are the converging evidence across complementary measures, the XRP control, the within-minute active-second decomposition, and the robustness checks for ApEn/SampEn with varying embedding dimensions and tolerances. The principal weakness is the unresolved ambiguity between a genuine trading anomaly and a data-reporting artifact, which the authors acknowledge in Section 9. The contribution is a useful empirical case study and diagnostic demonstration, conditional on data fidelity.
major comments (3)
- [Sec. 3 and Sec. 9] The load-bearing assumption is that the post-May 21 Bitget BTC/ETH transaction-record series measures the same economic construct as the pre-break series. Section 9 explicitly concedes that the analysis 'could not unambiguously distinguish between these possible mechanisms.' The XRP control and the active-second decomposition (Sec. 8, Eqs. 18-20) mitigate exchange-wide or timestamp-granularity artifacts, but they do not rule out an asset-specific reporting change (e.g., a new fee tier, market-making incentive, or feed duplication for BTC/ETH only). Because the title and abstract claim detection of 'unusual trading patterns,' the manuscript must either validate the anomaly with an independent tick-level data source or reframe the claim as an anomaly in the transaction-record series and explain how the framework separates feed artifacts from trading behavior.
- [Sec. 8] The two-period comparison is built on the change point returned by findchangepts applied to the full sample (maximum one change point, minimum distance 1440). All Bitget1-versus-Bitget2 contrasts in Figs. 29-35 are therefore in-sample and may overstate the regime difference. The rolling-window analyses provide supporting evidence, but the formal pre/post comparison would be substantially stronger with an out-of-sample validation or a post-selection inference procedure (e.g., a permutation or block-bootstrap test that accounts for the change-point search). Please report the statistical uncertainty of the change point and the size of the between-period differences.
- [Sec. 8, Eq. (20)] The claim that 'even under the conservative aggregation ... the post-break activity remains more than four times higher' assumes that the only possible reporting artifact is the duplication of records within the same one-second timestamp. If a reporting change introduced records with distinct second timestamps (e.g., synthetic trades or additional record types), the active-second decomposition is not conservative. The manuscript should state this assumption explicitly and, if feasible, validate the timestamp behavior against order-book or other independent data.
minor comments (4)
- [Throughout] The exchange name is spelled 'KuCoin' in the text but 'Kucoin' in several figure labels and captions (e.g., Figs. 4, 7, 10). Please standardize.
- [Author affiliations] The correspondence line lists two email addresses and the asterisk is placed next to Stanisław Drozdz; please clarify who is the corresponding author.
- [Sec. 2.1, Eq. (7)] The denominator of ρ(q,s) writes FqXX(s)FqYY(s) without the 1/q exponent; this is consistent with the cited literature but may confuse readers. A parenthetical reminder that the denominator is evaluated at the same q would help.
- [Data Availability] The Data Availability Statement lists only public APIs; providing analysis scripts or a reproducibility repository would strengthen the paper's usefulness, especially because the anomaly claim rests on a specific data-processing pipeline.
Circularity Check
No significant circularity: the paper is an empirical comparative analysis whose anomaly claim is a direct statistical comparison, not a fitted parameter renamed as a prediction.
full rationale
The paper does not derive a prediction from a fitted parameter. The central claim—that BTC and ETH transaction counts on Bitget after May 21, 2025, are statistically unusual—rests on direct comparisons between raw 1-min series of N, V, and |R| across exchanges and across pre/post subsamples. The benchmark for 'usual' behavior is explicitly operationalized as the empirical regularities observed on Binance, Kraken, KuCoin, and on Bitget before the break; the anomaly is then detected as a departure from those regularities. This is a control-comparison design, not a self-referential derivation. The change point is estimated from the log(1+N) series, and the sample is split at that point, but the downstream characterizations (trade-size histograms, V–N scatter separation, autocorrelations, entropy, detrended cross-correlations) are measured independently and are not logically entailed by the mere existence of a mean shift in N. The paper also explicitly concedes that it cannot distinguish between artifactual reporting changes and genuine unusual trading, which further limits any claim that the mechanism is derived from the framework. The many self-citations are to established or previously published methodology and stylized-fact references; none of them is used as a uniqueness theorem or as the sole justification for the empirical anomaly. Thus no circular step can be quoted or exhibited.
Axiom & Free-Parameter Ledger
free parameters (6)
- ApEn/SampEn embedding dimension m and tolerance r =
m=2, r=0.2σ
- Rolling window length and step =
10,080 min (7 days) window, 1,440 min (1 day) step
- MFDFA polynomial detrending order =
l=2
- Time scale s for rolling-window ρ =
s=10
- Trade-size thresholds for filtering =
0.001 BTC, 0.01 ETH
- Change-point minimum distance =
1440 observations (1 day)
axioms (5)
- standard math MFDFA, MFCCA, DCCA, ApEn, and SampEn definitions and their properties are taken as correct.
- domain assumption The empirical regularities on Binance, Kraken, and KuCoin, and in Bitget's early period, define the 'usual' baseline.
- domain assumption Public exchange APIs provide accurate and complete trade-level data.
- domain assumption A single mean-shift change point with a 1-day minimum distance is adequate to characterize the regime break.
- domain assumption One-second timestamp resolution limits the identification of order-splitting; identical timestamps are not treated as child fills.
Cite this review
Pith. "Pith review of Detecting unusual trading patterns on cryptocurrency exchanges by means of complexity measures." pith.science (2026). https://pith.science/paper/BRHDNOPS
@misc{pith2026260713916,
  author       = {Pith},
  title        = {Pith review of: Detecting unusual trading patterns on cryptocurrency exchanges by means of complexity measures},
  year         = {2026},
  howpublished = {\url{https://pith.science/paper/BRHDNOPS}},
  note         = {Machine review of arXiv:2607.13916}
}
read the original abstract
Artificial transaction generation remains an important source of potential market manipulation on cryptocurrency exchanges, as it may distort reported liquidity and reduce market transparency. This study proposes a diagnostic framework for detecting unusual trading patterns based on complexity and statistical-structure measures derived from high-frequency trade-level data. The analysis considers log-returns, trading volume, and transaction counts, using tail distributions, autocorrelation functions, multifractal characteristics, approximate entropy, and detrended cross-correlations. The methodology is applied to BTC, ETH, and XRP traded on Binance, Bitget, KuCoin, and Kraken over the period from April 1 to June 30, 2025. The results reveal a pronounced anomaly on Bitget for BTC and ETH after mid-May 2025. The number of transactions increases sharply, but there is no proportional increase in traded volume or return fluctuations. This regime is characterised by numerous low-volume trades, weaker autocorrelations, reduced multifractal organisation, higher short-pattern irregularity, and weaker cross-correlations involving the transaction-count series. These features are consistent with a noise-like component in trading activity and may indicate artificially increased transaction counts, although they do not provide direct proof of wash trading. The findings show that complexity-based indicators can be useful for detecting exchange-specific trading anomalies that remain hidden in price-based measures.
Figures








Reference graph
Works this paper leans on
-
[2]
Chen, J.; Lin, D.; Wu, J. Do cryptocurrency exchanges fake trading volumes? An empirical analysis of wash trading based on data mining.Physica A2022,586, 126405. https://doi.org/10.1016/j.physa.2021.126405
arXiv 2021
-
[3]
Amiram, D.; Lyandres, E.; Rabetti, D. Trading Volume Manipulation and Competition Among Centralized Crypto Exchanges.Management Science2025,71, 8604–8622. https://doi.org/10.1287/mnsc.2021.02903
arXiv 2021
-
[4]
Wash trading at cryptocurrency exchanges.Finance Research Letters2021, 43, 101982
Pennec, G.L.; Fiedler, I.; Ante, L. Wash trading at cryptocurrency exchanges.Finance Research Letters2021, 43, 101982. https://doi.org/10.1016/j.frl.2021.101982
arXiv 2021
-
[5]
Detecting and Quantifying Wash Trading on Decentralized Cryptocurrency Exchanges
Victor, F.; Weintraud, A.M. Detecting and Quantifying Wash Trading on Decentralized Cryptocurrency Exchanges. In Proceedings of the The Web Conference 2021, 2021, pp. 23–32. https://doi.org/10.1145/3442 381.3449824
-
[6]
Crypto Wash Trading.Management Science2023,69, 6427–6454
Cong, L.W.; Li, X.; Tang, K.; Yang, Y. Crypto Wash Trading.Management Science2023,69, 6427–6454
-
[7]
Wash Trading Detection Techniques for Centralised Cryptocurrency Exchange Services
Di Francesco Maesa, D.; Ricci, L.; Santarella, L.; Yimame, Y. Wash Trading Detection Techniques for Centralised Cryptocurrency Exchange Services. In Proceedings of the 2024 5th International Artificial Intelligence and Blockchain Conference, 2024, AIBC ’24. https://doi.org/10.1145/3702359.3702363
arXiv 2024
-
[8]
Determinants of wash trading in major cryptoexchanges
Sila, J.; Kocenda, E.; Kristoufek, L.; Kukacka, J. Determinants of wash trading in major cryptoexchanges. International Review of Financial Analysis2026,117, 105283. https://doi.org/https://doi.org/10.1016/j.irfa.20 26.105283
-
[9]
W ˛ atorek, M.; Królczyk, M.; Kwapie ´ n, J.; Stanisz, T.; Dro˙zd˙z, S. Approaching Multifractal Complexity in Decentralized Cryptocurrency Trading.Fractal and Fractional2024,8. https://doi.org/10.3390/fractalfract8 110652
-
[10]
Szydło, P .; W ˛ atorek, M.; Kwapie ´ n, J.; Dro˙zd ˙z, S. Characteristics of price related fluctuations in non-fungible token (NFT) market.Chaos2024,34, 013108. https://doi.org/10.1063/5.0185306
-
[11]
Correlations versus noise in the NFT market.Chaos2024, 34, 073112
W ˛ atorek, M.; Szydło, P .; Kwapie ´ n, J.; Dro˙zd˙z, S. Correlations versus noise in the NFT market.Chaos2024, 34, 073112. https://doi.org/10.1063/5.0214399. 39 of 42
-
[12]
Understanding Flash-Loan-based Wash Trading
Gan, R.; Wang, L.; Ruan, X.; Lin, X. Understanding Flash-Loan-based Wash Trading. In Proceedings of the 4th ACM Conference on Advances in Financial Technologies, New York, NY, USA, 2023; AFT ’22, p. 74–88. https://doi.org/10.1145/3558535.3559793
arXiv 2023
-
[13]
Collibus, F.M.D.; Campajola, C.; Caldarelli, G.; Tessone, C.J. Patterns and centralisation in Ethereum-based token transaction networks.Frontiers in Physics2024,12, 1305167. https://doi.org/10.3389/fphy.2024.13051 67
arXiv 2024
-
[14]
The Dark Side of NFTs: A Large-Scale Empirical Study of Wash Trading
Chen, S.; Chen, J.; Yu, J.; Luo, X.; Wang, Y. The Dark Side of NFTs: A Large-Scale Empirical Study of Wash Trading. In Proceedings of the 15th Asia-Pacific Symposium on Internetware, New York, NY, USA, 2024; Internetware ’24, p. 447–456. https://doi.org/10.1145/3671016.3674808
arXiv 2024
-
[15]
Exposing Stealthy Wash Trading on Automated Market Maker Exchanges
Gan, R.; Wang, L.; Xue, L.; Lin, X. Exposing Stealthy Wash Trading on Automated Market Maker Exchanges. ACM Transactions on Internet Technology2024,24, 1–30
-
[16]
Unveiling Wash Trading in Popular NFT Markets
Niu, Y.; Li, X.; Peng, H.; Li, W. Unveiling Wash Trading in Popular NFT Markets. In Proceedings of the Companion Proceedings of the ACM Web Conference 2024, New York, NY, USA, 2024; WWW ’24, p. 730–733. https://doi.org/10.1145/3589335.3651580
arXiv 2024
-
[17]
Toši´ c, A.; Viˇ ciˇ c, J.; Hrovatin, N. Beyond the surface: advanced wash-trading detection in decentralized NFT markets.Financial Innovation2025,11, 86. https://doi.org/10.1186/s40854-025-00766-z
-
[18]
Physical approach to complex systems.Physics Reports2012,515, 115–226
Kwapie ´ n, J.; Dro˙zd˙z, S. Physical approach to complex systems.Physics Reports2012,515, 115–226. https: //doi.org/10.1016/j.physrep.2012.01.007
-
[19]
Scaling behaviour in the dynamics of an economic index.Nature1995, 376, 46–49
Mantegna, R.N.; Stanley, H.E. Scaling behaviour in the dynamics of an economic index.Nature1995, 376, 46–49. https://doi.org/10.1038/376046a0
-
[20]
Gopikrishnan, P .; Meyer, M.; Amaral, L.N.; Stanley, H.E. Inverse cubic law for the distribution of stock price variations.The European Physical Journal B1998,3, 139–140. https://doi.org/10.1007/s100510050292
-
[21]
Scaling of the distribution of fluctuations of financial market indices.Physical Review E1999,60, 5305–5316
Gopikrishnan, P .; Plerou, V .; Nunes Amaral, L.A.; Meyer, M.; Stanley, H.E. Scaling of the distribution of fluctuations of financial market indices.Physical Review E1999,60, 5305–5316
-
[22]
Cont, R. Empirical properties of asset returns: stylized facts and statistical issues.Quantitative Finance2001, 1, 223–236. https://doi.org/10.1080/713665670
-
[23]
Price impact
Bouchaud, J.P . Price impact. InEncyclopedia of Quantitative Finance; Cambridge University Press, 2010; pp. 1–6
2010
-
[24]
S’afari, S.A.; Janisch, M.; Lehéricy, T. International Financial Markets Through 150 Years: Evaluating Stylized Facts.The Journal of Finance and Data Science2026, p. 100196. https://doi.org/10.1016/j.jfds.2026.100196
arXiv 2026
-
[25]
Scaling properties of extreme price fluctuations in Bitcoin markets.Physica A2018,510, 400–406
Beguši´ c, S.; Kostanjˇ car, Z.; Stanley, H.E.; Podobnik, B. Scaling properties of extreme price fluctuations in Bitcoin markets.Physica A2018,510, 400–406. https://doi.org/10.1016/j.physa.2018.06.131
-
[26]
Dro˙zd˙z, S.; G˛ ebarowski, R.; Minati, L.; O´ swi˛ ecimka, P .; W ˛ atorek, M. Bitcoin market route to maturity? Evidence from return fluctuations, temporal correlations and multiscaling effects.Chaos2018,28, 071101. https://doi.org/10.1063/1.5036517
-
[27]
Signatures of the crypto-currency market decoupling from the Forex.Future Internet2019,11
Dro˙zd ˙z, S.; Minati, L.; O´ swi˛ ecimka, P .; Stanuszek, M.; W ˛ atorek, M. Signatures of the crypto-currency market decoupling from the Forex.Future Internet2019,11. https://doi.org/10.3390/fi11070154
-
[28]
Dro˙zd ˙z, S.; Kwapie ´ n, J.; O´ swi˛ ecimka, P .; Stanisz, T.; W ˛ atorek, M. Complexity in economic and social systems: Cryptocurrency market at around COVID-19.Entropy2020,22, 1043. https://doi.org/10.3390/E22091043
-
[29]
James, N.; Menzies, M.; Chan, J. Changes to the extreme and erratic behaviour of cryptocurrencies during COVID-19.Physica A2021,565, 125581. https://doi.org/10.1016/j.physa.2020.125581
arXiv 2020
-
[30]
Abdullaev, N.; Ibragimov, R. Stylized facts of cryptocurrency markets: Robust definitions and inference approaches.Emerging Markets Review2026,72, 101440. https://doi.org/10.1016/j.ememar.2026.101440
arXiv 2026
-
[31]
Statistical properties and multifractality of Bitcoin.Physica A2018,506, 507–519
Takaishi, T. Statistical properties and multifractality of Bitcoin.Physica A2018,506, 507–519. https: //doi.org/10.1016/j.physa.2018.04.046
-
[32]
Multifractal analysis of Bitcoin market.Physica A 2018,512, 954–967
da Silva Filho, A.C.; Maganini, N.D.; de Almeida, E.F. Multifractal analysis of Bitcoin market.Physica A 2018,512, 954–967
2018
-
[33]
Mensi, W.; Lee, Y.J.; Al-Yahyaee, K.H.; Sensoy, A.; Yoon, S.M. Intraday downward/upward multifractality and long memory in Bitcoin and Ethereum markets: An asymmetric multifractal detrended fluctuation analysis.Finance Research Letters2019,31, 19–25
-
[34]
The high frequency multifractal properties of Bitcoin.Physica A2019,520, 62–71
Stavroyiannis, S.; Babalos, V .; Bekiros, S.; Lahmiri, S.; Uddin, G.S. The high frequency multifractal properties of Bitcoin.Physica A2019,520, 62–71. https://doi.org/10.1016/j.physa.2018.12.037
-
[35]
Stosic, D.; Stosic, D.; Ludermir, T.B.; Stosic, T. Multifractal behavior of price and volume changes in the cryptocurrency market.Physica A2019,520, 54–61. https://doi.org/10.1016/j.physa.2018.12.038. 40 of 42
-
[36]
Market efficiency, liquidity, and multifractality of Bitcoin: A dynamic study.Asia- Pacific Financial Markets2020,27, 145–154
Takaishi, T.; Adachi, T. Market efficiency, liquidity, and multifractality of Bitcoin: A dynamic study.Asia- Pacific Financial Markets2020,27, 145–154
-
[37]
Long-range dependence, multi-fractality and volume-return causality of ether market.Chaos2020,30, 011101
Han, Q.; Wu, J.; Zheng, Z. Long-range dependence, multi-fractality and volume-return causality of ether market.Chaos2020,30, 011101
-
[38]
Analysis of inter-transaction time fluctuations in the cryptocurrency market.Chaos2022,32, 083142
Kwapie ´ n, J.; W ˛ atorek, M.; Bezbradica, M.; Crane, M.; Tan Mai, T.; Dro˙zd˙z, S. Analysis of inter-transaction time fluctuations in the cryptocurrency market.Chaos2022,32, 083142. https://doi.org/10.1063/5.0104707
-
[39]
Cryptocurrency market efficiency in short- and long-term horizons during COVID- 19: An asymmetric multifractal analysis approach.Finance Research Letters2022,46, 102319
Kakinaka, S.; Umeno, K. Cryptocurrency market efficiency in short- and long-term horizons during COVID- 19: An asymmetric multifractal analysis approach.Finance Research Letters2022,46, 102319
-
[40]
Ali, H.; Aftab, M.; Aslam, F.; Ferreira, P . Inner Multifractal Dynamics in the Jumps of Cryptocurrency and Forex Markets.Fractal and Fractional2024,8. https://doi.org/10.3390/fractalfract8100571
-
[41]
Choi, I. Intrinsic multifractality and adaptive efficiency in Bitcoin: Disentangling sources of scaling complexity across market regimes.Physica A: Statistical Mechanics and its Applications2026,697, 131735. https://doi.org/10.1016/j.physa.2026.131735
arXiv 2026
-
[42]
Multifractal cross-correlations of bitcoin and ether trading characteristics in the post-COVID-19 time.Future Internet2022,14
W ˛ atorek, M.; Kwapie ´ n, J.; Dro˙zd ˙z, S. Multifractal cross-correlations of bitcoin and ether trading characteristics in the post-COVID-19 time.Future Internet2022,14
-
[43]
What is mature and what is still emerging in the cryptocurrency market?Entropy2023,25
Dro˙zd˙z, S.; Kwapie ´ n, J.; W ˛ atorek, M. What is mature and what is still emerging in the cryptocurrency market?Entropy2023,25. https://doi.org/10.3390/e25050772
-
[44]
Podobnik, B.; Stanley, H.E. Detrended cross-correlation analysis: A new method for analyzing two nonstation- ary time series.Physical Review Letters2008,100, 084102. https://doi.org/10.1103/PhysRevLett.100.084102
-
[45]
Zebende, G. DCCA cross-correlation coefficient: Quantifying level of cross-correlation.Physica A2011, 390, 614–618. https://doi.org/10.1016/j.physa.2010.10.022
-
[46]
Kwapie ´ n, J.; O´ swi˛ ecimka, P .; Dro˙zd ˙z, S. Detrended fluctuation analysis made flexible to detect range of cross- correlated fluctuations.Physical Review E2015,92, 052815. https://doi.org/10.1103/PhysRevE.92.052815
-
[47]
Pincus, S.M. Approximate entropy as a measure of system complexity.Proceedings of the National Academy of Sciences1991,88, 2297–2301. https://doi.org/10.1073/pnas.88.6.2297
-
[48]
Trading and arbitrage in cryptocurrency markets.Journal of Financial Economics2020, 135, 293–319
Makarov, I.; Schoar, A. Trading and arbitrage in cryptocurrency markets.Journal of Financial Economics2020, 135, 293–319
-
[49]
The Role of Binance in Bitcoin Volatility Transmission.Applied Mathematical Finance2022,29, 1–32
Carol Alexander, D.F.H.; Kaeck, A. The Role of Binance in Bitcoin Volatility Transmission.Applied Mathematical Finance2022,29, 1–32
-
[50]
Petukhina, A.A.; Reule, R.C.G.; Härdle, W.K. Rise of the machines? Intraday high-frequency trading patterns of cryptocurrencies.The European Journal of Finance2021,27, 8–30. https://doi.org/10.1080/1351847X.2020.1 789684
-
[51]
Bitcoin spot and futures market microstructure.Journal of Futures Markets2021, 41, 194–225
Aleti, S.; Mizrach, B. Bitcoin spot and futures market microstructure.Journal of Futures Markets2021, 41, 194–225
-
[52]
W ˛ atorek, M.; Skupie ´ n, M.; Kwapie ´ n, J.; Dro˙zd˙z, S. Decomposing cryptocurrency high-frequency price dynamics into recurring and noisy components.Chaos2023,33, 083146. https://doi.org/10.1063/5.0165635
-
[53]
Wang, J.N.; Liu, H.C.; Hsu, Y.T. Time-of-day periodicities of trading volume and volatility in Bitcoin exchange: Does the stock market matter?Finance Research Letters2020,36, 101303. https://doi.org/10.1016/ j.frl.2019.101303
arXiv 2019
-
[54]
Hansen, P .R.; Kim, C.; Kimbrough, W. Periodicity in Cryptocurrency Volatility and Liquidity.Journal of Financial Econometrics2024,22, 224–251. https://doi.org/10.1093/jjfinec/nbac034
-
[55]
Dyhrberg, A.H.; Foley, S.; Svec, J. How investible is Bitcoin? Analyzing the liquidity and transaction costs of Bitcoin markets.Economics Letters2018,171, 140–143. https://doi.org/10.1016/j.econlet.2018.07.032
-
[56]
Multifractal detrended fluctuation analysis of nonstationary time series.Physica A2002,316, 87–114
Kantelhardt, J.W.; Zschiegner, S.A.; Koscielny-Bunde, E.; Havlin, S.; Bunde, A.; Stanley, H.E. Multifractal detrended fluctuation analysis of nonstationary time series.Physica A2002,316, 87–114. https://doi.org/10 .1016/s0378-4371(02)01383-3
-
[57]
Mosaic organization of DNA nucleotides.Physical Review E1994,49, 1685–1689
Peng, C.K.; Buldyrev, S.V .; Havlin, S.; Simons, M.; Stanley, H.E.; Goldberger, A.L. Mosaic organization of DNA nucleotides.Physical Review E1994,49, 1685–1689. https://doi.org/10.1103/PhysRevE.49.1685
-
[58]
Zhou, W.X. Multifractal detrended cross-correlation analysis for two nonstationary signals.Physical Review E2008,77, 066211. https://doi.org/10.1103/PhysRevE.77.066211
-
[59]
Detrended cross-correlation analysis consistently extended to multifractality.Physical Review E2014,89, 023305
O´ swi˛ ecimka, P .; Dro˙zd˙z, S.; Forczek, M.; Jadach, S.; Kwapie ´ n, J. Detrended cross-correlation analysis consistently extended to multifractality.Physical Review E2014,89, 023305. https://doi.org/10.1103/ PhysRevE.89.023305
-
[60]
Multifractal analysis of financial markets: A review.Reports on Progress in Physics2019,82, 125901
Jiang, Z.Q.; Xie, W.J.; Zhou, W.X.; Sornette, D. Multifractal analysis of financial markets: A review.Reports on Progress in Physics2019,82, 125901. https://doi.org/10.1088/1361-6633/ab42fb. 41 of 42
-
[61]
Kwapie ´ n, J.; Blasiak, P .; Dro˙zd ˙z, S.; O´ swi˛ ecimka, P . Genuine multifractality in time series is due to temporal correlations.Physical Review E2023,107, 034139. https://doi.org/10.1103/PhysRevE.107.034139
-
[62]
Multifractality and its sources in the digital currency market.Future Internet2025,17
Dro˙zd ˙z, S.; Kluszczy ´ nski, R.; Kwapie ´ n, J.; W ˛ atorek, M. Multifractality and its sources in the digital currency market.Future Internet2025,17. https://doi.org/10.3390/fi17100470
-
[63]
Effect of Detrending on Multifractal Characteristics
O´ swi˛ ecimka, P .; Dro˙zd˙z, S.; Kwapie ´ n, J.; Górski, A.Z. Effect of Detrending on Multifractal Characteristics. Acta Physica Polonica A2013,123, 597–603. https://doi.org/10.12693/APhysPolA.123.597
-
[64]
Fractal measures and their singularities: The characterization of strange sets.Physical Review A1986,33, 1141–1151
Halsey, T.C.; Jensen, M.H.; Kadanoff, L.P .; Procaccia, I.; Shraiman, B.I. Fractal measures and their singularities: The characterization of strange sets.Physical Review A1986,33, 1141–1151
-
[65]
Dro˙zd˙z, S.; O´ swi˛ ecimka, P . Detecting and interpreting distortions in hierarchical organization of complex time series.Physical Review E2015,91, 030902. https://doi.org/10.1103/PhysRevE.91.030902
-
[66]
Richman, J.S.; Moorman, J.R. Physiological time-series analysis using approximate entropy and sample entropy.American Journal of Physiology-Heart and Circulatory Physiology2000,278, H2039–H2049. https: //doi.org/10.1152/ajpheart.2000.278.6.H2039
-
[67]
https://www.binance.com/
Binance. https://www.binance.com/
-
[68]
https://www.bitget.com/
Bitget. https://www.bitget.com/
-
[69]
https://www.kucoin.com/
KuCoin. https://www.kucoin.com/
-
[70]
https://www.kraken.com/
Kraken. https://www.kraken.com/
-
[71]
https://www.coingecko.com/en/exchanges
Top Crypto Exchanges Ranked by Trust Score. https://www.coingecko.com/en/exchanges
-
[72]
fat tails
Laherrère, J.; Sornette, D. Stretched exponential distributions in nature and economy: "fat tails" with characteristic scales.The European Physical Journal B1998,2, 525–539
-
[73]
The Variation of Certain Speculative Prices.The Journal of Business1963,36, 394–419
Mandelbrot, B. The Variation of Certain Speculative Prices.The Journal of Business1963,36, 394–419
-
[74]
Financial return distributions: Past, present, and covid-19.Entropy 2021,23, 884
W ˛ atorek, M.; Kwapie ´ n, J.; Dro˙zd˙z, S. Financial return distributions: Past, present, and covid-19.Entropy 2021,23, 884. https://doi.org/10.3390/e23070884
-
[75]
A long memory property of stock market returns and a new model
Ding, Z.; Granger, C.W.; Engle, R.F. A long memory property of stock market returns and a new model. Journal of Empirical Finance1993,1, 83–106. https://doi.org/10.1016/0927-5398(93)90006-D
-
[76]
James, N. Dynamics, behaviours, and anomaly persistence in cryptocurrencies and equities surrounding COVID-19.Physica A2021,570, 125831. https://doi.org/10.1016/j.physa.2021.125831
arXiv 2021
-
[77]
James, N.; Menzies, M. Collective correlations, dynamics, and behavioural inconsistencies of the cryptocur- rency market over time.Nonlinear Dynamics2022,107, 4001–4017. https://doi.org/10.1007/s11071-021-071 66-9
-
[78]
Brouty, X.; Garcin, M. Fractal properties, information theory, and market efficiency.Chaos, Solitons & Fractals 2024,180, 114543. https://doi.org/10.1016/j.chaos.2024.114543
arXiv 2024
-
[79]
Bui, H.Q.; Schinckus, C.; Al-Jaifi, H. Long-range correlations in cryptocurrency markets: A multi-scale DFA approach.Physica A2025,661, 130417. https://doi.org/10.1016/j.physa.2025.130417
arXiv 2025
-
[80]
Disentangling Sources of Multifractality in Time Series.Mathematics2025,13
Kluszczy ´ nski, R.; Dro˙zd˙z, S.; Kwapie ´ n, J.; Stanisz, T.; W ˛ atorek, M. Disentangling Sources of Multifractality in Time Series.Mathematics2025,13. https://doi.org/10.3390/math13020205
-
[81]
What really causes large price changes?Quantitative Finance2004,4, 383–397
Farmer, J.D.; Gillemot, L.; Lillo, F.; Mike, S.; Sen, A. What really causes large price changes?Quantitative Finance2004,4, 383–397. https://doi.org/10.1080/14697680400008627
This paper was first reviewed by deepseek-v4-flash on August 2, 2026.
discussion (0)
Sign in with ORCID, Apple, or X to comment. Anyone can read and Pith papers without signing in.